International Journal of Computer Sciences and Engineering Open Access Research Paper
Volume-6, Issue-3
E-ISSN: 2347-2693
A Moving Window Search Method for Detection of Pole Like Objects Using Mobile Laser Scanner Data A. Husain1*, R.C. Vaishya2, Md. Omar Sarif3 1*
2
GIS CELL, Motilal Nehru National Institute of Technology, Allahabad, India| Civil Engineering, Motilal Nehru National Institute of Technology, Allahabad, India 3 GIS CELL, Motilal Nehru National Institute of Technology, Allahabad, India *
Corresponding Author:
[email protected] Available online at: www.ijcseonline.org
Received: 11/Feb//2018, Revised: 20/Feb2018, Accepted: 14/Mar/2018, Published: 30/Mar/2018
Abstract— Pole-Like Objects (PLOs) in the road environment located nearby the road boundary are important roadway assets. They play vital role in the road safety inspection and road planning. In present study a novel automated method for the detection of PLOs from Mobile Laser Scanner (MLS) point cloud data has been proposed. Proposed method includes four basic steps. Initially ground points are roughly filtered out from the input dataset to reduce the processing of un-necessary points; formerly local window search is performed at non-ground points to find out the concentrated point distribution. Principal Component Analysis (PCA) has been implemented at such concentrated distributed points for the identification of PLOs. In last step of proposed method knowledge based information are used for suppressing the false positives and rectifying the output. Proposed method has been tested on a MLS point cloud data of complex road environment and corresponding PLOs are detected having completeness and correctness of 91.48 % and 86.00 % respectively. Keywords— LiDAR, Pole Like Objects, PCA I.
INTRODUCTION
PLOs play an important role in road environment. Road safety inspection, road planning, traffic management and future driver assistance consider the pole-like objects and its location along the corridor. Collection of pole-like structures information manually or using total station and GPS on a large scale is very time consuming, labor intensive, and costly. Laser scanning or Light Detection And Ranging (LiDAR) systems use lasers to capture three-dimensional (3D) data from a tripod, a mobile vehicle, or an aircraft. Terrestrial laser scanners provide highly accurate (cm level) 3D point clouds, which are a set of vertices representing the surface of the object. These 3D vertices enable designers to experience and work directly with real-world conditions by viewing and manipulating point clouds in computer-aided design softwares. MLS technology is seeing increasing adoption in use for traditional surveying and photogrammetric applications. This increase is due to the continuous development in terms of data capture speed, accuracy and density of point data obtained from these systems. There is a rapid growth in the utilization of MLS systems in many road corridor applications. These systems capture huge point clouds that describe very highly detailed road scenes. Mobile LiDAR system has been designed to collect geo referenced dense point cloud information of objects along the highway © 2018, IJCSE All Rights Reserved
or rural roads. Mobile LiDAR system captures the highly accurate point cloud data at highway speed without interfering with traffic stream [1]. They greatly increase the safety for the surveyors and operators by removing them from the traffic stream. They can also capture the data in the evening or overnight, when there is less traffic, as the LiDAR sensors operate day and night. It is important to automate the detection of different road furniture such as road poles, the curb and the street floor from the point cloud captured by the MLS. This automatically extracted information could be used in many applications such as volume and quantity surveys, right-of-way asset inventory compilation and GIS applications. Extraction of PLOs from MLS data plays key role in various important applications such as reconstruction and modeling of road environment, Automatic Driver Assessment (ADA) which incorporate the road safety problems and traffic management. PLOs are also useful to optimize the road planning having less destruction overhead and city management. Much research has tried to detect the road poles from MLS point clouds. Typically two different approaches based on the format of the input point cloud are present in available literature. The first approach utilizes the cross section information of the point cloud, where the scanning system operates in a profile mode. The second approach utilizes the unorganized point clouds that result from registering multiple 1
International Journal of Computer Sciences and Engineering drivelines. In the later approach there is no neighborhood structure present in the point cloud because it is lost after merging multiple drivelines together. PCA was used for the extraction of different types of road poles [2]. Proposed method was divided in two phases, first phase, examines the effect of the point cloud density and the neighborhood size of segmented linear features. The second phase focuses on the extraction of different types of road poles and how to define their position and radius. Investigation at the local pole pattern was used for the extraction of pole-like structures [3]. Proposed method was based on the characteristic of the pole, where the pole is an upright object and it has a Z extension. Therefore there is a kernel region of specific radius where laser scan points are required to be present and a hollow cylinder where no points are allowed to be present. An assumption that ground points are already removed from input point cloud was established [4]. Proposed algorithm consists of four steps. First, the input point clouds were segmented, as the result; points estimated on each object were grouped. Second, smoothing was applied to each segment. Third, each point was classified into the points of the PLOs, planar objects, and other objects. Finally, the degree of the PLOs of each segment was evaluated, and the segments of the PLO were extracted by thresholding. A percentile based pole recognition algorithm was proposed [5]. Algorithm states that the vertical poles are very common in road area. Instead of the analyzing the whole candidate, segmentation of the data on the basis of height percentile was performed. After dividing the candidate into height percentiles, a certain percentile was divided into horizontal slices. For each slice a two-dimensional enclosing rectangle was fitted to the points represented in the XY plane. Based on the existing algorithm a method for the extraction of pole like objects was proposed [6]. Method was divided in five phases; rough classification, rule-based tree detection, percentile-based pole extraction, and knowledge-based further classification; at last, quantitative assessment works cyclically to check the performance of proposed algorithm, which includes two parts: an automatic quality assessment based on point wise and a visual examination based on object wise. If the classified result is not satisfied enough, the optimization would start again from the beginning and continue to loop till getting the optimal result. A method to extract traffic signs/signals by using position of road boundary was proposed [7]. Road boundary was detected by identifying longest straight line from each profile scan and it was assumed that traffic signs/signals were lies in close proximity of the road boundary. Further, regular mesh grids with a unique hash value was designed using proximity points of the road boundary followed by clustering, object segmentation and feature extraction of traffic signs/signals from other objects. Generally there is tradeoff between the accuracy and the processing time of algorithms. Algorithms typically depends the on the application for which the pole like objects © 2018, IJCSE All Rights Reserved
Vol.6(3), Mar 2018, E-ISSN: 2347-2693 extraction has been performed. In the case of ADA the processing time of algorithm must be fast as well accurate, but in the case of reconstruction and modeling of road environment the accuracy of algorithm should be at acceptable level but the processing time of an algorithm (secondary concern) also be the satisfactory level because the data of MLS is in huge amount (bulky data size). In present study a novel method for the detection of PLOs using MLS data is proposed. Method based on simple geometric principles such as local window search and PCA. Proposed method has been tested on MLS data of a test site. Test site contains different common features in urban environments (i.e. large buildings, junctions, roundabouts, small parks, parked vehicles or bins). Section II of the manuscript describes the proposed method for PLOs detection. Result and corresponding discussion are shown in Section III and section IV respectively. Conclusions are deliberated in Section V. II.
METHODOLOGY
The proposed method for the detection of PLOs from MLS data consists four consecutive steps (Figure 1). Method uses raw unstructured mobile LiDAR data in XYZ format as input. Rough ground point elimination from raw input point cloud having X, Y, and Z coordinate values, using height variance. Local moving window search at non-ground point cloud space. This step allows to basically find the candidate PLOs using point density. Tri-dimensional analysis at candidate PLOs. Eigen value and Eigen vector (PCA) are used in order to identify the PLOs. Refinement of false positives from identified PLOs using knowledge base information.
Input Raw MTLS Data
Rough ground point elimination using height variance
Local moving window search
Filtering true positives using knowledge base information
Tri-dimensional analysis using PCA
PLOs
Figure 1. Process sequence of proposed method.
2
International Journal of Computer Sciences and Engineering A. Rough Ground Point Elimination Initially, each LiDAR points are selected as seed point sequentially and their neighboring points are identified based on two-dimensional (2D) K-d tree. Neighbors of seed points are identified within user defined circle, XY coordinate of seed point is used as center of the circle with a user defined radius OR1. Height variance z (i) is calculated using seed point and its earlier determined neighbor points (1). 2
Z k Z n (1) z (i) n k 1 Where i represents seed point at the center of user defined circle, Z is height value of LiDAR point, n is the total number
of points within circular neighborhood of seed point i, Z is mean of the height of all n points . if z i < z i Ci : else
th
Ground points (G) Non-ground points (NG)
Vol.6(3), Mar 2018, E-ISSN: 2347-2693 B. Local Moving Window Search After filtering the ground points all the non-ground points are projected at XY plane and local window search operation is performed. For doing so, a user defined window is defined (Ws) and top left corner of projected dataset (non-ground points) is selected as seed point (point p, Figure 3). All the points lying under the local window are extracted and their variation in X and Y direction is calculated (3, 4). If the calculated variance ( x i , y i ) is less than a predefined threshold ( x i , y i ) then tridimensional analysis th
using PCA is performed at these points (5) otherwise, window points are skipped. Further, window is moved in X direction and again similar procedure is applied. Process is stopped after window is reached at the bottom right corner of projected dataset (point r, Figure 3). X p X n x i n p 1
(2)
Y p Y y i n p 1
Input LiDAR data points are divided into ground points (G) and non-ground points (NG) using (2) (Figure 2), where
z i is height variance threshold value and Ci is selected th
ith circle.
th
2
(3)
2
n
if x i < x i th && y i < y i th Wi : else
(4) Processed in next step Skipped
(5)
Where, n is the total number of points are present in search window and Wi shows the selected ith window.
p
q
s
r Figure 3. Moving window search.
Figure 2. Eliminated ground points.
© 2018, IJCSE All Rights Reserved
C. Tri-dimensional Analysis using PCA The objective of this step is to identify the PLOs from the eligible window points. For doing so, tri-dimensional analysis is carried out using Principal Components Analysis (PCA). Initially all the points of each eligible window are 3
International Journal of Computer Sciences and Engineering taken sequentially and their variance co-variance matrix is calculated (6). Further, eigen values and corresponding eigen vector of variance co-variance matrix is calculated (7). The eigen values are normalized (9, 10) and the angle ( ) between the eigen vector ( E αmax ) corresponding the maximum normalized eigen value ( α max ) and Z axis is calculated (12). If the value of maximum normalized eigen value and the calculated angle is greater than a particular threshold ( αthmax , th ) then the window points are classified as a PLOs (13). 2x xy xz (6) C xy 2y yz xz yz 2z |C – λ*I| =0
Ni
(8)
i 1 2 3
(9)
Nλ1 + Nλ2 + Nλ3 = 1
III.
RESULT
A. Study Area and Dataset The proposed algorithm is tested on the mobile LiDAR data captured by Lynx Mobile Mapper, at Canada (Figure 4, Figure 5). Data is freely available for self-training at Terrsolid official website.
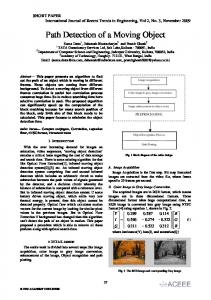
Figure 4. Perspective view of input point cloud dataset.
(10)
Eαmax =a X +b Y +c Z (a 2 b 2 c 2 )
cos1
points, n satisfy: H>Hth and n nth ; then only points belong to PLO.
(7)
1 2 3
Vol.6(3), Mar 2018, E-ISSN: 2347-2693
(11)
c
th th if α max > αmax && > Classified as PLOs Wei : Skipped else
(12)
Where, Wei is selected ith eligible window. D. Refinement In this step, on the basis of knowledge base information some false positives which are misclassified as PLOs in previous step (Tri-dimensional Analysis using PCA) are removed. In order to carry out this, information like average height of PLOs and average number of LiDAR points for each PLO is used. Difference ( H ) between average of few (n) LiDAR points close to maximum Z and minimum Z values are computed. By taking the average, effect of outlier or noise is avoided. Number of LiDAR points ( n ) for each PLO is also calculated. If difference, H and number of LiDAR
© 2018, IJCSE All Rights Reserved
Figure 5. Zoomed view of input point cloud dataset.
(13)
Point cloud of test site has low 2D point cloud density (Table 1) having mainly ground objects including road section, trees with short trunk, street lights, low vegetation and buildings both sides of the road. Boundary of the road is not clearly defined but marked based on the location of different street furniture. Data characteristics for test site are shown in Table 1. Name
Test site
Table 1. Test site data characteristics Number of File Average point Maximum height points Size density* difference** (m) (points/m2) 2,830,444 2.59 114 3.8 GB
*
2D point density is calculated by projecting the 3D point cloud on XY plane. 4
International Journal of Computer Sciences and Engineering **
The biggest height difference on the ground surface.
B. Output Dataset Detected PLOs of test site are shown in Figure 6. These query poles are important feature of road environment and have large impact on road safety problems. Therefore, their locations from road boundary, separation between them are important information, which could be easily measured through modest geo statistical calculation applied on detected geo referenced point cloud (Figure 6).
Vol.6(3), Mar 2018, E-ISSN: 2347-2693 Parameters
Threshold Values
WS
0.2 meter * 0.2 meter
OR1
0.3 meter
αthmax
0.8
th
150
H th
6 meter
nth
70 th
0.3 meter
x i
th
0.1 meter
y i
th
0.1 meter
z i
n
10
H th
6 meter
nth
70
Figure 6. Detected PLOs of Test Site.
IV.
DISCUSSION
Only the XYZ coordinates of input point cloud are only used Table 3. Statistics of detected PLOs by the proposed method, it does not required on the scanning Test PLOs False Completeness Correctness geometry and neighborhood structure data. Therefore, site detected/PLOs Positives dependency of algorithm on the scanning geometry [7-9] is reference removed. There is no training data is required in the proposed method, several existing algorithms [10, 11] need training 1 43/47 7 91.48 (%) 86.00 (%) data for the detection of pole structures. No initial assumption on the poles location is used. Non-ground points including all the PLOs are extracted in first step. Existing methods typically fails to detect many pole-like objects due to rough Number of PLOs detected Completeness(%) 100 classification approach used to separate out ground, onTotal number of PLOs ground and off-ground points [12]. Due to incorrect initial Number of PLOs detected point cloud segmentation several methods [4] are unable toCorrecteness(%) Number of PLOs detected Number of False Postives 100 detect many pole-like objects. Proposed method is not sensitive at point cloud density. Performance of proposed method for PLOs detection is V. CONCLUSIONS shown in Table 3. The completeness of 91.48% and A new method is proposed in this research for detecting the correctness of 86.00% (Table 3) are achieved at parameter pole-like objects from mobile LiDAR data. Knowledge values given in Table 2. All the PLOs including partially based approach is adapted for designing this four steps occluded poles (only middle segment), tilted poles, poles method. Point cloud data from one test site is used for testing situated very close to other objects and vertical pole attached the proposed method. Initial step is used for removing the with tilted pole are easily extracted. Completely occluded unnecessary ground points from input dataset and all the poles, top or bottom or both segment occluded pole, poles non-ground points, which have all the PLOs are retained. located far away from road boundary having quite less Second and third steps are used for PLOs detection from LiDAR points are few exceptions and they are not detected. non-ground data points. At last refinement is applied using Building columns having similar geometrical features as knowledge base information to filter out the false positives pole-like structures are also classified as pole. from the detected PLOs. The completeness of 91.48% and correctness of 86.00% are achieved after applying proposed Table 2. Number and type of poles detected test site © 2018, IJCSE All Rights Reserved
5
International Journal of Computer Sciences and Engineering method at the point cloud data of test site. PLOs completely occluded by the tree are not detected. Building columns geometrically similar to the query pole are classified as polelike structure. Proposed method uses only XYZ coordinates of point cloud and does not depend on the additional information such as scanning geometry, neighborhood structure, intensity, etc. and it also does not uses any initial assumption on poles location and training data. Proposed method is not sensitive to the point density. Poles situated very close to non-pole object and tilted poles are also easily detected. Vertical pole connected with tilted pole is also detected. Therefore, proposed method removes the limitations of existing methods. From the results obtained in the test site and the thorough analysis of the methods, it can be concluded that proposed method is more general and improves the performance of the existing methods by: (i) detecting PLOs joined to other features or connected to other poles, (ii) it is fully automatic and does not require the use of training data, (iii) no initial assumptions about the relative location of the poles are needed, and (iv) it is independent of the scanning geometry and it only needs the XYZ coordinates of the original points. ACKNOWLEDGMENT Authors would like to acknowledge Terrasolid Ltd. and Optech, Canada for allowing us to use mobile LiDAR training dataset for this study which is freely available at official website of Terrasolid Ltd. REFERENCES [1] K.S. Yen, B. Ravani, T.A. Lasky, “LiDAR for Data Efficiency”, WSDOT Research Report, WA-RD 778.1, 2011. [2] S.I. El-Halawany, D.D. Lichti, “Detection of road poles from mobile terrestrial laser scanner point cloud”, International Workshop on Multi-Platform/Multi-Sensor Remote Sensing and Mapping (M2RSM), pp.1–6, 2011. [3] C. Brenner, “Extraction of features from mobile laser scanning data for future driver assistance systems”, Advances in GIScience, Lecture Notes in Geoinformation and Cartography, Springer, pp.25-42, 2009. [4] H. Yokoyama, H. Date, S. Kanai, H. Takeda, “Detection and Classification of Pole-like Objects from Mobile Laser Scanning Data of Urban Environments”, International Journal of CAD/CAM, Vol. 13, No. 2, pp.31-40, 2013. [5] S. Pu, M. Rutzinger, G. Vosselman, S.O. Elberink, “Recognizing basic structures from mobile laser scanning data for road inventory studies”, ISPRS Journal of Photogrammetry and Remote Sensing 6(66), S28–S39, 2011. [6] D. Li, S.O. Elberink, “Optimizing Detection of Road Furniture (Pole-Like Objects) in Mobile Laser Scanner Data”, ISPRS Annals of the Photogrammetry, Remote Sensing and Spatial Information Sciences II-5/W2: pp. 163–168, 2013. [7] Y.Z. Chen, H.J. Zhao, R. Shibasaki, “A mobile system combining laser scanners and cameras for urban spatial objects extraction”, Proceedings of the Sixth International Conference on Machine Learning and Cybernetics 2, pp.1729-1733, 2007.
© 2018, IJCSE All Rights Reserved
Vol.6(3), Mar 2018, E-ISSN: 2347-2693 [8] A. Kukko, A. Jaakkola, M. Lehtomki, H. Kaartinen, Y. Chen, “Mobile mapping system and computing methods for modeling of road environment” Proceeding of the Urban Remote Sensing Joint Event , pp.331–338, 2009. [9] M. Lehtomäki, A. Jaakkola, J. Hyyppa, A. Kukko, H. Kaartinen, “Detection of vertical pole-like objects in a road environment using vehicle-based laser scanning data”, Remote Sensing 2 (3), pp.641–664, 2010. [10] K. Ishikawa, F. Tonomura, Y. Amano, T. Hashizume, “Recognition of Road Objects from 3D Mobile Mapping Data”, Proc. International Journal of CAD/CAM, vol. 13, No.2, pp.41-48, 2013. [11] A. Golovinskiy, V. Kim, A. Funkhouser, “Shape-based recognition of 3D point clouds in urban environments”, Proceedings of the international conference on computer vision (ICCV), pp.2154–2161, 2009. [12] S. Pu, M. Rutzinger, G. Vosselman, S.O. Elberink, “Recognizing basic structures from mobile laser scanning data for road inventory studies”, ISPRS Journal of Photogrammetry and Remote Sensing 6(66), S28–S39, 2011.
Authors Profile Mr. Arshad Husian received his B.Tech. degree in Information Technology from Kamla Nehru Institute of Technology (KNIT), Sultanpur, India in 2013. He obtained his M.Tech. degree in GIS and Remote Sensing from Motilal Nehru National Institute of Technology (MNNIT), Allahabad, India in 2015. He is pursuing Ph.D from MNNIT, Allahabad. His current research interests are geospatial feature extraction using terrestrial and mobile lidar data and satellite image processing. Dr. R. C. Vaishya received his Ph.D degree from Indian Institute of Technology (IIT), Bombey, Maharastra, India in Environmental Science and Engineering in the year 2002. He joined Motilal Nehru National Institute of Technology (MNNIT), Allahabad, Uttar Pradesh, India as Lecturer in year 1993. Presently he is working as professor in the Department of Civil Engineering, MNNIT, Allahabad. His current research interest includes water treatment and solid waste management, water and waste water treatment, solid waste management, geographical information system and remote sensing. Dr. Vaishya has published several technical papers in peer reviewed National and International journals/seminars/conferences in the area of environment engineering, ground water management, climate change, geographical information system and remote sensing. Dr. Vaishya also involved as an expert/PI in many esteemed research and consultancy projects of Govt. of India. Mr. Md. Omar Sarif has been completed graduation (B.A. (Hons.) in Geography from Aligarh Muslim University, India and obtained his master degree (M.A.) in Geography from Jamia Millia Islamia. He obtained his M.Tech. degree in Remote Sensing from Birla Institute of TechnologyMesra, India. He is pursuing Ph.D from MNNIT, Allahabad. His current research interests are LU/LC Dynamics, Urban Dynamics.
6