in a fashion similar to the Domain Name Service (DNS) by resolving agent ..... mental data, corroborating the suggestion [20] that the. MAP kinase cascade ...
A Multi-Agent System for the Quantitative Simulation of Biological Networks ∗†
∗†
∗
Salim Khan , Ravi Makkena , ∗ Foster McGeary and Keith Decker
William Gillis and Carl Schmidt Animal and Food Sciences Dept. University of Delaware Newark, DE 19716, USA.
Computer and Information Sciences Dept. University of Delaware Newark, DE 19716, USA.
{kerouac,schmidtc}@udel.edu
{skhan,makkena,mcgeary,decker}@cis.udel.edu
ABSTRACT
Categories and Subject Descriptors
We apply the multi-agent system (MAS) platform to the task of biological network simulation. In this paper, we describe the simulation of signal transduction (ST) networks using the DECAF [9] MAS architecture. Unlike previous approaches that relied on systems of differential equations (DE), the distributed framework of MAS scales well and allows us to model large, highly interconnected ST pathways. This scalability is achieved by adopting a hybrid strategy that factors macro-level measures, such as reaction rate constants, to calculate the stochastic kinetics at the level of individual molecules. Thus, by capturing the ST domain at an intermediate level of abstraction, we are able to retain much of the granularity afforded by a purely individual-based approach. The task distribution within a MAS enables us to model certain physical properies, such as diffusion and subcellular compartmentalization, which have proven to be difficult for DE systems. We demonstrate that large-grained agents are well suited to maintaining interal state representations and efficient in computing reactant concentration, both of which are vital considerations in modeling the ST domain. In our system, a molecular species is modeled as an individual agent with hierarchical task network structures to represent self- and externally-initiated reactions. An agent’s identity is determined by a rule file (one for every participating molecular species) that specifies the reactions it may participate in, as well as its initial concentration. Reactions within the system are actuated by inter-agent communication. We present results from modeling the well-studied epidermal growth factor (EGF) pathway, demonstrating the viability of MAS technologies as a simulation platform for biological networks.
I.2.11 [Distributed Artificial Intelligence]: Multiagent Systems
General Terms Multi-Agent Systems, Simulation, Biological Networks
1. INTRODUCTION Living systems exhibit great robustness and versatility in adjusting their intracellular molecular machinery to changes in the external environment. The cellular processes by which cells detect, convert and internally transmit information regarding the external environment are collectively referred to as signal transduction (ST) networks. In this paper, we demonstrate the application of multi-agent technologies to biological network simulation by focusing our attention on the simulation of ST networks. However, the discussion is just as relevant to the simulation of other biological networks such as those of metabolism and gene regulation. Numerical simulation of ST networks have become viable only recently, thanks mainly to the advent of high throughput methods such as mass spectrometers, gene chips and two-hybrid systems. These automated/semi-automated methods have generated voluminous data, and though many details are yet to be uncovered, a clearer picture of intracellular networks is beginning to emerge. As individual network components are identified, and their in vitro behavior characterized, we can turn our attention to understanding how these individual components organize and co-ordinate in vivo to create the systemic properties that we associate with more abstracted levels of organization, i.e., cells, organs, organisms, etc. The inherent complexity of ST and other biological networks makes it imperative that we seek computational solutions. Much like the complex systems studied in the mathematical and physical sciences [22], the complexity of biological networks arises not only in the number and connectedness of the network components, but also from the diversity of the message forms and the translating interfaces required. Additionally, the complexity is exacerbated by the degree of conditional branching, nesting and looping present within these networks. Biological pathway components also exhibit physical properties of dynamic assembly, translocation between intracellular compartments, and eventually, degrada-
∗Student author. †Equal principal authors.
Permission to make digital or hard copies of all or part of this work for personal or classroom use is granted without fee provided that copies are not made or distributed for profit or commercial advantage and that copies bear this notice and the full citation on the first page. To copy otherwise, to republish, to post on servers or to redistribute to lists, requires prior specific permission and/or a fee. AAMAS’03, July 14–18, 2003, Melbourne, Australia. Copyright 2003 ACM 1-58113-683-8/03/0007 ...$5.00.
385
tion. ST networks inherit the complexities outlined above, besides exhibiting a higher level of cross talk between subnetworks or pathways, than other biological networks. A pathway can be thought of as a series of connected components that result in the accomplishment of a specific biological goal.
2.
the activation or inhibition of events further downstream, or feeds back on upstream events. To summarize, there is a finite set of mechanisms by which a signal is transferred within a cell, all of which can be described using basic chemical reaction schemas [21]. In this paper, we consider reactions of the following three types: 1. Protein complex formation. Two proteins with sufficient kinetic energy, coalesce to from a complex.
SIGNAL TRANSDUCTION PATHWAYS
A signal transduction pathway can be decomposed into the following steps [14]:
A + B → AB
1. A signaling molecule arrives from outside the cell.
2. Protein complex decomposition. An unstable complex may decompose into its constituent proteins.
2. A receptor on the surface of the cell interacts with the signaling molecule.
AB → A + B
3. The receptor interacts with intracellular pathway components, setting off a cascade of protein interactions within the cell.
3. New product formation. If an unstable complex can overcome the activation barrier of the reaction, then a new product results, perhaps accompanied with the creation of some byproducts.
4. The signal arrives at destination and elicits a functional response, e.g., gene transcription.
AB → P
A signaling molecule may take many forms — proteins, steroids, peptides, etc. The signal can originate from different sources —- nearby cells (paracrine signaling), hormones released into the bloodstream (endocrine signaling) and from the receiving cell itself (autocrine signaling) [14]. Regardless of the signal origin, we limit ourselves to only the intracellular portion of the ST pathway. We further simplify our domain by sub-dividing the environment (i.e., the cell in the ST domain) into four distinct compartments extracellular, membrane, cytoplasmic solution (cytosol) and nucleus. For the purposes of this paper, we trace the signal propagation through these compartments only. A fundamental tenet of biology is that the shape of a biomolecule imputes its function. The primary mode of signal transduction is through structural changes of the participating pathway components, which are mostly proteins. Proteins can be regarded as long chains of amino acids, coiled into a distinct conformation, i.e., 3-dimensional shape. A given protein can affect the conformation of one or several other proteins, thereby activating or inhibiting the activities of those proteins, and thus propagating the signal down the pathway. The conformation change is effected by the binding of that protein with other proteins to form a protein complex or by post-translational modifications. Post-translational modifications refer to the addition of chemical groups to the amino acid sidechains and/or the terminal amino and carboxyl groups of a protein. Common post-translational modifications include phosphorylation, ubiquitination, acetylation and hydroxylation. Posttranslational phosphorylation, a key modification involved in signal transduction within mammalian cells, is the addition of one or more phosphate groups at specific locations (i.e., amino acids) on a protein. A kinase protein catalyzes the phosphorylation reaction by which adenosine tri-phospate (ATP) transfers a phosphate group to a protein and is converted to adenosine di-phosphate (ADP) in the process. A phosphatase protein catalyzes the inverse reaction of dephosphorylation, i.e., the removal of a phosphate group. Signal transduction is heavily dependent on the action of kinases and phosphatases, as most of the intracellular portion of signaling pathways are cascades of protein phosphorylations and dephosphorylations. Each step leads to
Two properties characterize the interaction between two proteins to from a product: affinity, which refers to the strength of the binding between the proteins; and specificity, or preference, of the proteins for each other over other proteins. While a reaction may be described overall as A→P it actually proceeds through intermediate steps A → I1 → I2 → P that can be mapped to one of the three reaction types described above. The rate at which these chemical reactions proceed is essential to determining the overall dynamics of the ST domain, or any other biochemical domain. Kinetics is the study of these rates and provides a mathematical basis for understanding the dynamic properties of the ST domain. We now introduce the basic kinetics concepts applied within our simulation. In a first-order reaction of the type A → P , the instantaneous rate or velocity of the reaction is given by d[A] d[P ] = dt dt as the stoichiometry of the reaction is such that from every 1 mole of P formed, 1 mole of A is consumed. As the process continues, the concentration of A decreases and so does the overall velocity. So, the rate of product formation is proportional to the concentration of A, v=−
d[A] = k[A] dt where k is the rate constant. For a second order reaction, such as A + B → P , the velocity is measured as v=−
d[A] d[B] =− = k[A][B] dt dt The first-order and second-order rate constants are central to our model of the ST domain. All other factors held equal, the rate constant provides us with a notion of the relative v=−
386
4. MULTI-AGENT SYSTEM APPROACH
velocities of two reactions, assuming equal reactant concentrations. As we describe later, from these relative velocities, we obtain the relative reaction times for the two reactions at the molecular level.
3.
Due to the inherent complexity and concurrency within biological networks, distributed systems have increasingly come to be viewed as a suitable platform for the task of simulating these networks. The MAS solutions proposed thus far have ranged the spectrum - some [11] have used agent theories such as the BDI model to capture high-level abstractions while others [18, 12] have proposed to simulate molecular-level reactions with individual agents. High-level and low-level abstractions differ in the manner in which they describe the reaction kinetics. At the system level, or the reaction level, the kinetics of a reaction is determined by the reaction rate constant and the relative concentrations of the reactants. Thus, the reaction rate constant comes to signify a system-level approximation of the physical properties of the reactants. In contrast, the kinetics at the individual-level, or the molecular level, is a function of the probability of collisions between individual molecules of the participating reactants, per unit time. The reaction kinetics are also influenced by the reactants’ initial concentrations as well as their affinity. When more than two reactants are present, the reactants’ specificity also determines the system kinetics. Despite their intuitive appeal, neither of these two resolutions is desirable for the modeling of ST networks. As previously discussed, reaction-level abstractions, such as DE systems, are not suitable because of the simplifying assumptions they make with respect to the ST domain. On the other hand, molecular-level modeling of the ST domain is impractical due to the sheer volume of subcellular components that can potentially participate in the simulation. What is required, therefore, is an intermediate level of abstraction that can represent macro- and micro-level phenomena, while remaining computationally feasible. We believe that a MAS of large-grained agents provides just such a computational solution. The distributed framework of a MAS provides a scaleable solution that can grow to accommodate the addition of new pathways and components. Furthermore, the autonomous decision-making capability of individual agents closely approximates the concurrency and independence of individual molecular behavior within a larger system.
OTHER MODELING APPROACHES
Several qualitative approaches to the task of modeling biological networks have also been undertaken, but we limit ourselves to other quantitative modeling methods. Modeling metabolic pathways as a system of differential equations (DE) has proven fairly successful [15, 4]. Extending this methodology to ST pathways, however, has not been as successful due to some of the simplfying assumptions made when applying the differential equation model. For example, DE systems model concentration of intracellular molecular species as a continuous, differentiable function. However, to convert a spatial distribution of a molecular species into such a continuous concentration requires that we assume the system to be of infinite volume. In contrast, cell volumes are minute, and it has been shown that intracellular signaling can occur in microscopic quantities [10]: hydrogen ions, which affect many ST pathways, number only around 6,000 per cell; a signaling event usually results in the transcription of a single gene copy. In both these cases, representing concentration as a continuous variable has little meaning. The division of a cell into multiple compartments further weakens the assumption of continuously variable concentration. Fluctuations which can arise from the inherent stochastic nature of physical systems, can be amplified and cause observable, macroscopic effects [7] when a system performs close to unstable inequilibria. ST pathways, and indeed, all biological pathways, frequently employ positive feedback, and other, more complex nonlinear machinery that leads to instability of the state space. DE systems are unable to capture either the stochasticity or the granularity required to model such small-scale interactions. Finally, many DE parameters, such as rate constants are derived in vitro, casting doubt on their direct application to in vivo processes. DE systems can model continuous phenomena, but many components within the ST domain act as switches, producing discontinuous behavior on either side of a threshold. Hybrid systems are well suited to handle these phenomena, and have been successful in some transition behavior in the larger biological domain [1]. A hybrid system can be thought of as a finite state automaton which describes discrete allowable states, each of which can be modeled using a DE system. Unfortunately, this dependency on DE systems makes it prone to some of the same drawbacks. Stochastic models are less prone to some of these problems. For example, by treating concentration as a discrete variable, volume need not be assumed to infinite. Physically, a chemical reaction is a stochastic event involve discrete reactions between participants. Thus, stochastic simulators such as StochSim [8] and others [2] provide more realistic models of the underlying phenomena. However, the price for this additional level of detail is paid in terms of greater computational complexity. Other quantitative approaches include π-calculus [19] (a process algebra previously utilized to specify mobile communication systems), rewriting logic [5] and a hybrid workflow/Petri nets approach [17].
4.1 DECAF Our MAS for biological network simulation was built using DECAF (Distributed, Environment Centered Agent Framework) [9] 1 which is Java-based toolkit for creating multiagent systems. We chose DECAF because it offers several advantages. Firstly, several agent-building tools are available within DECAF, allowing for the rapid prototyping of the agent system. Secondly, the internal architecture of a DECAF agent is built much like an operating system. The modular design and robustness of each service allows us to track the control flow within the agent, thereby reducing the time taken for testing and debugging. DECAF is multithreaded and each of its control modules — initialization, dispatch, planning, scheduling, execution and coordination — run in separate, concurrent threads. The core representation of information flow within a DECAF agent hierarchi1 This work was supported by the National Science Foundation under Grant No. DBI-0092336. NSF Grant No. IIS-9812764 supported development of DECAF. Simulations used computers provided under NSF grant CDA-9703088.
387
5.2 Molecular Groups
cal task network (HTN) structure. Every task structure is run within a separate thread. As we shall see, this multithreaded implementation is key to achieving large efficiencies within the ST domain simulation when applying largegrained agents.
The molecules represented by a single thread constitute a molecular group. The size of a molecular group is equivalent to the scale factor. Currently we use the same scale factor across all the participating species. By representing a group of molecules as a single decisionmaking entity, we ”average” their individual behaviors, i.e., they share the same internal state representation and participate in the same reactions. The group, therefore, is the smallest unit of molecular representation within our system. For the purposes of the simulation, the functional characteristics of a group are equivalent to that of the molecule. For the rest of the paper, all functionality ascribed to a molecule is extended to the molecular group that the molecule is assigned to. The larger the scale factor, the more closely our model approximates a system-level representation. However, increasing the scale factor reduces the granularity that is gained by a pure individual-level approach. As we shall see later, accumulating individual molecules into groups and averaging their behavior requires that we re-introduce system-level modeling constructs, such as reaction rate constants, to approximate the kinetics resulting from their coupled behavior.
4.2 DECAF Support for Simulation DECAF supports the building of simulation tools by providing useful middle agents and an interactive shell to monitor the current state of the agent system. Middle agents are built to support common multi-agent activities, and while there are a few well known middle agents, DECAF supports the creation of domain-specific agents as well. The standard DECAF middle agents we use are: • Agent Name Server (ANS) or “white pages”, is an essential component for agent communication. It works in a fashion similar to the Domain Name Service (DNS) by resolving agent names to hosts and port addresses. • Matchmaker is a “yellow pages” to assist agents in finding services needed for task completion. • Agent Management Agent allows MAS designers to look at the entire set of agents that share a single ANS. This allows designers to query the status of individual agents and monitor inter-agent message traffic.
5.3 Group and Reaction Lists Every molecular group is assigned an element in an array, called the group list, that is present in every agent. The group list is accessible by all of the agent’s task structures. An element in that group list holds its molecular group’s state description, i.e., compartment currently localized in, whether phosphorylated, etc. A molecular species may only participate in a subset of the reactions that occurs within a pathway. This unique set of reactions is stored within an agent in the form of a reaction list. Like the group list, the reaction list is accessible by all the task structures within an agent.
We now describe how these and the domain-specific DECAF agents are applied to the task of ST simulation, and examine in more detail the support provided by DECAF’s internal archtitecture design.
5.
IMPLEMENTATION
5.1 Molecular Representation
5.4 Reaction Representation
As discussed previously, a one-to-one assignment of agents to molecules is impractical due to the immensity of resources required for such as exercise. Besides, it may be unnecessary to capture the ST domain at such a fine degree of biochemical detail, as many of the phenomena we are interested in also emerge at a mesoscopic level of detail. Therefore, our solution is to represent every molecular species with an agent, and scale the number of same-species molecules to the number of available threads within an agent. Another way of representing interactions at the molecular level is to assign an agent for every reaction. While the reaction-as-agent and molecular-species-as-agent paradigms are roughly equivalent, we chose to design our system on the latter model on the consideration that, within the ST domain, the number of molecular species is relatively small compared to the number of reactions. This ST domain attribute results from the high degree of component re-use within different pathways. Also, the agent-as-reaction model requires that molecules be represented as messages passed during inter-agent communication. Given the number of components within the domain, such a setup could test the message-handling capabilities of the agents, thereby limiting the solution to small problem sizes. In the molecularspecies-as-agent approach, the internal state representation of every molecule is stored in memory, from where it can be retrieved quickly and efficiently.
At the molecular level, all molecules exhibit Brownian motion. A molecular level reaction is initiated when two reactant molecules collide. In this setting, we cannot ascribe the notion of an initiating molecule and a responding molecule to a random collision. However, when we computationally model the reactions that result in the formation of protein complex, the order of initiation becomes important. A molecule may initiate a reaction by requesting a reaction to the agent representing a potential reactant. Conversely, a molecule can participate in a reaction by responding to a reaction request message received from a initiating molecule. This directionality in reaction initiation is handled by separate task structures, LocalInit and ExternalInit, to handle self- and externally-initiated reactions respectively. Every task structure is executed by a separate thread within the DECAF agent. A LocalInit task structure is assigned to every molecular group, and it persists through the lifetime of that group. An ExternalInit structure is created every time a request is received. Because a group entry in the group list can be accessed by either task, these threads are synchronized. This guarantees that a group participates in only one reaction at any given moment.
388
5.4.1 Reaction Procedure
P
A reaction that results in complex formation, A + B → AB, is simulated within our system as:
P (X does not react) = P ∀j∈Y
1. Either A or B can initiate the reaction. Let’s assume A initiates the reaction. A selects B from its reaction list based on a stochastic (to be discussed later) measure of colliding with B.
5.4.3 Estimation of Reaction Time
3. B’s agent receives the message. If a molecule that matches A’s specifications is present within its group list, it sends back a “success” message, upon receipt of which, the A molecule is terminated, i.e., its group list entry is deleted.
As a result of interaction properties such as affinity and specificity, which are unique to every reactant pair, reactions within a pathway may proceed at different velocities, even in the presence of equivalent initial concentrations. At the molecular level, we simulate this by assigning different reaction times to every reaction. Since a higher rate constant, generally indicates a faster reaction, we take the inverse of the rate constant to provide us with a sense of the time required for a reaction to occur. For example, say two reactions, A + B → P and C + D → Q proceed with velocities v1 and v2 respectively. Then,
4. B simultaneously sends a message to the AB agent to create a new molecule group to represent the new complex formed. If the AB agent is able to add a new group list entry, it then sends a “success” message back to B, and the B molecular group, also terminates itself. 5. At this point, a new molecular group within the AB agent represents the formation of the protein complex. Before this new group can begin operating independently, the thread responsible for it sleeps a designated amount of time to indicate the time taken for the reaction to form the complex. Similarly, the decomposition of a complex molecule into its constituents is modeled by communicating with the constituent agents followed by the termination of the complex agent thread.
v1 = k1 [A][B], v2 = k2 [C][D] If the reactant concentrations are equal, then v1 k1 = v2 k2 which can be re-written as 1/v2 1/k2 = 1/v1 1/k1 where 1/v1 and 1/v2 are the reaction times per molecular reaction. The reaction times thus obtained are scaled against the slowest reaction, and subsequently used to temporarily stall a new product from becoming functional immediately. This “sleep” introduced is used to mimic the relative time it would take for that product’s reaction to have occurred. The reaction time and reaction stochasticity, together, provide us with a measure of a reaction’s velocity. The reaction stochasticity is measured from the relative concentrations of molecules within a compartment, while the reaction time is derived from the rate constant.
5.4.2 Calculation of Reaction Stochasticity For an interaction to occur between two molecules, they must first collide. The probability that a molecule collides with a particular reactant molecule is gotten from measuring the relative reactant concentrations within the same compartment. For example, let us consider two reactants, A and B, within a one compartment system. If the concentration of A is 100 molecules per unit volume, and the concentration of B is 10 molecules per unit volume, and both A and B are uniformly distributed, then the probability that the next molecule that an A molecule (the initiator) collides with, is a B molecule is approximately (on account of counting collision with self) 10/110 or about 0.09. Conversely, the probability that a B molecule will collide with an A molecule next, is 100/110 or about 0.91. To generalize, for some initiating molecule X whose set of potential reactants is Y = {Y1 , ..., Ym } and set of non-reactants is Z = {Z1 , ..., Zn }, the probability that X reacts with a reactant Yi is given by
∀j∈Y
∀k∈Z
If a X collides with a non-reactant, it stochastically select a new reactant from the reaction list again. This process repeats until a reactant is chosen. By definition, the probability of finding a reactant by this process is given by a geometric distribution. In the case of an unstable complex, the probability that it will revert to its original constituents or form a new product, is said to equally likely [21]. We assign a probability of 0.5 to the occurence of either event.
2. A, or to be more precise, a molecule group within A, sends a message requesting a reaction to the B agent. The message includes the molecule specifications (e.g., compartment localization) that must be met for the reaction to proceed.
P (X reacts with Yi ) = P
[Zk ] P [Yj ] + [Zk ] ∀k∈Z
5.4.4 Correcting the Concentration Skew When the SelfInit task is executing for a molecular group, it selects from its list of reactions based on the stochastic measure described previously. But as the concentration of different species varies over time, the internal estimates of these concentrations need to be updated. The agents obtain this information by regularly polling one or more domainspecific middle agents called Compartment agents, which keep track of the concentrations of all the species within that compartment.
[Yi ] P [Yj ] + [Zk ] ∀k∈Z
X can itself belong to either set Y or Z based on whether it can dimerize or not. Also, the probability that X does not react is given by
389
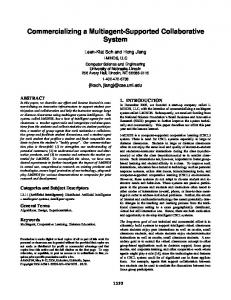
Figure 1: EGF-Induced MAP kinase cascade
6.
RESULTS
6.2 Criteria for Successful Modeling The validity of the model was verified in three ways, as per the guidelines followed by other simulations [3].
6.1 EGF signaled MAP kinase pathway We ran our MAS simulation on the well-studied EGF signaling pathway. The portion from the EGF pathway that we simulated is commonly referred to as the MAP kinase cascade (see fig. 1). The MAP kinase cascade proceeds downstream as follows:
1. The simulation results obtained were compared against other analytical results. The EGF signal-induced pathway has been previously modeled [20] by Schoeberl et al using an extensive DE system. We used their simulation results as a basis for evaluating the results from our simulation. Their results were made to fit experimental data that was previously reported [13] and their own investigations. We chose to compare our simulation results with Schoeberl et al due to their detailed modeling of the EGF pathway and their exhaustive inclusion of preiviously reported experimental data.
1. Activated Ras molecule (i.e., bound to GTP molecule) binds to the Raf molecule. [Raf ] + [Ras−GT P ] ↔ [Raf ∗ ] + [Ras−GT P ∗ ]
2. The Raf, now activated (Raf*), binds to and phosphorylates the MEK protein, phosphorylating it at two locations, giving rise to single and double phosphorylated MEK species.
2. Applied the law of mass conservation to test accuracy of complex formation reactions. We are guaranteed mass conservation within our system due to the manner in which reactions are represented. Additionally, we maintained a count of all the molecules (i.e., molecular groups) within the system, via the compartment agents, to check for inconsistent fluctuations in the molecule count. This was especially useful during debugging when reactions were stalled due to the queueing of outgoing messages, resulting in non-functional or “zombie” molecules. The current system is free of this anomaly.
[M EK] + [Raf ∗ ] ↔ [M EK−P ] + [Raf ∗ ] [M EK−P ] + [Raf ∗ ] ↔ [M EK−P P ] + [Raf ∗ ]
3. MEK phosphorylates MAP kinase, which is the ERK molecule in the EGF pathway. ERK can be single and double phosphorylated as well. [ERK] + [M EK−P P ] ↔ [ERK−P ] + [M EK−P P ] [ERK−P ] + [M EK−P P ] ↔ [ERK−P P ] + [M EK−P P ]
3. Run the same model at different time steps to compare simulation results. Since the nature of our simulation system is essentially stochastic, we ran the simulations from three different stages within the cascade, and averaged the behavior of the system over multiple simulation runs.
4. ERK further phosphorylates many proteins, that in turn, induce cellular responses. The reactions outlined above, are accumulated from multiple intermediate steps. The MAP kinase cascade occurs through the sequential phosphorylation of Raf, MEK and ERK, in that order. However, the strength of the signal can be inhibited by the phosphatases P1, P2 and P3 which act on Raf, MEK and ERK respectively.
6.3 Evaluation and Perturbation Analysis Two scenarios were simulated with the MAS. Both the scenarios were started from conditions where all the MEK
390
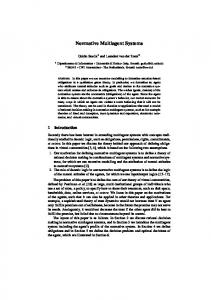
Figure 2: ERK phosphorylation: Models compared
Figure 3: Elevated MEK, ERK levels (mutated Ras)
within the cell (aprox. 2.2 x 10⁴ molecules) were unphosphorylated.
in this scenario, leading to the amplification of ERK (see fig. 3). The results obtained seem to fit experimental data, corroborating the suggestion [20] that the MAP kinase cascade components are very senstiive to changes in their reaction parameters.
• Regular MAP kinase cascade. The Schoeberl model simulates the entire EGF pathway, but we focus only on the MAP kinase cascade. In all, our shortened pathway consists of fourteen moleuclar species. We start our simulation at the Ras molecule, and precalculate the relative activation of the Ras-GTP complex from events upstream. Our goal was to reproduce the co-ordinated phosphorylation cascade from the Raf to the MEK and ERK molecules. Figure 2 shows the activation levels of ERK-PP as obtained by Schoeberl and us. To set the relative time scale, we lined the graphs at their maximal amplitude. From the figure, we see that the points of departure (i.e., high velocity
6.4 Hardware Support All the simulations were run on four Sun Ultra Enterprise 450s with four 250 MHz Sun Ultra-II processors each. Each machine has 512 MB of four-way interleaved memory and connected via a fast-ethernet network interface.
7. DISCUSSION 7.1 Relative Time Scale The reaction times that we obtained for molecular-level reactions is only an approximation, and the difference between the slow and fast reactions can range in several order of magnitude. In addition, every reaction and/or product formation takes some time for computation and communication, and in some instances. can be relatively large compared to the scaled reaction time. For these reasons, the true scale factor between wall-clock time and the relative time cannot be determined from the system itself. By comparing the simulation results to experimental data, however, this ratio may be divined, e.g., our time scales when compared to the wall-clock times of the Schoeberl model. Neverthless, within the ST domain, we are interested in the co-ordination of signal transmission between adjacent components in a pathway. Relative time scale is still applicable for this type of analysis. For example, in the MAP kinase cascade, it can be hypothesized [20] from fig.4 that attaining the maximum activation is of secondary concern for the signal transfer. The peak in signal transferred to ERK by MEK occurs before maximum MEK activation (see fig. 4).
of ERK phosphorylation at around 6 minutes) are almost identical. The spikes, as a result, are comparably steep. This is important because the reaction velocity, and not amplitude, is the major determinant of signal transfer (see 7.1) . The simulations were run from three stages within the cascade: 1. at initial conditions, i.e., start of simulation 2. at point of departure from near zero levels of phosphorylated ERK, approx. 6 minutes into the simulation 3. at point of maximal amplitude, approx. 12 minutes into the simulation The correspondence between our model and the Schoeberl model gives us reason to believe that our representation/model is a good approximation of the underlying phenomena.
7.2 Compartmentalization and Diffusion
• MAP kinase cascade in the presence of mutated Ras. The MAP kinase cascade components are untouched from the previous scenario. However, the Ras molecule upstream is mutated such that its hydrolase activity is inhibited resulting in a constitutively active Ras, which in turn perpetually activates the Raf molecule. The Raf molecule and P2 phosphatase are now in competition for MEK phosphorylation and dephosphorylation, respectively. As a result, the sharp drop in the number of MEK-PP molecules seen normally, is absent
DE systems usually consider single compartment systems where the contents are “well-stirred”, i.e., a molecule is just as likely to collide with all other molecules. We have discussed the problems with this assumption previously. The irrregular distribution of molecules within a cell is simulated within our system with the aid of compartment agents. The cell can be decomposed into voxels (volume elements) as some have suggested [6], such that only adjacent voxels need to be able to communicate. This type of decomposition
391
bacterial chemotaxis. Mol. Biol. Cell, 4:469–482, 1993. [5] S. Eker, M. Knapp, K. Laderoute, and P. Lincoln. Pathway logic: Symbolic analysis of biological computing. In Pacific Symposium on Biocomputing, pages 400–412, January 2002. [6] D. Endy and R. Brent. Modelling cellular behaviour. Nature, 409:391–395, January 2001. [7] P. Erdi and J. Toth. Mathematical Models of Chemical Reactions. Manchester University Press, Manchester, 1989. [8] C. Firth and D. Bray. Stochastic simulation of cell signaling pathways. Comp. Model. Gen. Bio. Net., pages 263–286, 2001. [9] J. Graham and K. Decker. Towards a distributed, environment-centered agent framework. Intelligent Agents VI, LNAI-1757:290–304, 2000. [10] M. Hallett. The unpredictability of cellular behaviour: trivial or fundamental importance to biology? Perspect. Biol. Med., 33:110–119, 1989. [11] C. Jonker, J. Snoep, J. Truer, and W. Wijngaards. Bdi-modelling of intracellular dynamics. In Bioinformatics and Multi-agent Systems, pages 15–23, July 2002. [12] S. Kerdelo, J. Abgrall, and J. Tisseau. Multi-agent systems: a useful tool for the modelization and simulation of the blood coagulation cascade. In Bioinformatics and Multi-agent Systems, pages 33–36, July 2002. [13] B. Kholodenko, O. Demin, and et al. Quantification of short term signaling by the egf receptor. J. Biol. Chem., 269:15756–15761, 1994. [14] H. Lodish, A. Berk, L. Zipursky, D. Baltimore, and J. Darnell. Molecular Cell Biology. W.H. Freeman and Company, New York, 1999. [15] P. Mendes. Gepasi: a software package for modeling the dynamics, steady states and control of biochemical and other systems. Comput. Appl. Biosci., 9:563–571, 1993. [16] P. Paruchuri, A. Pullalarevu, and K. Karlapalem. Multi-agent simulation of unorganized traffic. In First Conf. of Aut. Agents and MAS, pages 176–183, 2002. [17] M. Peleg, I. Yeh, and R. Altman. Modelling biological processes using workflow and petri net models. Bioinfo. J., 18(6):825–837, 2002. [18] L. Pouchard, R. Ward, and M. Leuze. An agent modelling approach to complex biological pathways. In Bioinformatics and Multi-agent Systems, pages 37–39, July 2002. [19] A. Regev, W. Shapiro, and E. Shapiro. Representation and simulation of biochemical processes using the π-calculus process algebra. In Pacific Symposium on Biocomputing, pages 459–470, January 2001. [20] B. Schoeberl, C. Jonsosson, E. Giles, and G. Muller. Computational modeling of the dynamics of the map kinase cascade activated by surface and internalized egf receptors. Nature Biotech., 20:370–375, April 2002. [21] D. Voet and J. Voet. Biochemistry. John Wiley and Sons, New York, 1995. [22] G. Weng, U. Bhalla, and R. Iyengar. Complexity in biological signal systems. Science, 284:92–96, April 1999.
Figure 4: co-ordinated MEK and ERK activation has been attempted in other MAS simulation environments, e.g., the modeling of roads in a simulation of unorganized traffic [16]. Modeling reaction-diffusion is straightforward given this setup — adjacent voxels exchange concentration information, following which molecules migrate from a voxel of higher concentration to one with lower concentration.
7.3 The Case for Large-grained Agents Large-grained agents are preferred for a simulation of this scale. Molecules within the ST domain can potentially be in many states requiring us to use a complex state representation. Duplicating the internal circuitry of every molecular species over many fine-grained agents can be inefficient. Secondly, to correct the skew in concentration, species-based statistics must be gathered, which is cumbersome if a species is distributed over many fine-grained agents.
7.4 Future Work Preliminary results from running the MAS simulator have been encouraging. An obvious improvement is increasing the granularity of the model. We are currently modeling at a granularity of 40,000 molecules per thread. This results in certain species, such as Raf, being represented by a single thread. As a result, the Raf thread can react and be sequestered by a slow reaction, in effect eliminating Raf from the simulation entirely. We are currently implementing a solution that alleviates the granularity problem by assigning variable scale factors to different molecular species based on their relative concentrations. We are looking at dividing the large cytosol compartment into concentric voxels, outwards from the nucleus. By doing so, we are better able to represent the regional organization (e.g., membrane-bound receptors) of ST components.
8.
REFERENCES
[1] R. Alur, C. Belta, and et al. Hybrind modeling and simulation of biomolecular networks. In Fourth Intl Wksp on Hybrid Sys., pages 19–32, 2001. [2] A. Arkin, J. Ross, and H. McAdams. Stochastic kinetic analysis of phage-lambda infected e.coli cells. Genetics, 149:1633–1648, 1998. [3] U. Bhalla and R. Iyengar. Emergent properties of networks of biological signal pathways. Science, 283:381–387, January 1999. [4] D. Bray, R. Bourett, and M. Simon. Computer simulation of the phosphorylation cascade controlling
392