International Environmental Modelling and Software Society (iEMSs) 2012 International Congress on Environmental Modelling and Software Managing Resources of a Limited Planet, Sixth Biennial Meeting, Leipzig, Germany R. Seppelt, A.A. Voinov, S. Lange, D. Bankamp (Eds.) http://www.iemss.org/society/index.php/iemss-2012-proceedings
A Multi-Objective Decision Support Tool for Rural Basin Management Yiannis Panagopoulos1, Christos Makropoulos1, Maria Mimikou1 Laboratory of Hydrology and Water Resources Management, Department of Water Resources and Environmental Engineering, School of Civil Engineering, National Technical University of Athens (NTUA), 5, Iroon Politechniou street, 15780, Zografou, Athens, Greece. 1
[email protected],
[email protected],
[email protected],.
Abstract: Irrigation and fertilization of crops are common practices necessary for the viability of agricultural communities, but also responsible for water scarcity and water quality deterioration. The effort to cost-effectively manage fresh water availability and diffuse nutrient pollution at the same time needs to take into account trade-offs between economic and multiple environmental objectives. Agricultural Best Management Practices (BMPs) are adaptation options for mitigating both environmental problems; however, their optimal allocation across the landscape becomes a multi-objective problem, with the need to identify the most suitable combinations. An efficient Decision Support Tool developed in MATLAB, able to assess the cost-effectiveness of irrigation and nutrient application management BMPs in reducing agricultural water use or nutrient losses to surface waters is used in this study. The tool integrates the process-based Soil and Water Assessment Tool (SWAT) model, which evaluates the effectiveness of the BMPs at different catchment locations, into a multi-objective genetic algorithm, which optimizes their selection and placement across the agricultural land. The novel software aspect of the tool is the automatic development of a BMP database (a look-up table), which stores environmental data and costs for the different locations and BMPs implemented on them and is used in the optimization scheme instead of the computationally intensive model. The application of the tool with the purpose to minimize cost, irrigation water consumption and nitrate-nitrogen loads to rivers from the cotton fields of the Pinios River Basin, the largest and most intensively cultivated area of Greece, demonstrated specific BMPs allocation schemes that could be affordable-cost solutions of efficient water quantity and quality management. In this paper, one such solution is presented and discussed, demonstrating the potential usefulness of the methodology in identifying costeffective management interventions, even in large, complex river basins and under a climatically and socio-economically changing environment. Keywords: BMPs; decision support; optimization algorithm; SWAT; trade-off. 1. Introduction In the Mediterranean region, agriculture is an essential driving force in the management of water and nutrient use having significant impacts on water quantity and quality. Especially in Greece, the viability of the local agricultural economies concentrated in the largest agricultural plains (lowland cultivated areas), are based on the production of cotton, a highly subsidized product from the EU. However,
Y. Panagopoulos et al. / A Multi-Objective Decision Support Tool for Rural Basin Management
cotton is a water and nutrient demanding crop that approximately needs 600 mm of water and 200 kg N/ha per annual growth cycle in order to produce the optimum harvest yield. Because of the low rainfall depths during summer, agriculture in those areas is by far the largest consumer of freshwater resources accounting for nearly 90% of the total abstractions [Wriedt et al., 2009], while several of those areas additionally suffer from nitrate pollution. An agricultural area that meets both these environmental problems is the extensively cultivated Pinios River Basin in central Greece, which has also been included in the Nitrate Vulnerable Zones of the country [Loukas et al., 2006]. Therefore, in order to retain water quantity and quality of this area at desirable levels, the coordination of cost-effective measures form part of the interventions that should be included in the integrated River Basin Management Plan (RBMP) of the greater area, required by the European Water Framework Directive (WFD). However, as net irrigation and fertilization requirements can always vary across the landscape according to the local physical characteristics, it can be concluded that in order to meet multiple environmental objectives at the least possible cost there is a need to identify optimal locations for implementation of agricultural Best Management Practices (BMPs). To study and address such a multi-objective problem the following elements could be combined: (a) a process-based model, which can represent the effect of agricultural management at the catchment scale on the parameters of interest and (b) an efficient multi-objective optimization algorithm, i.e. evolutionary algorithm or Genetic algorithm (GA) in particular, which is capable of treating several objectives separately and develop a global Pareto-optimal front (usually a high-quality approximation of the Pareto front), the near-optimal trade-off frontier between conflicting objectives [Makropoulos and Butler, 2005; Nicklow et al., 2010]. Regarding the first point, this paper uses the Soil and Water Assessment Tool (SWAT) model [Arnold et al., 1998], which is capable for simulating management in agricultural catchments and has been already combined with GAs to optimize the selection and placement of agricultural practices across catchments [e.g. Arabi et al., 2006; Jha et al., 2009; Panagopoulos et al., 2012]. A notable example is the recent study of Panagopoulos et al. [2012], which has substituted the dynamic linkage between SWAT and the optimization algorithm by a database that serves, in this case, as the real-time pollutant load estimator and cost data provider. This approach accelerates the optimization process and was followed in this paper, which additionally innovates on the combined use of irrigation and nutrient application management BMPs in order to meet at the same time both quantitative and qualitative objectives. Hence, this paper presents the development of an efficient Decision Support Tool (DST) for rural basin management with the corresponding problem formulation being the evaluation of combinations of BMPs across the Pinios catchment, which minimize total mean annual irrigation water consumption, nitrate-nitrogen (N-NO3) losses from cotton fields to surface waters as well as the total cost (including farmer’s lost income) of their implementation.
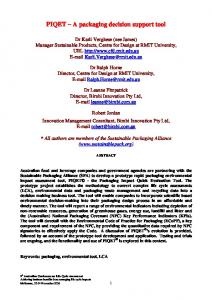
2. Methods and tools A schematic of the DST is presented in Figure 1. As can be seen, it is comprised of: a) the alternative BMPs, b) the SWAT model, which evaluates their impact on water consumption, N-NO3 losses from fields to waters and on the crop yields, after representing the baseline in the catchment, c) a BMP database that stores irrigation amounts, N-NO3 loads and costs for all locations and BMPs implemented, as well as, d) a MATLAB-GA, which serves as the optimization engine for the selection and placement of BMPs in the cotton land in order to minimize all the 3 objectives of water consumption, N-NO3 losses and cost of BMPs implementation.
Y. Panagopoulos et al. / A Multi-Objective Decision Support Tool for Rural Basin Management
Figure 1. A schematic of the developed Decision Support Tool.
2.1. SWAT model description The Soil and Water Assessment Tool (SWAT) is a river basin model developed by the U.S.D.A. Agricultural Research Service [Neitsch et al., 2005]. The present study used the SWAT2009 version and ArcSWAT interface. SWAT divides the catchment into subbasins and subsequently into Hydrologic Response Units (HRUs), which represent the different combinations of land use and soil types in each subbasin. The processes associated with water and sediment movement, crop growth and nutrient cycling are linked to management practices and are modelled at the HRU scale. Actual crop transpiration depends on the soil water content, while the phenomenological development of crops is based on a daily heat unit accumulation, affecting leaf area growth, root depth, biomass and yield. Water and nutrient stress can limit crop growth according to a daily comparison between actual and potential plant uptake. Irrigation schedules (dates and water amounts) and fertilization operations are user-defined, while a flexible way is the autoirrigation and auto-fertilization routine, triggering irrigation and N fertilizer operations within pre-defined thresholds of soil water deficit (mm) and plant N stress respectively [Neitsch et al., 2005].
2.2. The MATLAB genetic algorithm and multi-objective optimization For multi-objective optimization, where the solution is a multi-dimensional front (the pareto front), GAs have been developed to converge to a high-quality approximation of the optimal front and ensure the conservation of an adequate spread of solutions on that front (Pareto-approximate). One of the most popular, robust, efficient and fast multi-objective GAs is the Non-dominated Sorted Genetic Algorithm (NSGA-II) [Deb et al., 2002]. In this work, a controlled, elitist GA, that is a variant of NSGA-II, as coded in the MATLAB R2007b GA toolbox, was used to drive the optimization process. The controlled elitism works in favour of individuals with a better fitness value (rank). As the algorithm progresses, it maintains population diversity for convergence to the Pareto-approximate front by using the options 'ParetoFraction' and 'DistanceFunction'. The first limits the number of individuals on the Pareto front (elite members), and the second is an embedded crowding distance function that helps to maintain their diversity by favouring individuals that are relatively far from each other. A random or user-defined initial population is generated, and continues with the generation of a sequence of new populations by performing individual ranking, selection, crossover and mutation according to several available options in the toolbox (this selection is a heuristic problem based on trial and error) [MATLAB, 2010].
3. Methodology 3.1 Case-Study and model setup The catchment under study (Figure 2) is the Pinios river basin in central Greece which flows to the Aegean sea to the East. The area of the catchment is almost 10500 km2. An annual rainfall of 680 mm, coupled with high evapotranspiration during summer results to a 80 m3 s-1 mean annual flow. For modelling the catchment with SWAT, topography was represented by a 50 × 50 m2 digital elevation model (DEM), while soil information by a combination of a detailed soil
Y. Panagopoulos et al. / A Multi-Objective Decision Support Tool for Rural Basin Management
map in the agricultural areas, provided by the National Institute of Soil Mapping and Classification (ISMC) (http://www.ismc.gr/index.php?lang=en), and a geological map (1:50000 scale), provided by the National Institution of Geology and Mineral Exploration (http://www.igme.gr). For representing land cover types, the CORINE Land Cover (CLC) geographical database of 2000 (scale 1:100000) [EEA-ETC/TE, 2002], was used. According to the national data of 2000 reported to Eurostat (http://epp.eurostat.ec.europa.eu) regarding crops allocation at the smaller administrative level, cotton predominated the catchment covering approximately 160000 ha, more than 70% of the total irrigated land. Based on the DEM, the catchment was divided in SWAT into 49 subbasins (Figure 2), subsequently, the landuse (CLC2000) and the soil map were overlaid. As a result, 361 HRUs were created, corresponding to approximately a 30 km2 area on average. From those HRUs, 46 represented cotton (the other crops of the arable land are not included in the current analysis with BMPs), which were mostly irrigated from groundwater resources. Notable examples are some areas in the southern and eastern part of the basin, which are irrigated from surface waters diverted from reservoirs constructed along the river (yellow coloured areas in Figure 2), while a small part in the western part of the catchment receives irrigation water from a reservoir located outside the catchment.
Figure 2. The Pinios River Basin. The baseline scenario, representing the traditional agricultural ways for the catchment was modelled in SWAT. A typical cotton growth cycle included: a) crop sowing at the end of April, b) 190 kg of Nitrogen and 35 kg of Phosphorus fertilization per ha, c) 10 irrigation operations with a 50 mm dose applied from the end of May until the end of August at a 10-days interval, d) harvest in September with crop yields ranging between 3-4 tn ha-1 and e) a soil tillage operation in early November. Complete time-series of measured precipitation and temperature were provided by both the Public Power Corporation (PPC) of Greece and the Hellenic Ministry for the Environment, Physical Planning and Public Works (MEPPPW) for several stations (Figure 2). Annual precipitation ranged from 500 mm in the eastern part of the catchment to more than 1500 mm in the most western mountainous edge. Observed monthly river flows and nutrient concentrations at several river sites were also provided by MEPPPW. The model was calibrated by adjusting the most sensitive parameters and comparing the simulated results with observed ones. For river flows, Nash-Sutcliffe
Y. Panagopoulos et al. / A Multi-Objective Decision Support Tool for Rural Basin Management
coefficients were always above 0.7. Due to lack of long time-series data of nutrients a different approach was followed, with a comparison of simulated and observed concentrations on a seasonal basis (Panagopoulos et al., 2011b). The total water consumed for the irrigation of all crops in the catchment is almost 900 hm3. However, this amount is approximately 30% higher than the annual renewable water resources in the area (700 hm3), which have been calculated according to long-term hydrometeorological data and the hydrogeological attributes of the aquifers. To simulate this situation, we assigned non-zero initial water storage in aquifers at the beginning of the simulation, while we also permitted water abstraction from reservoirs, even when water storage fell below a minimum required storage volume. As far as the N-NO3 concentrations are concerned, the correlation was successful for several river sites within the basin with acceptable R2 values. Mean annual N-NO3 concentrations ranged between 0.7-1.2 mg/l with the mean annual N-NO3 losses from the total area of the catchment being 2 kg/ha and from cotton fields nearly 10 kg/ha. Cotton yields were estimated 3.5 tn ha-1 on average, comparable to the actual yields harvested each year. Due to space limitations we do not further analyze the calibration of the Pinios model here; however, for a part of the entire basin, the reader can find details in the published paper of Panagopoulos et al. [2011a].
3.2 Implementation of BMPs Four alternative BMPs were tested in this study. A summary of the key information related to them is presented in Table 1 including the baseline scenario. The last measure applies auto-irrigation and auto-fertilization application trying to mimic the implementation of precision agriculture technologies in cotton fields of the basin. Table 1. List of BMPs selected for cotton in the study area. Irrigation Practices
Description of Irrigation practices
1 (baseline)
570 mm of water, 190 kg N/ha
2 (40% deficit) 3 (50% Fertilization reduction) 4 (2&3)
350 mm of water, 190 kg N/ha 570 mm of water, 95 kg N/ha 350 mm of water, 95 kg N/ha Automatically assigned according to soil water deficit and N stress
5 (precision agriculture)
3.3. Development of the database The database, developed for use with the DST, stores amounts of irrigation water use, N-NO3 losses from fields (HRUs in this case) and additional costs from the baseline arising from the implementation of each BMP to all cotton HRUs. It consists of 3 tables (3 variables) with rows representing the HRUs of the catchment and columns the irrigation water amounts, N-NO3 losses or costs. Thus, each table contained 361×5 cells, whereby 361 was the number of HRUs in the Pinios catchment and 5 was the number of BMPs totally tested (Table 1). For creating the database a set of scripts in MATLAB found and opened the input ‘mgt’ files used by SWAT to identify practices within each HRU. It recognized land use information and set the values which were required to represent each practice. SWAT was then run for 17 years (2011-2027) thus simulating mean annual values that would have been produced from all HRUs during this period, if a BMP was applied. The weather generator of SWAT was used for creating future climate time-series based on the historical data. From the consecutive runs of all 5 BMPs, the mean annual results from each HRU were obtained, populating the database. The concept of creating the database is thoroughly described in Panagopoulos et al. [2012].
Y. Panagopoulos et al. / A Multi-Objective Decision Support Tool for Rural Basin Management
3.4. Multi-objective optimization The optimization process for the Pinios basin started with the initialization of a population. Each individual consisted of genes equal to the number of decision variables (the number of HRUs). A real integer coding was selected to represent this problem, thus the genes of each individual were expressed by integer values between 1 and 5, the 5 alternative situations as they were numbered in Table 1. The algorithm created a sequence of new populations by performing selection, crossover and mutation [MATLAB, 2010]. A population of 500 with a total maximum number of generations equal to 5000 was selected for the specific optimization problem and the process lasted only a few hours by making 2,5 × 10⁶ evaluations (500 × 5000) using data from the database. In this way, the process becomes orders of magnitude faster than a hypothetical optimization process including a dynamic linkage to the SWAT model (Panagopoulos et al., 2012). A Pareto fraction equal to 0.1, limited the number of solutions in the first Pareto front to 50 The objectives for optimization (minimization here) included: a) the total mean annual irrigation water applied over the total irrigated land estimated in hm3, b) the mean annual N-NO3 losses from the catchment (tn) and c) the total cost of BMPs implementation in cotton fields (€). For the calculation of costs the scripts used for the creation of the Database took into consideration the actual yield reduction caused by the practice along with a price of 0,54 euro/kg as well as the capital and operational cost of implementing precision agriculture technologies. A preliminary estimation for those costs was at 50 €/ha based on an analysis of data provided by the ISMC which test such practices within parts of the Pinios area in the framework of a European funded project (http://www.hydrosense.org/).
4. RESULTS AND DISCUSSION The optimal trade-off frontiers of water-cost and N-NO3 – cost produced are demonstrated in Figure 3 along with a catchment management scheme, corresponding to a Pareto solution depicted with a triangle. By spending 32 M€ (including lost income), 15% less water for irrigation is consumed on an annual basis (780 instead of 900 hm3) and 10% less N-NO3 losses to waters occur (1800 tn instead of 2000 tn). This management scheme depicted on the map of the catchment proposed a deficit irrigation in small areas of the southern and western parts of the catchment (BMP2), along with a fertilization reduction in the central part (BMP3), a combination of these BMPs (BMP4) in significant parts as well as precision agriculture technologies (BMP5) in a small western part of the basin. In order to find this compromise solution the algorithm also selects the baseline agricultural management (BMP1) in a very large part of the total cotton areas located both in the Southwestern and in the Eastern part of the catchment. Especially this large area in the eastern part is irrigated by a reservoir which uses the significant flows of the Pinios basin and is irrigated adequately in the baseline. On the other hand, fertilization reduction applied either alone or combined with deficit irrigation, was selected in large parts of the catchment and was responsible for the 10% N-NO3 losses reduction from the baseline. However, if both these very effective measures had been entirely applied, the cost would have been drastically increased due to the high yield losses that the practices cause. Precision agriculture technologies were limited in a very small part of the catchment. According to our analysis, the additional cost for installing and operating the equipment is almost equivalent with the reduced cost of fertilization. Yields are retained close to the ones simulated for the baseline and the practice causes significant N-NO3 pollution reduction but saves only 10-15% water. This is actually the reason that the algorithm did not extensively choose this practice in the area in its attempt to reduce irrigation water preferring the combined use of deficit irrigation and fertilization reduction. The latter can somehow balance the lost income caused due to the reduced yields by significantly reducing expenses for buying fertilizers.
Y. Panagopoulos et al. / A Multi-Objective Decision Support Tool for Rural Basin Management
Figure 3. A management solution corresponding to the triangle in the Paretoapproximates and its depiction on the catchment map. BMPs 1-5 correspond to Table 1.
Other important solutions on the fronts could be those which result in significant environmental improvements with much higher cost. As demonstrated, there were many management schemes that could reduce irrigation water abstractions by approximately 200 hm3 and N-NO3 losses by more than 250 tn from the baseline. These measures possibly include an extensive application of deficit and fertilization reduction which however cause high yield losses from the baseline. Another important point in this analysis is that the trade-off between water consumption and cost could not be extended under the 720 hm3 of water, thus it could not reach the critical value of 700 hm3, which corresponds to the annual renewable water resources, a consumption that could ensure a sustainable agricultural water management in the area. This could only be achieved by including more drastic or additional practices in the analysis such as the reuse of treated waste water or the improvement of the irrigation networks which would improve the overall water use efficiency index. Otherwise, this target could be approached by extending all BMPs to other irrigated areas in the catchment such as corn and alfalfa cultivations.
5. Conclusions and future research The decision support tool presented in this paper significantly accelerated the optimization process by including a look-up table, populated by the SWAT model after testing different BMPs in the catchment. An acceptable compromise of irrigation water and nutrient management in the Pinios catchment mostly included a combined deficit and fertilization reduction in large parts of the catchment along with no interventions in others. This combined agricultural management solution led to a total water saving of approximately 120 hm3 or a reduction of 15% from the
Y. Panagopoulos et al. / A Multi-Objective Decision Support Tool for Rural Basin Management
baseline and a N-NO3 pollution reduction of 10% with an additional annual cost of 32M€ or 200€/ha of cotton land. The conceptual design of our tool is in progress in order to include more kinds of agricultural practices, while a better representation of precision agriculture is also needed along with more accurate cost estimations of all practices. However, even by producing these preliminary results, it is suggested that the methodology and tool offer opportunities for identifying cost-effective management solutions for meeting multiple environmental targets in rural areas. ACKNOWLEDGEMENTS The current research was conducted under the project ‘i-adapt’, which is a Pilot project on Development of Prevention Activities to Halt Desertification in Europe, partly funded by DG Environment of the European Commission. http://i-adapt.gr/. REFERENCES Arabi, M., R.S. Govindaraju and M.M Hantush. Cost-effective allocation of watershed management practices using a genetic algorithm. Water Resources Research, 42, W10429, DOI:10.1029/2006WR004931., 2006. Arnold, J.G., R. Srinivasan, R.S. Muttiah and J.R. Williams. Large area hydrologic modeling and assessment part I: model development. Journal of the American Water Resources Association, 34(1), 73-89, 1978. Deb, K., A. Pratap, S. Agarwal, and S. Meyarivan. A fast and elitist multiobjective genetic algorithm: NSGA-II, IEEE Transactions of Evolutionary Computation 6(2), 182-197, 2002. EEA-ETC/TE. CORINE Land Cover update. I&CLC 2000 project, Technical Guidelines, 2002. URL: http://etc-lusi.eionet.europa.eu/. Jha, M., S. Rabotyagov, S. and P.W. Gassman. Optimal placement of conservation practices using genetic algorithm with swat. International Agricultural Engineering Journal, 18(1-2), 41-50, 2009. Loukas, A., N. Mylopoulos and L. Vasiliades. A Modeling System for the Evaluation of Water Resources Management Strategies in Thessaly, Greece. Water Resources Management, 21,1673–1702, 2006. Makropoulos, C. and D. Butler. A multi-objective evolutionary programming approach to the “object location” spatial analysis and optimisation problem within the urban water management domain. Civil and Environmental Systems, 22(2), 85-107, 2005. MATLAB. Global Optimization Toolbox, User’s Guide, 2010. URL: http://www.mathworks.com/access/helpdesk/help/pdf_doc/gads/gads_tb.pdf Neitsch S.L., J.G. Arnold J.R., Kiniry and J.R. Williams. Soil and water assessment tool-theoretical documentation-version 2005. Blackland Research Center Agricultural Research Service, Texas – USA, 2005. Nicklow J., P. Reed D. Savic, T. Dessalegne, L. Harrell, A. Chan-Hilton, M. Karamouz, B. Minsker, A. Ostfeld, A. Singh and E. Zechman. State of the Art for Genetic Algorithms and Beyond in Water Resources Planning and Management., Journal of Water Resources Planning and Management, 136(4), 412-432, 2010. Panagopoulos Y., C. Makropoulos and M. Mimikou. Diffuse surface water pollution: Driving factors for different geoclimatic regions. Water Resources Management, 25(14), 3635-3660, 2011a. Panagopoulos Y., C. Makropoulos, E. Baltas and M. Mimikou. SWAT parameterization for the identification of critical diffuse pollution source areas under data limitations. Ecological Modelling, 222, 3500-3512, 2011b. Panagopoulos, Y., C. Makropoulos, and M. Mimikou. Decision support for diffuse pollution management, Environmental Modelling & Software 30, 57-70, 2012. Wriedt G., M. Van der Velde, A. Aloe and F. Bouraoui. Estimating irrigation water requirements in Europe. Journal of Hydrology,373, 527-544, 2009.