A Multi-Pronged Approach to Benchmark Characterization Nikola Puzovi´c∗ , Sally A. McKee† , Revital Eres‡ , Ayal Zaks‡ , Paolo Gai§ , Stephan Wong¶ , and Roberto Giorgi∗ ∗ University of Siena Siena, IT {puzovic, giorgi}@dii.unisi.it † Chalmers University of Technology Gothenburg, SE
[email protected] ‡ IBM Haifa Labs Haifa, IL {eres, zaks}@il.ibm.com § Evidence S.r.l. Pisa, IT
[email protected] ¶ Delft University of Technology Delft, NL
[email protected]
Abstract—Understanding the behavior of current and future workloads is key for designers of future computer systems. If target workload characteristics are available, computer designers can use this information to optimize the system. This can lead to a chicken-and-egg problem: how does one characterize application behavior for an architecture that is a moving target and for which sophisticated modeling tools do not yet exist? We present a multi-pronged approach to benchmark characterization early in the design cycle. We collect statistics from multiple sources and combine them to create a comprehensive view of application behavior. We assume a fixed part of the system (service core) and a “to-be-designed” part that will gradually be developed under the measurements taken on the fixed part. Data are collected from measurements taken on existing hardware and statistics are obtained via emulation tools. These are supplemented with statistics extracted from traces and ILP information generated by the compiler. Although the motivation for this work is the classification of workloads for an embedded, reconfigurable, parallel architecture, the methodology can easily be adapted to other platforms.
I. I NTRODUCTION At the start of any new architecture project, researchers must make many crucial decisions, including what modeling methods and tools to use for exploring the target design space and what software workloads to employ to exercise the architectures under study. This is especially tricky when the architecture is being designed from the ground up: how do we characterize workloads without a fixed ISA? How do we assemble a suite of tools that provide enough data to make well informed decisions? Here we present a case study of how we address these issues for an architecture
c 2010 IEEE 978-1-4244-8396-9/10/$26.00
that is a moving target. The project driving this work addresses reconfigurable embedded architectures, but the modeling challenges apply equally to platforms at all scales. To bootstrap this research, we first chose a set of applications of interest, and then devised a modeling strategy to derive application characteristics that are relevant to the design of our architecture. In so doing, we have pushed the QEMU emulation toolset [1] further in a novel direction that expands its sphere of influence from cross-platform emulation into fast architectural modeling using Dynamic Binary Instrumentation (DBI) driven simulation. DBI tools are very fast and flexible, and their use in architectural design (which is currently quite rare) is likely to grow rapidly. Although we are aware that the behavior of the new system will not be identical to the one “under measurement”, our methodology tries to extract initial design hints and other information that can drive dynamic reconfiguration policies. Since the project leverages prior work in reconfigurable computing, some details of the target platform were decided a priori. As target architecture for the accelerator, we have chosen the VEX VLIW architecture. VLIW processors require no complex hardware to extract parallelism. Consequently, the hardware design can be kept simple to allow for faster core frequencies and lower power consumption. The embedded kernels or phases intended to be run on an accelerator are likely to exhibit high parallelism, and thus should achieve higher hardware utilization than general-purpose VLIW cores. The parameterized ρ-VEX processor [2] we use allows for further customization of processor resources, e.g., register file sizes, functional units,
and execution pipelines. Finally, existing industrial strength VLIW compilers can be leveraged in code scheduling. We decided to use as our exploratory FPGA platform the Virtex-6 ML605 Evaluation Kit, a fast board that comes with verified reference designs, including a MicroBlaze core and DDR-3 memory interface. PetaLogix offers a complete Linux distribution, and QEMU can be configured to model this board. Since design verification and software debugging costs prohibit implementing every design point in hardware, we use software tools for design space exploration. At this point in the design, the challenge is to model the target architecture as completely as possible, even though information on some components is not yet available. This is a common scenario for designers of systems at all scales. The purpose of this work-in-progress report is to share our experimental approach and to encourage conversations on improving available tools and technologies for solving such chicken-and-egg design problems.
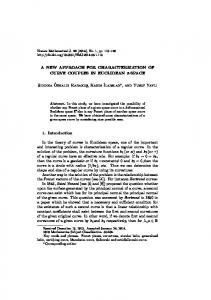
Figure 1.
•
II. C ASE S TUDY: ERA One of the uses for the flexible approach we describe is to characterize applications in order to expose the potential for profitably reconfiguring the architecture at run time. This is precisely the problem space targeted by the EU FP7 ERA (Embedded Reconfigurable Architectures) project [3]. When almost all aspects of the underlying architecture can be reconfigured dynamically, this analysis helps to illuminate possible benefits of such reconfiguration, and should guide development of automated run-time mechanisms to trigger reconfiguration. As an example, if analysis shows that two applications have different characteristics with respect to memory behavior (e.g., high temporal locality versus no locality), the system could be reconfigured when switching applications, and this should increase performance and/or save power. Reconfiguration can also occur within an application when consecutive intervals differ significantly. By using what we learn from program analysis to develop techniques for automatic reconfiguration, we hope to create an ERA system that adapts itself to deliver high performance while maintaining low power budgets. III. ERA A PPLICATIONS The application set for this case study reflects common usage scenarios in an embedded system such as a smartphone. The set includes image and video processing applications, security programs, and object and image recognition software (e.g., for augmented reality). Several of the applications are already parallelized, and some have well defined highlevel QoS requirements that the architecture must meet. • Jpeg compression/decompression is commonly used in embedded systems: almost all smartphones contain cameras and can convert raw data from the image sensor to this format. Our code is from the MiBench suite [4].
•
•
•
•
•
•
High level view of the ERA system
H.264 (“MPEG4 part 10” or “MPEG-4 AVC”) is a video coding standard that can provide high video quality at lower bit rates [5]. It is used in high resolution video (satellite, cable, or DSL broadcast), video storage (HD-DVD, blu-ray disc), and internet. Our implementation comes from the PARSEC benchmark suite [6]. The Elliptic Curve Digital Signature (ecds) algorithm calculates digital signatures for received data (files) to verify senders identities. This type of cryptography can achieve security levels similar to RSA techniques with keys that are five times shorter. Reference code is from the Basicrypt suite [7]. The Tesseract OCR engine (ranked in the top three engines from the 1995 UNLV Accuracy Test) is probably the most accurate open source OCR engine. It adapts to a user’s handwriting. We adapt code from the Tesseract project repository to omit the GUI and to measure the recognition time. The yuv2rgb application reads a YUV video input stream and outputs an equivalent RGB24-format stream. MPEG2 decodes streams of frames encoded using the lossy MPEG2 video/audio format [8] widely used in digital television broadcast over the air and via cable or satellite systems. It can be run as multiple threads. The AC3 decoder interprets streams of audio frames encoded using high-quality, low complexity multichannel AC3 audio [9]. By coding multiple channels as a single entity, it can operate at lower data rates. Our implementation is parallel. Susan, from the MiBench suite [4], recognizes edges and corners in Magnetic Resonance Images of the brain. Our version is parallelized with OpenMP. IV. M ETHODOLOGY
We collect statistics from different sources and combine them to give a more complete view of the behavior of each application. Since the exact model of the architecture is not
known, there exists no simulator that we can use in our study. This is not entirely problematic, since we want to capture behavioral characteristics that are as architectureindependent as possible, so that data derived from modeling the control processor will be valid also for accelerators (e.g., even if the architecture changes, measured memory behaviors should be similar). As an initial design, we assume a fixed part of the system (the service core) and several “to-be-designed” parts. The latter will be developed to exploit application characteristics that represent performance enhancing or power saving opportunities, and to address characteristics that can hinder our ability to deliver high performance at low power. For instance, “to-be-designed” parts may include accelerators, a network-on-chip (NoC), or a memory hierarchy. The QEMU emulator executes cross-compiled programs on top of an operating system. The guest platform can be configured to closely match the target system. For example, in the case of embedded systems, reasonable guest platforms could be either a MicroBlaze soft core or an ARM, but in the case of general purpose platforms, the i386 guest platform makes more sense. Here we use a QEMU configuration that mimics the ML605 hardware, with a software MMU unit and no FP units. Whole-program statistics are used to make the broad initial decisions that will classify benchmark behavior (e.g., as memory intensive vs. computation intensive), while intervalbased statistics are further processed to see how application behavior changes during execution. Phase detection techniques [10] enable us to group intervals into clusters: intervals from the same cluster should show very similar statistics, while ones from different clusters should not. We modify QEMU to generate statistics that can be used to drive phase detection (much like Lau et al. [11]). This gives an additional dimension to our benchmark classification, since we can group benchmarks according to their potential for exploiting the reconfigurability of the architecture; e.g., we may be able to save power by switching off cache lines during intervals with low memory activity or little temporal locality [12]. Another interesting avenue of investigation is the use of real hardware to extract statistics and to strengthen the results obtained from emulation. For instance, the ML605 board can be used together with the Lauterbach [13] tracing tools. Lauterbach traces only give information on memory references (connected with source code), while QEMU allows us to gain insight into the complete state of the emulated hardware. Nonetheless, the hardware traces provide one means of validating QEMU results. Since QEMU is an emulator, it does not allow the user to generate statistics related to the behavior of the microarchitecture (e.g., cache miss rates, or available ILP). In order to obtain these, we must consult other sources of information. For instance, we rely on compiler tools that give an estimate
of the available ILP in the application based on instruction schedules for VLIW and superscalar architectures. The ILP of an application is limited by machine independent and machine dependent factors. The former relate mainly to the amount of ILP inherent in the application’s source code, while the latter relate to the resource constraints of the architecture on which we are running. To classify applications according to their ILP the hot code is first extracted using standard profiling tools (oprofile, gcov) on standard platforms (PowerPC, x86). Then we try to estimate the ILP in the hot code by examining the code generated by gcc for different architectures; for example, VLIW code produced for VEX, code generated for superscalar architectures, and code generated for vector architectures. In this stage gcc can be modified to assume larger issue rates and more machine resources than these platforms actually have. This allows us to focus on gcc’s ability to extract ILP in the hot code, exposing issues which might suppress it (i.e., aliasing) while minimizing the machine-dependent factors. These experiments can be refined as additional parameters of the (micro)architecture become available. The next challenge is combining the various statistics in a meaningful way. This is easy for statistics on whole-program execution. Putting together statistics from separate execution intervals is more difficult: different tools often have different notions of time, and there can be a mismatch between the interval boundaries. QEMU does not know how many cycles it takes to execute a program. However, we can instead use the number of executed instructions to represent a unit of time. The compiler cannot estimate the time of execution at all, but tracing tools can give a detailed report on the elapsed number of cycles. The common denominator that can be used to unify statistics gathered from these sources is the source code: in all cases the statistics can be linked back to the statements whose execution generated them. The intervals during execution can be connected via the source code of the application, and this can be used to match start and end times of intervals: for example, if we know that during a certain interval in QEMU we are executing the code from function foo(), the information about this function that is extracted from the compiler can be bundled together with the statistics being collected. V. M ETRICS Hoste and Eeckhout [14] show that hardware performance counters (which are microarchitecture-dependent) can be misleading: even if they show similarity between programs, underlying behaviors may be different. We therefore rely on microarchitecture-independent metrics for program characterization. New statistics can easily can be added later. Memory behavior is characterized using working set sizes, memory access strides, and reuse distances [15]. These statistics do not depend on the underlying microarchitecture, and they can be used to estimate the impact of the memory
system implementation on the overall performance (e.g., reuse distances can be used to estimate cache miss rates). Working set size is the number of words (or pages) touched during execution. For memory strides and reuse distances, we create frequency histograms. We calculate strides both locally (address stride between two consecutive executions of the same instruction) and globally (address stride between two consecutive accesses to memory). We also need to characterize the impact of the processor architecture on execution. In this first analysis we use register degree-of-use and register dependency distance. Degree-of-use is calculated as the number of reads between two consecutive writes. Dependency distance is the number of instructions executed between writes and reads to a register. This information can help in assessing whether implementing data-forwarding techniques can be effective. Another metric that can characterize the requirements of the processor is instruction mix. This is calculated by counting the different opcodes encountered during a program’s execution and grouping them according to instruction type (e.g. ALU, memory). VI. C ONCLUSIONS We have modified QEMU to produce the above metrics and have performed initial characterization of our benchmarks using both the emulator and various compiler tools. It turns out that the potential for reconfiguration is high in all tested applications, and our tools are able to report this fact. However, we still get some “false positives” in terms of reconfigurability: statistics from QEMU processing SimPoints sometimes reports differences among intervals in cases where the differences are not actually of interest. For example, SimPoint might classify two intervals as different based on the number of memory accesses, but if almost all memory accesses exhibit high spatial locality the phases are actually similar in terms of opportunities for reconfiguration. This highlights the problem of selecting the correct metrics for classification. Some of the applications (x264 and Tesseract-OCR) show a flat profiling histogram, meaning that no outstanding hot function exists, and this makes it hard to estimate the ILP available in these applications. This might be an indication that the programs are well optimized, or that the selected datasets are not representative: different inputs might reveal different behavior, and we will investigate this problem in the remainder of the project. ACKNOWLEDGMENT This work is supported by the European Commission FP7 collaborative project ERA #249059. R EFERENCES [1] F. Bellard, “QEMU, a fast and portable dynamic translator,” in Proc. USENIX Annual Technical Conference, FREENIX Track, Apr. 2005, pp. 41–46.
[2] S. Wong, T. van As, and G. Brown, “ρ-VEX: A reconfigurable and extensible softcore VLIW processor,” in Proc. IEEE International Conference on Field-Programmable Technologies (ICFPT08), Dec. 2008, pp. 369–372. [3] (2010) ERA – Embedded Reconfigurable Architectures. [Online]. Available: http://www.era-project.eu/ [4] M. Guthaus, J. Ringenberg, D. Ernst, T. Austin, T. Mudge, and R. Brown, “MiBench: A free, commercially representative embedded benchmark suite,” in Proc. IEEE 4th Workshop on Workload Characterization, Dec. 2001, pp. 3–14. [5] T. Wiegand, G. Sullivan, G. Bjontegaard, and A. Luthra, “Overview of the H.264/AVC Video Coding Standard,” IEEE Transactions on Circuits and Systems for Video Technology, vol. 13, no. 7, pp. 560–576, 2003. [6] C. Bienia, S. Kumar, J. Singh, and K. Li, “The PARSEC benchmark suite: Characterization and architectural implications,” in Proc. of the 17th International Conference on Parallel Architectures and Compilation Techniques, May 2008, pp. 72–81. [7] I. Branovic, R. Giorgi, and E. Martinelli, “A workload characterization of elliptic curve cryptography methods in embedded environments,” ACM SIGARCH Computer Architecture News, vol. 32, no. 3, pp. 27–34, 2004. [8] M. Bosi, K. Brandenburg, S. Quackenbush, L. Fielder, K. Akagiri, H. Fuchs, M. Dietz, J. Herre, G. Davidson, and Y. Oikawa, “ISO/IEC MPEG-2 advanced audio coding,” Journal of the Audio Engineering Society, vol. 45, no. 10, pp. 789–814, 1997. [9] M. Davis, “The AC-3 Multichannel Coder,” in Audio Engineering Society Convention 95, Oct. 1993. [10] G. Hamerly, E. Perelman, J. Lau, and B. Calder, “SimPoint 3.0: Faster and more flexible program phase analysis,” Journal of Instruction Level Parallelism, vol. 7, Sep. 2005. [11] J. Lau, S. Schoemackers, and B. Calder, “Structures for phase classification,” in Proc. IEEE International Symposium on Performance Analysis of Systems and Software, 2004, pp. 57– 67. [12] M. Alioto, P. Bennati, and R. Giorgi, “Exploiting locality to improve leakage reduction in embedded drowsy I-caches at same area/speed,” in Proc. IEEE International Symposium on Circuits and Systems, May 2010, pp. 37–40. [13] Lauterbach. (2010) Microblaze debugger and real-time trace. [Online]. Available: http://www2.lauterbach.com/pdf/debugger microblaze.pdf [14] K. Hoste and L. Eeckhout, “Microarchitecture-independent workload characterization,” IEEE Micro, vol. 27, no. 3, pp. 63–72, 2007. [15] K. Beyls and E. D’Hollander, “Reuse Distance as a Metric for Cache Behavior,” in Proc. IASTED Conference on Parallel and Distributed Computing and Systems, vol. 14, 2001, pp. 350–360.