A Multi-Scale Spectral Image Segmentation Method for Corpus Callosum Classification in MR Images Ashraf Elsayeda, Frans Coenena, Marta Garcia-Finanab and Vanessa Slumingc∗ aDepartment of Computer Science, University of Liverpool, Ashton Building, Ashton street, Liverpool, L69 3BX bCentre for Medical Statistics and Health Evaluation, University of Liverpool, Brownlow Street, Liverpool, L69 3GS cSchool of
Health Sciences, University of Liverpool,Thomson-Yates Building, Brownlow Hill, L69 3GB
Abstract. In this paper we describe an approach to the classification of the corpus callosum in Magnetic Resonance Image (MRI) “brain scans” founded on a variation of the standard multi-scale Spectral Image Segmentation Method. The variation is founded on the observation that the corpus callosum comprises white matter tissue (i.e. the pixels have high intensity values). Therefore a threshold interval can be applied to the MRI pixel data so as to exclude intensity values outside the interval, and consequently facilitate identification of the Corpus Callosum. The resulting segments are then processed further using a graph mining technique and a decision tree based feature selection mechanism. The results obtained to date show that the proposed segmentation performs both efficiently and effectively, obtaining a classification accuracy of over 95% in the case of the given application.
1
Introduction
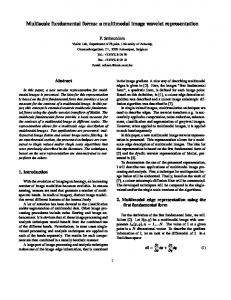
The application of established data mining techniques to image data sets involves a number of challenges related to the pre-processing of the images into an appropriate format. This pre-processing typically involves some form of image segmentation to identify image features/objects. Once identified these, features must be represented in some appropriate manner, usually as some form of feature vector, to allow the application of a desired data mining technique. In this paper we describe a segmentation process to support the classification of MRI data according to the nature of a particular feature contained within these images, namely the corpus callosum. The corpus callosum is a highly visible structure contained within MR images whose function is to connect the left hemisphere of the brain to the right hemisphere, and be responsible for communication between these two hemispheres. The corpus callosum is of particular interest to the medical profession in the context of neurological diseases and the study of brain function. An example MRI, featuring the corpus callosum, is given in Figure 1. Several medical studies indicate that the size and shape of the corpus callosum, in humans, are correlated to sex [1, 5, 14] , age [14, 16], brain growth and degeneration [7, 11], handedness [4] and various types of brain dysfunction [6, 9]. The specific application used to illustrate the segmentation mechanism described in this paper is the categorisation of the corpus callosum into one of two classes: (i) musicians and (ii) non-musicians. However, the prescribed classification can equally well be applied to other forms of image mining.
2
Methodology
To identify the corpus callosum structure a variation of the standard spectral segmentation image segmentation technique founded on the concept of an intensity interval, was developed. This the principal contribution of this paper and ∗ Correspondence
to Ashraf Elsayed, email:
[email protected]
Corpus Callosum
Fornix
Figure 1. Corpus callosum in a midsagittal brain MR image.
Brain MR Images
Feature Selection
Reduced feature vector
Segmentation
Frequent sub-graphs
Classification
Corpus Callosum segments
Graph Generation
Graph Mining Quadtrees
Decision Tree
Figure 2. Proposed methodology (directed arcs indicate data flow) described in detail in Section 4. To achieve the final classification, once the corpus callosum segments had been identified, a registration process was applied to the segmented images so that each identified corpus callosum segment was founded on the same origin. The pixel representations were then tessellated and stored in a quad-tree data structure (one tree per image). The advantage offered by this structure, unlike some other data representations, was that information concerning the spatial relationships between individual pixels was maintained. These trees (graphs) were then further processed so as to identify frequent sub-trees occurring across the image set. A weighted variation of the well known gSpan algorithm was used for this purpose [10]. The weightings were designed to reflect the structure of the quad-tree where by nodes nearer the root node are more significant (because they cover a greater area). The identified sub-trees (sub-graphs) then formed the elements of a feature space. Each image was represented, in a quantitative manner, in terms of this feature space, one feature vector per image. The set of feature vectors, generated in this manner, was then used as the final input to a classifier generator. A block diagram outlining the process is given in Figure 2.
3
Related Work
There is a large literature on segmentation and clustering with applications in many areas. In this section a class of segmentation methods based on finding minimum cuts in a graph is considered where the cut criterion is designed in order to minimize the similarity between pixels that are being split. Work by Wu and Leahy [17] introduced such a cut criterion, but it was biased toward finding small components. This bias was addressed with the normalized cut criterion developed by Shi and Malik [15], which takes into account the self-similarity of regions. The normalized cut criterion provides a significant advance over the previous work in [17]. However, the normalized cut criterion also yields an NP-hard computational problem. While Shi and Malik develop approximation methods for computing the minimum normalized cut. In practice these approximations are still fairly hard to compute, limiting the method to relatively small images or requiring computation times of several minutes. Cour and Shi (2005) [3] proposed a multiscale spectral image segmentation algorithm. This algorithm works on multiple scales of the image in parallel, without iteration, to capture both coarse and fine level details. A Normalized Cut graph partitioning framework of image segmentation is used. Cour and Shi demonstrate that large image graphs can be compressed into multiple scales capturing image structure at increasingly large neighborhood. Their segmentation algorithm works simultaneously across the graph scales, with an inter-scale constraint to ensure communication and consistency between the segmentations at each scale. There is also a substantial body of work directed at the mining of MR images. For example Chen and Herskovits [2] present a Bayesian-network for joint classification founded on voxelwise magnetic-resonance image analysis. Another example is the work of Ruan et al. [13] who presents a fully automatic three-dimensional classification of brain tissues for MR images. To the best knowledge of the authors there has been little work on the application of data mining techniques to study the corpus callosum. Two studies of note, in the context of the application domain considered here, are that of Herskovits and Gerring [8] and that of Machado et al. [12]. Herskovits and Gerring describe a Bayesian network approach to Lesion-Deficit Analysis (LDA) that identifies associations between elements of the brain including the corpus callosum. Machado et. al apply a visual data mining method MRI scan data to reveal differences in the callosal morphology between male and female samples.
4
Image Segmentation
For the purpose of identifying the corpus callosum a variation of the multi-scale spectral image segmentation algorithm by Cour and Shi (2005) was developped [3]. The algorithm has been shown to work well in many studies; however in the context of the research described here it was found not to work as well as expected. A variation of Cour and Shi’s algorithm was therefore developpeed that applied a threshold interval to the segmentation of objects with the same intensity values (such as the corpus callosum). This was found to give a much improved result. The variation of Cour and Shi’s algorithm was founded on the observation that the corpus callosum comprises white matter tissue (i.e. the pixel represented has high intensity values). Although one can visually recognize the outline of the corpus callosum portions of its boundary are often indistinct, particularly at the top portion of the corpus callosum, and between the corpus callosum and the Fornix (see Figure 1); this makes it difficult to apply automated segmentation algorithms that are founded on edge information alone. A further problem with applying segmentation (in this case) is that intensity variations within the corpus callosum can be comparable with, or exceed, the difference with the surrounding tissues.
Figure 3. Histogram of the pixel grayscale values of the corpus callosum.
Figure 4. Probability plot of the corpus callosum pixel values.
Figure 3 shows a pixel intensity value histogram of the corpus callosum derived from 30 selected MR images where the corpus callosum was very well defined and consequently easy to detect using Cour and Shi’s algorithm (256 gray levels were used). From the figure it can be seen that: • The corpus callosum tends to have relatively high intensity values, and • The distribution of intensity values seems to follow the normal distribution. The latter is demonstrated in Figure 4 which shows that the corpus callosum pixel values follow the normal distribution ¯ = 160 and standard deviation S = 20. Figure 5a shows that with a threshold interval of X ¯ ± S, the with mean X ¯ corpus callosum can barely be recognized. With a threshold interval X ± 2S a relatively distinct callosum shape is ¯ ± 3S, the evident with a few other non-adjacent structures as shown in Figure 5b. With a threshold interval of X corpus callosum is clearly defined, although more other non-adjacent structures are also visible (Figure 5c). In Figure ¯ ± 3S. 5d, the corpus callosum starts to be connected to surrounding tissues with a threshold interval wider than X Although the threshold values may be different depending on individual images, the high intensity property of the corpus callosum can be exploited to yield a segmentation algorithm that is both effective and efficient across the input ¯ ± 3S interval was chosen for application to the MRI set so as to exclude intensity values image set. Therefore the X outside the interval. This strategy was incorporated into Cour and Shi’s algorithm and used to more successfully extract the corpus callosum (and other incidental objects with the same intensity values). Figure 6 gives a comparison between Cour and Shi’s original algorithm and the enhanced spectral segmentation with multi-scale graph decomposition algorithm. From the figure it can be seen that the proposed algorithm gives better results than the original algorithm. Experiments based on visual inspection of the results by domain experts confirmed that, out of a given corpus of 106 images, the proposed algorithm was able to depict the corpus callosum with a high level of accuracy.
Figure 5. Thresholding with various threshold intervals.
Figure 6. The results obtained by the spectral multiscale segmentation algorithm and the proposed algorithm.
5
Experimentation and Evaluation
The authors carried out a number of experiments to verify the performance of the proposed segmentation algorithm (and associated classification methodology) in terms of classification accuracy. A data set of brain MRI scans was obtained from School of Health Sciences at the University of Liverpool in the UK. The data set comprised 106 brain MRI scans divided equally into two categories (53 images per category): musician and non-musician. Each image was translated, using the new segmentation method, to produce the desired feature vectors to which a decision tree classifier was applied. Note that he maximum number of leaf nodes in any quad-tree is given by 4N where N is the quad-tree level, and that the level of detail increases with the number of quad-tree levels. The quad-tree levels used in the experiments reported below were 4, 5, 6 and 7 (equating to a maximum number of nodes of 256, 1024, 4096 and 16384 respectively). Table 1 shows the classification and standard deviation results obtained using Ten Cross Validation (TCV) with different quad-tree levels of 4, 5, 6 and 7. In the Table the support threshold (used by the weighted gSpan algorithm) is the minimum frequency with which a sub-graph must occur across the data set for the sub-graph to be considered ”frequent”. From Table 1 it can be seen that the best classification accuracy of 95.28% (19 correct classifications per 20 images) was obtained using a quad-tree level of 6 (maximum number of nodes of 4096) coupled with a 30% threshold support. Regardless of the quad-tree level, the classification accuracy improved as the threshold support decreased. This is to be expected as this will result in the identification of a greater number of frequent sub-graphs (i.e. as the support threshold increases many significant sub-graphs will not be identified). From the Table it can also be observed that accuracy increases as the quad-tree levels are increased, up to level 6, and the begins to fall of. It is conjectured that this is because “over fitting” starts to take place as the quad-tree representation starts to get too detailed.
Table 1. Classification accuracy and standard deviation for corpus callosum segments represented in different Quadtrees levels Support 4 Quadtree level 5 Quadtree level 6 Quadtree level 7 Quadtree level 20% 70.75±4.76 90.57±0.88 85.85±2.30 83.80±3.56 30% 69.81±3.06 83.96±3.23 95.28±1.95 85.85±1.26 40% 68.87±6.85 80.19±3.65 84.91±1.14 89.62±1.22 50% 71.7±3.89 85.85±2.12 83.96±2.43 86.79±3.13 60% 68.87±5.33 80.19±4.40 90.57±0.63 87.74±5.68 70% 61.32±5.49 81.13±3.10 83.96±2.90 75.47±6.10 80% 52.83±4.05 80.19±4.88 77.36±3.70 76.42±4.87 90% 50.94±3.98 70.75±5.79 75.47±4.90 78.30±2.25
6
Conclusions
In this paper an image segmentation technique, based on the idea of an intensity threshold interval, was introduced. The work was directed at a particular image segmentation application, classification of MR “brain scan” images according to the nature of the corpus callosum feature. However, it is suggested that the technique has more general application for image segmentation problems where the object to be identified has an identifiable intensity range. The results obtained are extremely encouraging and clearly demonstrate the utility of the approach. Planned future work includes the further evaluation of the segmentation process by considering additional corpus callosm classification applications such as the automated identification of disorders such as Epilepsy. The research team are also interested in alternative segmentation techniques for pre-processing MR image data, and mechanisms for the post-processing of results. In the context of the latter consideration is being directed at the generation of explanations to support the classification of “unseen” data (i.e. retracing of the classification result to the attributes in the segmentation that caused the classification).
References 1. Allen L, Richey M, Chain Y et al. Sex differences in the corpus callosum of the living human being. Journal of Neuroscience. 1991; 11: 933-942. 2. Chen R, Herskovits E. A Bayesian Network Classifier with Inverse Tree Structure for Voxelwise Magnetic Resonance Image Analysis. Proc ACM SIGKDD’05. 2005. p. 4-12. 3. Cour T, Benezit F, Shi J. Spectral Segmentation with Multiscale Graph Decomposition. In Proc. of the 2005 IEEE Computer Society Conference on Computer Vision and Pattern Recognition (Cvpr’05). 2005; 2: 1124-1131. 4. Cowell P, Kertesz A, Denenberg V. Multiple dimensions of handedness and the human corpus callosum. Neurology. 1993; 43: 2353-2357. 5. Davatzikos C, Vaillant M, Resnick S et al. A computerized approach for morphological analysis of the corpus callosum. Journal of Computer Assisted Tomography. 1996; 20: 88-97. 6. Duara R, Kushch A, Gross-Glenn K et al. Neuroanatomic differences between dyslexic and normal readers on magnetic resonance imaging scans. Archives of Neurology. 1991; 48: 410-416. 7. Hampel H, Teipel S, Alexander G et al. corpus callosum atrophy is a possible indicator of region and cell type-specific neuronal degeneration in Alzheimer disease. Archives of Neurology. 1998; 55: 193-198. 8. Herskovits EH, Gerring JP. Application of a data-mining method based on Bayesian networks to lesion-deficit analysis. Proc, Neuroimage. 2003. p. 1664-73. 9. Hynd, G, Hall J, Novey E et al. Dyslexia and corpus callosum morphology. Archives of Neurology. 1995; 52: 32-38. 10. Jiang C. , Coenen F. Graph-based Image Classification by Weighting Scheme. Proc. AI’2008, Springer. 2008; p. 63-76. 11. Lyoo I, Satlin A, Lee C et al. Regional atrophy of the corpus callosum in subjects with Alzheimer’s disease and multi-infarct dementia. Psychiatry Research. 1997; 74: 63-72. 12. Machado A, Gee J, Campos M. Visual data mining for modeling prior distributions in morphometry. Signal Processing Magazine, IEEE. 2004; 21(3): 20-27. 13. Ruan S, Jaggi C, Xue J et al. Brain Tissue Classification of Magnetic Resonance Images Using Partial Volume Modeling. IEEE Transactions on Medical Imaging. 2000; 19(12): 1179-1187. 14. Salat D, Ward A, Kaye J et al. Sex differences in the corpus callosum with aging. Journal of Neurobiology of Aging, 1997; 18: 191-197. 15. Shi J, Malik J. Normalized cuts and image segmentation. Proc. of the IEEE Conference on Computer Vision and Pattern Recognition. 1997. p. 731-737. 16. Weis S, Kimbacher M, Wenger E et al. Morphometric analysis of the corpus callosum using MRI: Correlation of measurements with aging in healthy individuals. American Journal of Neuroradiology. 1993; 14: 637-645. 17. Wu Z, Leahy R. An optimal graph theoretic approach to data clustering: Theory and its application to image segmentation. IEEE Transactions on Pattern Analysis and Machine Intelligence. 1993; 11: 1101-1113.