Soft Computing manuscript No. (will be inserted by the editor)
A Multiclassifier Approach for Topology-based WiFi Indoor Localization Krzysztof Trawi´ nski · Jose M. Alonso · Noelia Hern´ andez
Received: date / Accepted: date
Abstract People localization is required for many novel applications like for instance proactive care for the elders or people suffering degenerative dementia such as Alzheimer’s disease. This paper introduces a new system for people localization in indoor environments. It is based on a topology-based WiFi signal strength fingerprint approach. Accordingly, it is a robust, cheap, ubiquitous and non-intrusive system which does require neither the installation of extra hardware nor prior knowledge about the structure of the environment under consideration. The well-known curse of dimensionality critically emerges when dealing with complex environments. The localization task turns into a high dimensional classification task. Therefore, the core of the proposed framework is a fuzzy rule-based multiclassification system, using standard methodologies for the component classifier generation such as bagging and random subspace, along with fuzzy logic to deal with the huge uncertainty that is characteristic of WiFi signals. Achieved results in two real environments are encouraging, since they clearly overcome those ones provided by the well-known nearest neighbor fingerprint matching algorithm, which is usually considered as a baseline for WiFi localization.
Krzysztof Trawi´ nski and Jose M. Alonso European Centre for Soft Computing, 33600 Mieres, Asturias, Spain Tel.: +34-985-456545 Fax: +34-985-456699 E-mail: {krzysztof.trawinski,jose.alonso}@softcomputing.es Noelia Hern´ andez RobeSafe Research Group, Department of Electronics, University of Alcal´ a, 28871 Alcal´ a de Henares, Madrid, Spain Tel.: +34-91-8856566 Fax: +34-91-8856591 E-mail:
[email protected]
Keywords WiFi localization · Classifier ensembles · Bagging · Random subspace · Fuzzy rule-based multiclassification systems PACS 02.50.Tt · 07.05.Mh Mathematics Subject Classification (2000) 03B52 · 68T27 · 68T30 · 68T35 · 68T37 · 94D05
1 Introduction Recently, there has been a wide proliferation of smartphones. They can be seen as small computers equipped with GSM/UMTS, GPS, WiFi, blootooth, infrared, accelerometers, cameras, and so on [36]. As a result, everyday there are more and more novel applications which are able of exploiting successfully the localization capabilities of smartphones. Telecommunication companies are interested in providing personalized advertisements and/or context-aware information services. Thus, for instance once user location is discovered he/she can be guided towards the closest restaurant/shop which better fits his/her preferences. In addition, in the context of social networks, one user may be interested in receiving some kind of a notification when some friends were close to him/her. On the other hand, there are also challenging medical applications where people localization is required, such as proactive care of elders or disabled people. Of course, several ethical and controversial issues usually arise when dealing with localization applications, mainly regarding tasks related to tracking people [38]. Users want to receive useful information related to their current location but they also want to preserve their own privacy. Therefore, systems based on video cameras are usually rejected. All in all, localization sys-
2
tems are demanded to be non-intrusive, ubiquitous and cheap [20]. In the case of outdoor environments, there is a wide range of applications based on GPS [18]. Most of them are related to navigation assistance, e.g., an intelligent program is able to find out the optimal route (according to the user’s preferences) in a predefined map between the current location and the desired destination [11]. Unfortunately, GPS does not work properly in indoor environments where many interesting applications arise. Regarding indoor localization, there are lots of related proposals which are based on different technologies: infrared, computer vision, ultrasound, laser, radio frequency, cellular communication, etc. Anyway, the so-called signal strength approaches are very attractive because they can be applied to wireless networks without needing an additional specific hardware [17]. Moreover, WiFi localization systems arise as the most promising choice thanks to their quickly growing degree of the coverage. Nowadays, there are WiFi Access Points (APs) in most of the public buildings like hospitals, libraries, universities, museums, etc. In addition, measuring the WiFi signal strength level (without transmitting-receiving any data) is free of charge even for private WiFi networks. In fact, some works have already presented experiments showing the suitablity of combining both GPS (outdoor environments) and WiFi (indoor environments) with the aim of designing global and ubiquitous localization systems [19]. This work focuses on people localization in indoor environments. That is the reason why we have opted for a topology-based localization system. Actually, we have enhanced the framework for WiFi localization sketched in [31]. It was firstly introduced in [2] and then successfully integrated in the people positioning module presented in [3]. Such a system is based on fingerprinting, i.e., matching the current signal strength measures with those ones previously stored into a database that represents a WiFi map of the experimental environment. Then, the database is split into training and test datasets. They are used to generate and validate an intelligent classifier able to estimate the closest reference location (one out of the predefined set of significant locations considered when building the WiFi map) to the actual user location according to the measured signal strength. Notice that, the main novelty of this work comes from the fact that the new system is implemented in the form of a multiclassification system (MCS) instead of adopting a single-classifier strategy like we had considered in our previous works, with the aim of producing a system as accurate as possible. Furthermore, the proposal has been tested and validated into two differ-
Krzysztof Trawi´ nski et al.
ent real-world environments: (1) A small trial scenario considering only one corridor at the European Centre for Soft Computing (ECSC) premises; and (2) a much more complex scenario considering the second and the third floors of the Polytechnic School at the University of Alcal´a (UAH). The rest of the manuscript is organized as follows. The next section gives an overview on some preliminary works, regarding both WiFi localization systems and MCSs. Then, Section 3 describes thoroughly the new proposed MCS-based WiFi indoor localization system. Section 4 presents the experimental framework along with a detailed analysis of the achieved results. Finally, Section 5 highlights the main conclusions but also points out some challenging future works. 2 Preliminaries 2.1 WiFi Localization and Soft Computing WiFi localization systems make use of 802.11b/g network infrastructure to estimate the position of a receiver. Thus, the location of a person can be discovered by pointing out the estimated location of one of its electronic devices, for instance a smartphone equipped with a WiFi interface. WiFi technology works at 2.4 GHz, which is close to the water resonant frequency, therefore the received signal strength (RSS) from each AP visible in the surrounding environment directly depends on the distance between the emitter and the receiver, but it also depends on the presence of obstacles and/or people placed between them. Notice that, human body absorbs part of the electromagnetic waves it is exposed to [5]. Thus, people may become a non-negligible source of interference, dimming RSS. RSS is affected by many variations, namely temporal, small-scale and large-scale variations [47]. They introduce a lot of uncertainty in the system that is difficult to deal with. For instance, small-scale variations take place when one electronic device equipped with WiFi moves in a small distance (under the wavelength λ = 12.5 cm). In such circumstances, RSS can strongly vary up to 10 dBm what would be equivalent to move around 6 meters in the context of large-scale variations [1]. As a result, it is not straightforward to estimate the correct device location. Uncertainty must be properly handled in order to determine if the observed changes in RSS are due to small-scale variations (only a few centimeters away) or they are due to large-scale variations (a few meters away). WiFi localization systems exploit the path loss propagation model due to large-scale variations of WiFi sig-
A Multiclassifier Approach for Topology-based WiFi Indoor Localization
nal to determine how close the receiver is to a certain AP. Unfortunately, in indoor environments, RSS is also strongly affected by reflection, refraction and diffraction, what is commonly known as the multipath effect [17]. As a result, RSS becomes a complex function of the distance that dynamically changes with time. Therefore, formalizing propagation models adapted to the specific characteristics of each indoor environment, in each time instant, is not reliable. Soft Computing is usually defined as a family of techniques (Fuzzy Logic, Neuro-computing, Probabilistic Reasoning, Evolutionary Computation, and their hybridizations), well suited for coping with imprecision and uncertainty [30]. Thus, an extensive research has been done on wireless localization based on Soft Computing techniques over the last decade. For instance, Soft Computing techniques are able to deal properly with small-scale variations in wireless sensors [1]. Yun et al. [48] proposed a Soft Computing based localization system for outdoor environments. To start with, they generated a genetic fuzzy system for individual localization where the edge weights of each anchor node were firstly modeled by a fuzzy system and then optimized by a genetic algorithm. Later, they generated a neural network for overall localization. Achieved results were promising and they proved the suitability of considering Soft Computing approaches to deal with the wireless localization. Nerguizian et al. proposed the use of neural networks and fingerprinting to deal with the well-known multipath effect in indoor environments [32]. They addressed mobile robot location based on a distance-based (also known as metric or Cartesian) approach, which is normally adopted in Robotics where localization is made in a low abstraction level with the aim of estimating X-Y coordinates. The network learning was done off-line but it could become computational costly (and even unfeasible) for very large environments. More recently, Outemzabet et al. presented an alternative location system also based on neural networks and fingerprinting. The main novelty arose from the fact that the estimated X-Y position was enhanced first with Kalman filtering [34] and later with particle filtering and a lowcost sensor [35]. Dharne et al. advocated for the use of fuzzy logic [15]. They proposed a fuzzy rule-based system able to yield good results thanks to the use of a grid-based map describing the environment under consideration. Moreover, they reduced the computational cost by taking into account only significant grid-points. Hence, they followed a topology-based approach instead of a distance-based one. Topology-based systems carry out a more human friendly symbolic localization, which is made
3
in a higher abstraction level. Their goal is not to find out the exact X-Y coordinates but to give an approximate position (e.g., at the room level) with a high confidence. This approach is preferred when dealing with most applications supported by people localization. Notice that, fuzzy logic is especially useful to handle problems where the available information is vague, which is the typical situation when working with WiFi signal strength sensors [4]. Fuzzy systems have proved to be effective for topology-based WiFi indoor localization in the context of people localization in ambient intelligent environments [20] but also in the context of Robotics [22]. Finally, topology-based indoor localization has already been addressed as a classification problem through Soft Computing techniques [1], however a need for improving the accuracy (while maintaining a low execution time) in this kind of applications requires an advanced tool being able to cope with these challenges. Thus, in the current contribution, the MCS approach, which is a well known to obtain high performance (better than a single classifier) [28], will be applied. Up to our knowledge, no work has been done related to MCSs in the context of topology-based WiFi fingerprint indoor localization. Notice that, the well-known curse of dimensionality critically emerges when dealing with complex real-world environments. In consequence, the localization problem turns into a high dimensional classification task. Such kind of problem only can be addressed effectively through an MCS approach. 2.2 Multiclassification systems In the last decade, MCSs, also called multiclassifiers or classifier ensembles, have arisen as very powerful tools when dealing with complex, high dimensional classification problems, because they are able to yield higher performance than any of their single classifiers [28]. As a result, this research topic has become especially active inside the machine learning community in general, and the Soft Computing community in particular, considering decision trees (machine learning) or neural networks (Soft Computing) to generate the component classifiers. The interested reader is referred to [7,33] where he/she can find two surveys for the case of decision trees (both) and neural network ensembles (the latter), including exhaustive experimental studies. More recently, some works have also considered the use of fuzzy classifiers (Soft Computing) [8,42]. An individual classifier must provide different patterns of generalization in order to obtain a diverse set of classifiers composing a highly accurate ensemble [28]. Otherwise, the ensemble would be composed of the same
4
(or similar classifiers) and it would be only as accurate as the best single classifier. Thus, generating diverse component classifiers is fundamental to obtain highly accurate MCSs [43]. There are different ways to face the design of classifier ensembles. On the one hand, there is a classical group of approaches considering data resampling with the aim of generating different training sets to derive each individual classifier. Firstly, in the bagging approach [9], the base classifiers are independently learnt from previously resampled training sets (“bags”), which are randomly selected with replacement from the original training data set. Secondly, boosting methods [41] sequentially generate the individual classifiers (weak learners) by selecting the training set for each of them based on the performance of the previous classifier(s) in the series. Opposed to bagging, this resampling process gives a higher selection probability to the incorrectly predicted examples by the previous classifiers. On the other hand, a second group is comprised by a more diverse set of approaches which induct the individual classifier diversity through some alternative ways, different from resampling [49]. Feature selection plays a key role in many of them where each classifier is derived by considering different subsets of the original features [43]. random subspace [23], where each feature subset is randomly generated, is likely to be the most representative method of this kind. Interestingly, it turns out that a combination between bagging and feature selection yields a generic approach well suited for designing robust and accurate MCSs, no matter the chosen classifier learning method [37]. We have already tested the combination of bagging and feature selection in the form of fuzzy MCS composition designs [42]. All in all, we drew the conclusion that bagging combined with a base homogeneous fuzzy classifier, which directly incorporated the feature selection ability, was a very powerful tool for dealing with high dimensional classification problems. 3 An MCS-based Framework for Scalable WiFi Indoor Localization This section details the proposed framework for topologybased indoor localization. The main goal of this work is to obtain a scalable and accurate localization system, which can estimate the closest reference location to the actual user location using RSS in a relatively short time. Our proposal is based on an MCS approach. Two different methodologies, bagging [9] and bagging combined with random subspace [37], are exploited to design the final MCS-based localization system. First, the base classifiers are learnt off-line from a fingerprint database
Krzysztof Trawi´ nski et al.
previously generated, and then the MCS-based framework is run on-line.
3.1 The base classifers Two types of base classifiers are considered in order to derive the component classifiers: (1) A simple decision tree, J48G [44]; and (2) a more advanced soft computing algorithm called Fuzzy Unordered Rule Induction Algorithm (FURIA) [24]. 3.1.1 J48G J48G is a version of the well-known standard C4.5 (called J48 in Weka1 [45]) decision tree, extended by means of grafting. As explained in [44], grafting is a postprocessing algorithm applied to an already generated decision tree, which aims at reducing prediction error. It starts with looking for those regions in the feature space which are either empty or they only include misclassified examples. Then, grafting searches for an alternative branch (e.g. generated from the ancestor to the leaf related to the identified region), which is added to the current tree, only in the case that its support for classification of that region is stronger than the already generated one by the initial decision tree generation method. In particular, J48G considers grafting based on alltests-but-one-partition (ATBOP), a metric to estimate the accuracy of a potential new leaf, initially proposed by Quinlan [39]. This algorithm assigns one set of training data only to each leaf of the initial decision tree (the set of examples that fails no more than one test on the path to the leaf). Thanks to grafting based on ATBOP, J48G is able to reduce the tree complexity, thus speeding up the induction process while also increasing accuracy. The interested reader is kindly referred to [44] for a full description of J48G. 3.1.2 FURIA FURIA [24] is an extended and enhanced version of the state-of-the-art rule learning algorithm called RIPPER [12], keeping its main advantages such as simplicity and comprehensibility but also introducing new features. We would like to highlight three main extensions of RIPPER provided by FURIA: 1
We use the implementation of J48G provided by Weka, a software tool for data mining which is freely available at [http://www.cs.waikato.ac.nz/ml/weka/]
A Multiclassifier Approach for Topology-based WiFi Indoor Localization
1. It defines fuzzy rules instead of crisp ones. The final form of a rule Rj is the following: Rj : If x1 is Aj1 AND . . . AND xn is Ajn Then Class is Cj with CDj , j = 1, 2, . . . , c c is the number of classes. The consequent part points out a class Cj along with its related certainty degree CDj . Given an example x = {x1 , . . . , xn }, the certainty degree is defined as follows: C
2 CDj =
DT j DT
P C + x∈DCj µr j (x) T P C 2 + x∈DT µr j (x)
(1)
C
where DT and DT j stand for the training set and a subset of the training set related to the class Cj respectively. In this approach, each fuzzy rule makes a vote for its consequent class. The vote strength of a rule is calculated as the product of its firing deC gree µr j (x) and its certainty degree CDj . Hence, the fuzzy reasoning method used is the so-called voting-based method [13]. 2. It uses unordered rule sets instead of rule lists. This change omits a bias caused by the default class rule, which is applied whenever there is an uncovered example detected. Unfortunately, the unordered rule set introduces one crucial drawback too, there might appear some cases when given examples are not covered. 3. It proposes a novel rule stretching method in order to manage uncovered examples. To deal with such undesired situations, each rule can be dynamically generalized by removing some of its antecedents. The information measure is proposed to find out which rule to “stretch” for each specific case. Let us emphasize that FURIA inherits an internal feature selection algorithm from RIPPER. This characteristic in combination with the “soft boundaries” provided by fuzzy rules makes FURIA well-endowed with the ability to deal with noisy, complex, and non-linear high dimensional classification problems. The interested reader is kindly referred to [24] for a full description of FURIA.
3.2 The MCS design approach In this work we will consider two standard MCS methodologies: bagging [9] and a combination of bagging with random subspace [23], as proposed in [37] (both methodologies were already used in [42], as well as random subspace only, however the latter did not bring any performance improvement).
5
The term bagging is an acronym of bootstrap aggregation and refers to the first successful method proposed to generate MCSs [9]. This approach was originally designed for decision tree-based classifiers. However, it represents a very generic approach (its applicability fits to any type of base model either for classification or regression problems). The core of bagging is based on bootstrap and consists of reducing the variance of the classification by averaging many classifiers that have individually been tuned to random samples that follow the sample distribution of the training set. Then, the final output of the model is the most frequent value, called voting, of the learners considered. As a result, bagging is the most effective approach when dealing with unstable classifiers, which means a small change in the training set can cause a significant change in the final model. Furthermore, bagging provides another main advantage, namely it makes feasible parallel and independent learning of the classifiers among the ensemble. In consequence, it is time efficient (due to its inherent parallelism) and quite accurate [42]. In this contribution, the bags are generated with the same size as the original training set, as commonly done. As said before, random subspace [23] is a generic methodology to induce diversity in the generation of the base classifiers. In this approach, a set of features is randomly selected from the original dataset. It is also a well-known approach in the multiclassifiers research field for feature selection [8,10,16]. Additionally, in [37] it was shown that the combination between bagging and random subspace results in a general design procedure, usually leading to good MCS designs (regardless the classifier structure considered). A flow of our design is as follows. The training set is submitted to an instance selection procedure, and (optionally) to a feature selection procedure, in order to provide individual training sets (bags) to train the base classifiers (in off-line mode). The combination of classifier members within the ensemble (on-line mode), is made by the so-called classifier fusion method [46], which aggregates the results provided by the set of component classifiers to calculate the final output, assuming that all classifiers are trained over the entire feature space. The Decision Profile (DP) represents the outputs of all the classifiers in the ensemble [26,29]: d1,1 (x) · · · d1,c (x) D1 (x) .. DP (x) = ... = ... . dL,1 (x) · · · dL,c (x) DL (x)
(2)
where c is the number of classes; L is the number of classifiers; and di,j (x) are the confidence degrees for
6
Krzysztof Trawi´ nski et al.
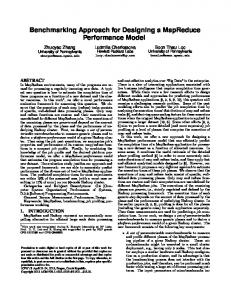
Fig. 1 The proposed framework to tackle with noisy WiFi signals.
the classes given an example x. Considering L classifiers, the combined output is usually computed by an algebraic function [25,27] such as maximum, minimum, product, mean, median, etc.
3.3 The proposal of an MCS-based framework to deal with noisy WiFi signals To deal with the inherent noise that characterizes the WiFi signal in indoor environments, we propose an elaborated framework encapsulating an MCS in order to improve the robustness of the whole system. Fig. 1 depicts a global schema of the proposed framework, which is made up of the three following phases: – Phase1 - Classification process of each classifier component. In this phase the classification task of each MCS components is carried out. Each classifier for each instance from 1 to N outputs confidence degrees dm ij for each class. Thus, the N matrices, namely DP s, are generated to be provided as the input required for the Phase 2. – Phase2 - Filtering (Aggregation 1).
The filtering phase takes place at the classifier output level. The confidence degrees dm ij of N instances are aggregated for each classifier d∗ij . The aggregation is done by means of one of the (algebraic) functions mentioned in Sec. 3.2. Then, the aggregated DP of the MCS is provided as an output. Notice that, the filtering follows the “moving average” fashion, in every step DP of the next example ′ is included (xN +1 in the example from Fig. 1) in the aggregation of DP s, while excluding the first ′ DP appeared in the given period of time (x1 in the example from Fig. 1). – Phase3 - Classifier fusion (Aggregation 2). In the last phase, a second aggregation is performed. The aggregated DP is combined by means of one of the abovementioned algebraic functions (mean, median, etc.). As a result, the outputs of all the individual classifiers d∗ij are merged into one final decision c′ . It is worth noting that, the framework described above is only applicable for the on-line execution mode of our WiFi location system, while the core of the MCS is trained in an off-line mode, starting from a fingerprint database previously generated. Of course, the off-line learning process is not included in the figure.
A Multiclassifier Approach for Topology-based WiFi Indoor Localization
4 Experimentation 4.1 Experimental setup In this contribution we present results achieved in two different real-world experimental environments. In the first experiment, just for illustrative purposes, data were gathered in a simple scenario considering only one corridor of the ECSC premises, where all analyzed locations are placed in a straight line. In the second scenario, which is much more realistic and hence complicated, data were gathered in the second and third floors of the Polytechnic School at the UAH. In both cases, experimental data were gathered under usual working conditions. 4.1.1 Scenario 1 - a simple but highly illustrative case The first experimental environment is shown in Fig. 2. It consists of an indoor corridor, about 35 meters long, where 13 different positions (Pi), in the distance of 2 meters each, were identified with the aim of being properly recognized by the proposed localization system. The signal strength from 4 APs were measured at each position. These APs were chosen due to their visibility in the entire test-bed environment, exhibiting good patterns of the signal transmission. Although their exact locations are not known, their approximate positions are plotted in the figure.
Fig. 2 ECSC test-bed environment (Scenario 1). Four APs and thirteen positions, Pi, (separated by 2m distance) in a straight line.
Data acquisition was made as follows. At each position, Pi, 600 samples of the signal level from each AP were measured and saved in a file. This process was carried out during five different days at different hours. Thus, we obtained a dataset containing 39000 signal samples. Notice that, since we considered only 13 different positions placed in the same part of the building, namely a corridor, it was feasible to obtain so many
7
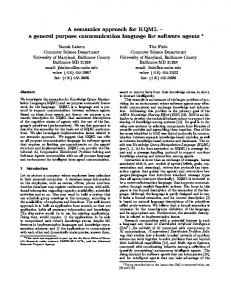
samples per position. Considering the WiFi localization task as a classification problem, we built a dataset containing 39000 instances with 4 features. Each set of RSS coming at once from all visible APs corresponds to an instance, whereas the signal from each AP defines a feature of that instance. The data distribution along the five days for each position and for each AP is shown in Fig. 3. It is represented in the form of boxplots. It can be easily observed how the signal obtained varies for each AP differently, when changing the position. For instance, in positions P1 and P2 the highest power level corresponds to AP1, but in positions P12 and P13 the highest level comes from AP4, due to its proximity. Unfortunately, the variation of RSS is not lineal with physical distance. Furthermore, in this work, we take an advantage of the time-dependent characteristics of the data, namely the signals of APs are obtained in a consecutive order for each location. In our scenario, the user stops for a few seconds to acquire several consecutive WiFi measures with the aim of getting better estimation of its current position. In order to avoid any loss or distortion of the data, for the identification of a given position we consider a consecutive block of samples of size 300 (half of measured samples of each Pi during each day). Thus, we have defined a special kind of cross validation inspired by the Diettrich’s cross-validation [16] with the aim of considering the time-dependent characteristics of the data. The measurements for each location and for each experimentation day were divided into 2 blocks of 300 subsequent samples. As we collected data among 5 different days, we got 10 blocks for each location. Blocks for each day are uniformly assigned to the training and test sets in a way that always one block from a given day is assigned to training set as well as to test set. It results with 32 different combinations of the blocks, which can be seen as a particular adaptation of the 16x2 cross-validation. The averaged results are reported. 4.1.2 Scenario 2 - a realistic high dimensional case The second experiment was carried out in the second and the third floors on the west sector of the Polytechnic School at the UAH (see Fig. 4). The experimental environment covers a total surface of 2400m2 with over 100 APs. We have considered 71 significant positions (30 in the third floor and 41 in the second floor), each placed several meters (between 2.5 and 9.5 meters) apart from the nearest neighbor position to be recognized. It is important to remark that contrary to the case of the previous scenario where a few APs were selected for
8
Krzysztof Trawi´ nski et al.
AP2 −30
−40
−40
−50
−50 dBm
dBm
AP1 −30
−60
−60
−70
−70
−80
−80
−90
1
2
3
4
5
6
7 8 Position
9
10
11
12
−90
13
1
2
3
4
5
6
(a)
−40
−40
−50
−50
−60
−70
−80
−80
3
4
5
6
7 8 Position
11
12
13
9
10
11
12
13
−60
−70
2
10
AP4 −30
dBm
dBm
AP3
1
9
(b)
−30
−90
7 8 Position
9
10
11
12
13
(c)
−90
1
2
3
4
5
6
7 8 Position
(d)
Fig. 3 Data distribution (five different days) for all positions and access points: (a) AP1; (b) AP2; (c) AP3; (d) AP4.
localization purposes, in the second scenario over onehundred APs were actually deployed with the aim of providing a good Internet access to the largest number of students. Notice that, data coming from all detected wireless devices were considered as APs by our localization system, with no prior knowledge about neither their relevance (they may be just a laptop or smartphone instead of a real AP) nor their physical location. This is a very important issue, since data acquisition is very quick but the number of APs is huge and it may differ among the days of the data acquisition. Moreover, no data pre-processing is required, the off-line learning stage is in charge of discovering the most significant APs for localization purposes. Data acquisition for training and test was made in two independent weeks. In fact, collecting data for all
the 71 positions was made in discontinuous periods of time, at different hours, all along each week considering both mornings and afternoons. At each position, Pi, 60 samples of the signal level from each visible AP were measured and saved in a file. Thus, we built two datasets (one per week) containing 4260 signal samples each. During the first week we detected 143 different APs, while in the second week there were only 134 APs. Of course, during the test stage only those APs that were also visible in the training stage are taken into account. Again, like in the case of Scenario 1, the WiFi localization task is addressed as a classification problem. Thus, we built a dataset containing 8520 instances (all sets of RSS coming at once from all visible APs) with 143 (134 in the case of looking at the second experimental week) features (all visible APs).
A Multiclassifier Approach for Topology-based WiFi Indoor Localization
(a) Second floor
9
(b) Third floor
Fig. 4 UAH test-bed environment (Scenario 2). One-hundred APs (which actual location is unknown) and seventy-one different positions (represented by circles): 30 positions in the second floor (a) and 41 positions in the third floor (b).
In a first experiment, the entire dataset obtained from the first week was taken as a training set, while the entire dataset obtained during the second week was considered as a test set. Then, we inverted the procedure, the dataset related to the second week was assigned to a training set and the dataset corresponding to the first week was taken as a test set. Due to the large instability of the random subspace algorithm, we repeat the whole procedure 10 times with different seeds (20 in total). Of course, average of both is reported as the final result.
Notice that, due to the large number of positions analyzed in the different floors of UAH, obtaining such a huge number of data samples like in the previous scenario was not feasible because it would have become very costly and time consuming, thus we opted for reducing the number of collected instances from 600 to 60 at each position. As a result, the total number of instances drops from 39000 to 8520. However, the complexity, and scalability, of the new scenario increases significantly in terms of the number of positions (from 13 to 71) and the number of APs (from 4 to over 100), yielding a much more difficult high dimensional classification problem.
4.2 Analysis of the Results In our framework, the localization problem is defined in terms of a classification problem with: – 4 features considering the 4 visible APs and 13 classes (one per position to be identified) for the first scenario. – 143 (134 in the case of looking at the second experimental week) features considering all visible APs and 71 classes (one per position to be identified) for Scenario 2. Our design (J48G MCSs, FURIA MCSs) is composed of 10 classifiers (because in some preliminary trials on Scenario 1, we observed that considering a larger number of classifiers was not yielding a significant increase of accuracy for the analyzed problem), while random subspace (RS) selects a subset of features containing 25%, 50%, or 75% of the initial feature set. It is compared with the state-of-the-art classification technique k-Nearest Neighbor (k-NN) [14]. For each test sample, k-NN algorithm calculates the Euclidean distances between it and every training sample in the database. Then, it ranks them and takes the k smallest ones. A majority vote between selected samples decides which class the test sample belongs to. We have chosen the standard value k = 1, as it is done in [19]. Notice that,
10
1-NN is usually considered as base line for comparisons since the Bahl’s pioneer paper [6] where a WiFi localization system based on the use of the Nearest Neighbor algorithm with fingerprinting (a priori radio map) was first proposed. Such a system comprised the same two main stages, namely off-line and on-line stages, as in our proposal. The main difference comes up with the fact that our off-line stage includes not only the generation of the fingerprint database (what was called training stage by Bahl) but also the learning of classifier models. Of course, in the case of 1-NN there is not any explicit classifier model. On the contrary, each new WiFi measure is directly compared against the previously stored radio map in order to determine the right location during the estimation stage. In addition, we chose mean as the most common aggregation method in both stages (Aggr1 and Aggr2). Notice that the second aggregation stage (Aggr2) only takes place in the case of the designed MCSs, where the 10 individual classifier outputs are fused. The final decision is done using the maximum activation degree. Notice that, with the structure of basic k-NN method Aggr2 makes no sense. Several values of the block size N were selected, i.e. 1, 4, 7, and 10 corresponding to around 1, 4, 7, and 10 seconds respectively because our WiFi acquisition frequency was 1Hz. It is worth mentioning that time is strongly affected by the number of WiFi measures used for a single evaluation, since the time for collecting data samples (in the range of seconds) is much longer than the time required for inferring the current position (in the range of milliseconds).
4.2.1 Results in a simple case (Scenario 1) In this section we analyze the results obtained for the first scenario. The goal is to check the proposed framework in the context of a rather simple case as the one defined in the selected corridor of the ECSC premises. Table 1 reports the achieved results in terms of accuracy for all the selected block sizes. The first column presents all the algorithms used, namely 1-NN, J48G, FURIA and several variants of J48G MCSs as well as FURIA MCSs. These variants include bagging (Bag), bagging and RS with 25% (Bag + RS (25%)), bagging and RS with 50% (Bag + RS (50%)), and bagging and RS with 75% (Bag + RS (75%)). In total, 11 algorithms are evaluated in the experiments. The next four columns present accuracy results obtained for block size equal to 1 (N1), 4 (N4), 7 (N7), and 10 (N10) respectively. The best result for each given N i is highlighted in bold font.
Krzysztof Trawi´ nski et al. Table 1 Accuracy results for different classification and aggregation methods in Scenario 1 (ECSC environment). Algorithm 1-NN J48G FURIA Bag Bag + J48G MCSs Bag + Bag + Bag Bag + FURIA MCSs Bag + Bag +
RS (75%) RS (50%) RS (25%) RS (75%) RS (50%) RS (25%)
N1 N4 N7 N10 0.893 0.915 0.929 0.936 0.836 0.882 0.908 0.923 0.758 0.791 0.820 0.846 0.863 0.916 0.932 0.940 0.838 0.898 0.919 0.931 0.762 0.832 0.860 0.877 0.630 0.692 0.725 0.749 0.814 0.868 0.894 0.912 0.744 0.799 0.825 0.844 0.645 0.695 0.718 0.734 0.494 0.530 0.549 0.561
In the light of this table, it can be noticed that “J48G MCS Bag” (N10) outperforms the other approaches in overall (0.940). However, “FURIA MCS Bag” (N10) as well as 1-NN (N10) are able to produce very good results too, 0.912 and 0.936 respectively. As expected, most of the evaluated algorithms were able to achieve very high accuracy (over 84% in 8 out of 11 algorithms, regarding N10). Notice that 1-NN outperforms both single classifiers, J48G as well as FURIA, no matter the selected block size (Ni). There are some additional interesting issues to be remarked: – Both J48G MCSs and (especially) FURIA MCSs get more instable when combined with Bag + RS than with Bag only. “FURIA MCSs Bag + RS (25%)” obtains the worst result (0.494) for N1. – MCSs obtain better accuracy results, when increasing the number of features selected by RS (look at the percentage in brackets). – Considering the block size parameter (N i), it seems to be somehow correlated with the accuracy. The larger the block size is, the higher accuracy is obtained. Obviously, feature selection has a negative impact in the results reported for this scenario where the whole training dataset only includes four features. Hence, considering a subset of features is useless in the case of dealing with simple test-bed environments. Unfortunately, considering different combinations of parameters, it is hard to point out a single one. Even though “J48G MCSs Bag” seems to be the best algorithm in many cases, all results are so similar that we cannot draw significant conclusions. Anyway, we can appreciate how the proposed framework achieves very good results no matter the selected classification method. This fact is due to the inherent simplicity of the analyzed scenario. With the aim of making a deeper analysis regarding the behavior of the classifiers used, in addition to the
A Multiclassifier Approach for Topology-based WiFi Indoor Localization
11
1−NN 1−NN J48G J48G FURIA
FURIA
J48G MCSs Bag
J48G MCSs Bag
J48G MCSs Bag + RS (75%)
J48G MCSs Bag + RS (75%)
J48G MCSs Bag + RS (50%)
J48G MCSs Bag + RS (50%) J48G MCSs Bag + RS (25%)
J48G MCSs Bag + RS (25%)
FURIA MCSs Bag
FURIA MCSs Bag
FURIA MCSs Bag + RS (75%)
FURIA MCSs Bag + RS (75%)
FURIA MCSs Bag + RS (50%)
FURIA MCSs Bag + RS (50%)
FURIA MCSs Bag + RS (25%)
FURIA MCSs Bag + RS (25%)
5
10
15
20
2
4
meters
(a) Block size N10
6
8
10
12
14
16
meters
(b) Block size N10 (zoomed)
Fig. 5 Reported results (considering block size N10) in terms of error distances (in meters), paying attention to the misclassified positions in Scenario 1 (ECSC test-bed environment).
classification accuracy, the distance between the real position and the estimated one, which is also an important issue in the WiFi localization application, is calculated (only when misclassification takes place). The dispersion of these results for each algorithm used is shown in Fig. 5 by means of boxplots (the possible outliers are represented by circles). On the right side (Fig. 5 (b)) a zoom of the boxplots from the left side (Fig. 5 (a)) is presented. In the view of this figure, it can be noticed that the median for all the algorithms is the same (4 meters). Furthermore, 1-NN, J48G, and “J48G MCSs Bag” seem to be providing the lowest error distances, however “J48G MCSs Bag” yields the outliers with the smallest distance value out of the three approaches. On the other hand, “FURIA MCSs Bag + RS (25%)” provides the worst results, since it obtains the high value of the upper quartile (8 meters) and the farthest outliers (up to 24 meters). Anyway, trying to have a fair global view, both Table 1 and Fig. 5 should be considered together. Unfortunately, although it seems that “J48G MCSs Bag” is the algorithm worth pointing, since it outperforms all the others taking into account both accuracy and error distance distribution, still clear and sound conclusions cannot be drawn. This is due to the simplicity of this
first illustrative scenario where all algorithms (even the basic 1-NN) provide really good results. Finally, Table 2 reports the average on-line evaluation time obtained for the entire test set by the algorithms considered (corresponding to the execution of the schema detailed in Fig. 1). It is constructed in the same fashion as the previous table. The first column presents all the algorithms evaluated, while the next four columns present the reported execution time for each block size (Ni).
Table 2 Execution time (measured in seconds) for different classification and aggregation methods during the on-line stage in Scenario 1 (ECSC test-bed environment). Algorithm 1-NN J48G FURIA Bag Bag + J48G MCSs Bag + Bag + Bag Bag + FURIA MCSs Bag + Bag +
RS (75%) RS (50%) RS (25%) RS (75%) RS (50%) RS (25%)
N1 N4 N7 N10 15.650 15.806 16.437 14.944 0.311 0.326 0.326 0.332 0.938 1.123 1.082 0.929 2.268 2.304 2.329 2.290 2.321 2.210 2.251 2.310 2.142 2.212 2.219 2.248 2.955 2.301 2.348 2.407 2.780 3.550 3.736 3.311 2.868 3.597 3.759 3.322 2.943 3.660 3.776 3.337 2.876 3.653 3.808 3.370
12
Krzysztof Trawi´ nski et al.
Regarding this table, it can be noticed that all types of MCSs reported quite similar and small on-line evaluation time. In contrast, in the case of 1-NN the online evaluation time is roughly 7 times longer than the MCS-based methods. We have also included J48G and FURIA just for comparison purpose. As expected, they achieve the shortest execution times. Notice that, the reported time refers to the total computational time, because in the case of 1-NN there is no learning stage, i.e., classification is carried out on the fly without an explicit model previously generated. Of course, a localization system requires high accuracy, however it also requires a low online execution time to provide the user a quick response and this is the main drawback of 1-NN. 4.2.2 Results in a realistic case (Scenario 2) This section presents the results obtained for the second scenario. It represents a much more complex (and realistic) case. It actually becomes a quite hard classification problem. This state is confirmed in Table 3, which is built in the same way as Table 1. It summarizes the achieved results in terms of accuracy. The best result for each given N i is highlighted in bold font. Table 3 Accuracy results for different classification and aggregation methods in Scenario 2 (UAH environment). Algorithm 1-NN J48G FURIA Bag Bag + J48G MCSs Bag + Bag + Bag Bag + FURIA MCSs Bag + Bag +
RS (75%) RS (50%) RS (25%) RS (75%) RS (50%) RS (25%)
N1 N4 N7 0.490 0.501 0.523 0.566 0.578 0.586 0.534 0.564 0.581 0.644 0.679 0.690 0.657 0.697 0.711 0.697 0.735 0.749 0.731 0.776 0.789 0.624 0.667 0.680 0.675 0.715 0.726 0.723 0.769 0.785 0.733 0.790 0.803
N10 0.536 0.589 0.595 0.694 0.720 0.757 0.797 0.688 0.734 0.794 0.809
Looking carefully at this table, it can be noticed that reported accuracy significantly decreases in comparison with the results reported for the first scenario (look at Table 1). It is also worth mentioning how 1NN obtains the worst results (around 0.5 what means that only one out of each two positions is correctly estimated). Thus, we observe how the performance of 1-NN drops dramatically in the case of dealing with complex and realistic environments. Both single classifiers, J48G and FURIA also obtain much worse results than those reported in Scenario 1, however they both outperform 1-NN no matter the block size (N i). On the other hand, the best result (0.809) is obtained by “FURIA MCSs Bag and RS (25%)” for N10. Moreover, “FURIA MCSs
Bag and RS (25%)” outperforms the other algorithms for all block sizes (N i). From these facts, it can be confirmed the need of adopting the MCS-based approach in order to deal properly with high dimensional problems like those arising from complex environments like Scenario 2. Moreover, fuzzy methods like FURIA exhibit all their potential in the context of very noisy problems where classical methods do not perform so well. This is due to the characteristics of the fuzzy rules generated by FURIA. On the one hand, thanks to RS (25%) FURIA handles much smaller number of features to be further filtered by its own internal feature selection algorithm in order to consider only the most representative features during the rule generation process. On the other hand, the “soft boundaries” determined by the fuzzy rule base fit well this complex classification problem. In addition, there are some interesting conclusions derived from this table that deserve to be highlighted: – Both J48G MCSs and FURIA MCSs perform better when combined with Bag + RS than with Bag only. “FURIA MCSs Bag + RS” outperform “J48G MCSs Bag + RS” in all cases. However, “J48G MCSs Bag” slightly outperform “FURIA MCSs Bag”. – MCSs obtain the highest accuracy when decreasing the number of features selected by RS (the smaller percentage of selected features, the more accurate results are reported). This fact is probably due to the so noisy and redundant signals measured from some APs in this complex scenario. Remind that in this scenario the number of handled APs is huge (over one-hundred). – Considering the block size parameter (Ni), like we observed in the previous scenario, it is correlated with the accuracy. The larger the block size is, the higher accuracy is obtained (however, already for N7 good results are reported). Like in the previous scenario, we can get a deep insight in the evaluation of the behavior of the classifiers used. Apart from paying attention to the classification accuracy, in the WiFi localization application, we should also take care of the error distance regarding the real position and the estimated one, which is considered only when misclassification takes place. Fig. 6 depicts a dispersion of the the error distance (in meters) for each algorithm evaluated by means of boxplots (the possible outliers are represented by circles). We have focused only on N10 because it yields the highest accuracy results. On the right side (Fig. 6 (b)) a zoom of the boxplots from the left side (Fig. 6 (a)) is presented. In the light of this figure, it can be noticed that the best values are obtained by “FURIA MCSs Bag + RS (25%)” and “J48G MCSs Bag + RS (25%)”.
A Multiclassifier Approach for Topology-based WiFi Indoor Localization
13
1−NN 1−NN J48G J48G FURIA
FURIA
J48G MCSs Bag
J48G MCSs Bag
J48G MCSs Bag + RS (75%)
J48G MCSs Bag + RS (75%)
J48G MCSs Bag + RS (50%)
J48G MCSs Bag + RS (50%) J48G MCSs Bag + RS (25%)
J48G MCSs Bag + RS (25%)
FURIA MCSs Bag
FURIA MCSs Bag
FURIA MCSs Bag + RS (75%)
FURIA MCSs Bag + RS (75%)
FURIA MCSs Bag + RS (50%)
FURIA MCSs Bag + RS (50%)
FURIA MCSs Bag + RS (25%)
FURIA MCSs Bag + RS (25%)
0
10
20
30
40
2
4
6
meters
8
10
12
14
16
meters
(a) Block size N10
(b) Block size N10 (zoomed)
0.50
●
3.0
3.5
4.0
4.5
5.0
5.5
6.0
6.5
Median Error Distance (meters)
(a) Accuracy vs Median Error Distance
0.77 0.76
1−NN J48G FURIA J48G MCSs Bag J48G MCSs Bag + RS (75%) J48G MCSs Bag + RS (50%) J48G MCSs Bag + RS (25%) FURIA MCSs Bag FURIA MCSs Bag + RS (75%) FURIA MCSs Bag + RS (50%) FURIA MCSs Bag + RS (25%)
0.75
Accuracy
0.70 0.65 0.55
0.60
Accuracy
●
0.78
0.79
0.75
0.80
0.80
0.81
0.85
Fig. 6 Reported results (considering block size N10) in terms of error distances (in meters) for the misclassified positions in Scenario 2 (UAH test-bed environment).
J48G MCSs Bag + RS (50%) J48G MCSs Bag + RS (25%) FURIA MCSs Bag + RS (50%) FURIA MCSs Bag + RS (25%)
3.5
4.0
4.5
5.0
5.5
Median Error Distance (meters)
(b) Accuracy vs Median Error Distance (zoomed)
Fig. 7 Comparison of algorithms used in Scenario 2 (UAH test-bed environment). Accuracy (y-axis) versus Median Error Distance (x-axis).
14
The former does so for the lower quartile and the median, whereas the latter achieves it for the lower and the upper quartile but also other MCSs combined with Bag + RS such as “J48G MCSs Bag + RS (50%)” or “FURIA MCSs Bag + RS (50%)” perform fairly well. On the other hand, several outliers with high distance value (up to 40 meters) are obtained by FURIA MCSs (e.g., “FURIA MCSs Bag”, “FURIA MCSs Bag + RS (50%)”, and “FURIA MCSs Bag + RS (75%)”), as well as J48G and FURIA. Only looking carefully at both Table 3 and Fig. 6, it is possible to have a fair global view of the goodness of the reported results. In order to make this task easier, Fig. 7(a) presents the median values of the error distances represented in Fig. 6 (x-axis) against the accuracy values reported in Table 3 (y-axis), for all the eleven algorithms evaluated in the experiments. Notice that, the best solution would lie in the upper-left corner having the highest accuracy and the smallest median. Thus, to have a better insight we have also presented a zoom of that part in Fig. 7(b). In the view of this figure, it can be clearly seen that the best solutions (they outperform all the remaining ones taking into account both classification rate and median error distance) are obtained by MCSs combined with Bag + RS. It is worth pointing “FURIA MCS Bag and RS (25%)”, since it outperforms all the other approaches considering both measures. By contrast the basic 1-NN does not achieve especially good behavior. It is placed in the lower part of the figure since it produces very low accuracy, but it does not report the most outstanding median value either. All the MCSs combined with Bag + RS clearly outperform 1-NN, when considering accuracy and in half of the cases with respect to median error distance. Thus, we can draw a clear conclusion. The proposed MCS-based approach strongly outperforms the standard 1-NN. Depending on the type of MCS selected different objectives could be achieved.
Krzysztof Trawi´ nski et al.
cution time reported by MCSs slightly decreases. This fact is due to 1-NN is a lazy method where all computational effort is made during the on-line execution stage while MCS-based methods are eager methods, i.e., they spend most of the time during the off-line learning stage but they are fast and extremely efficient in the on-line execution stage. Table 4 Execution time (measured in seconds) for different classification and aggregation methods during the on-line stage in Scenario 2 (UAH test-bed environment). Algorithm 1-NN J48G FURIA Bag Bag + J48G MCSs Bag + Bag + Bag Bag + FURIA MCSs Bag + Bag +
RS (75%) RS (50%) RS (25%) RS (75%) RS (50%) RS (25%)
N1 N4 N7 N10 17.633 17.849 18.677 16.067 0.008 0.007 0.007 0.007 0.010 0.008 0.010 0.010 1.780 1.732 1.772 1.790 1.819 1.849 1.836 1.996 1.800 1.750 1.782 1.810 1.841 1.772 1.741 1.784 1.801 1.810 1.768 1.783 1.833 1.744 1.783 1.814 1.820 1.773 1.796 1.805 1.819 1.771 1.803 1.842
5 Conclusions and Future Works
In this study, we proposed a framework in which both bagging and the combination of bagging with random subspace are applied to train J48G-based MCSs (fast decision trees) and FURIA-based MCSs (fuzzy rulebased classifiers) devoted to deal with the WiFi localization problem, that is faced as a high dimensional classification problem. By using the above mentioned techniques, we aimed to obtain a WiFi localization system which provides high accuracy with a reasonable on-line computational time. We have conducted a comprehensive experiment on two real test-bed environments, a simple scenario comFinally, Table 4 summarizes the average on-line evaluation time (corresponding to the execution of the schema posed of 39000 instances, 4 features, and 13 classes (locations) and a more realistic one (also more comdetailed in Fig. 1) reported by all the analyzed algoplex) composed of 8520 instances, 143 (134) features, rithms when dealing with the entire test set. This table and 71 classes (locations). It turned out that the deis constructed in the same fashion as Table 2, regarding signed MCSs were able to outperform the accuracy of several block sizes (Ni) for each evaluated algorithm. In the state-of-the-art nearest neighbor algorithm with a the view of the reported run-times, it can be noticed lower execution time in both analyzed scenarios. Esthat all evaluated MCSs were able to get much smaller pecially big accuracy differences were reported for the on-line evaluation time than 1-NN. The reported exesecond scenario. Thus, our approach is very promising cution time is roughly 8 times smaller with MCSs than for tackling with complex and realistic environments. with 1-NN. Moreover, if we make a comparison between Of course, further research should be performed. execution times reported for both scenarios (Table 2 One of the next steps we will consider in the future versus Table 4), we can see how 1-NN requires more is to incorporate some other advanced techniques, like time when the complexity of the test-bed environment random [10] and rotation forest [40], to generate MCSs. increases (Scenario 2), while simultaneously the exe-
A Multiclassifier Approach for Topology-based WiFi Indoor Localization
This is likely to yield even more accurate systems. Another interesting research line to follow is to apply our MCS-based framework into the context of a novel hierarchical WiFi localization approach that we have recently sketched [21]. Finally, we would like to explore the chance of extending the basic nearest neighbor algorithm in order to integrate it in our framework in combination with the other evaluated component classifiers J48G and FURIA. Acknowledgements This work has been partly supported by the Spanish Ministry of Economy and Competitiveness under INFANTREE project (JCI-2011-09839), ABSYNTHE project (TIN2011-29824-C02-01 and TIN2011-29824-C02-02), and the European Centre for Soft Computing (ECSC) located at Mieres (Asturias, Spain).
References 1. Alonso, J.M., Oca˜ na, M., Hern´ andez, N., Herranz, F., ´ Sotelo, M.A., ´ Bergasa, L.M., Magdalena, Llamazares, A., L.: Enhanced WiFi localization system based on soft computing techniques to deal with small-scale variations in wireless sensors. Applied Soft Computing 11(8), 4677– 4691 (2011) 2. Alonso, J.M., Oca˜ na, M., Sotelo, M.A., Bergasa, L.M., Magdalena, L.: WiFi localization system using fuzzy rulebased classification. Lecture Notes in Computer Science, Computer Aided System Theory - EUROCAST09 5717, 383–390 (2009) 3. Alvarez-Alvarez, A., Alonso, J.M., Trivino, G., Hern´ andez, N., Herranz, F., Llamazares, A., Oca˜ na, M.: Human activity recognition applying computational intelligence techniques for fusing information related to WiFi positioning and body posture. In: Proceedings of the IEEE International Conference on Fuzzy Systems, pp. 1881–1885 (2010) 4. Astrain, J.J., Villadangos, J., Garitagoitia, J.R., Gonz´ alez de Mend´ıvil, J.R., Cholvi, V.: Fuzzy location and tracking on wireless networks. In: Proceedings of the 4th ACM International Workshop on Mobility Management and Wireless Access, pp. 84–91 (2006) 5. Bahillo, A., Lorenzo, R.M., Mazuelas, S., Fernandez, P., Abril, E.J.: Assessment of the shadow caused by the human body on the personal RF dosimeters reading in multipath environments. In: Biomedical Engineering, pp. 133–144 (2009) 6. Bahl, P., Padmanabhan, V.: RADAR: An in-building RFbased user location and tracking system. In: Proceedings of the IEEE Computer and Communications Societies, pp. 775–784 (2000) 7. Banfield, R.E., Hall, L.O., Bowyer, K.W., Kegelmeyer, W.P.: A comparison of decision tree ensemble creation techniques. IEEE Transactions on Pattern Analysis and Machine Intelligence 29(1), 173–180 (2007) 8. Bonissone, P.P., Cadenas, J.M., Garrido, M.C., D´ıazValladares, R.A.: A fuzzy random forest. International Journal of Approximate Reasoning 51(7), 729–747 (2010) 9. Breiman, L.: Bagging predictors. Machine Learning 24(2), 123–140 (1996) 10. Breiman, L.: Random forests. Machine Learning 45(1), 5–32 (2001)
15
11. Chiang, K.W., Huang, Y.W.: An intelligent navigator for seamless INS/GPS integrated land vehicle navigation applications. Applied Soft Computing 8(1), 722–733 (2008) 12. Cohen, W.W.: Fast effective rule induction. In: Proceedings of the Twelfth International Conference on Machine Learning, pp. 115–123. Morgan Kaufmann (1995) 13. Cord´ on, O., del Jesus, M.J., Herrera, F.: A proposal on reasoning methods in fuzzy rule-based classification systems. International Journal of Approximate Reasoning 20, 21–45 (1999) 14. Cover, T., Hart, P.: Nearest neighbor pattern classification. IEEE Transactions on Information Theory 13, 21– 27 (1967) 15. Dharne, A.G., Lee, J., Jayasuriya, S.: Using fuzzy logic for localization in mobile sensor networks: simulations and experiments. In: Proceedings of the American Control Conference, pp. 2066–2071. IEEE (2006) 16. Dietterich, T.G.: An experimental comparison of three methods for constructing ensembles of decision trees: bagging, boosting, and randomization. Machine Learning 40(2), 139–157 (2000) 17. Elnahrawy, E., Li, X., Martin, R.P.: The limits of localization using signal strength: a comparative study. In: First Annual IEEE Communications Society Conference on Sensor Ad Hoc Communications and Networks, pp. 406–414 (2004) 18. Enge, P., Misra, P.: Special issue on GPS: The Global Positioning System. In: Proceedings of the IEEE, pp. 3–172 (1999) 19. Gallagher, T.J., Li, B., Dempster, A.G., Rizos, C.: A sector-based campus-wide indoor positioning system. In: IEEE International Conference on Indoor Positioning and Indoor Navigation, pp. 1–8 (2010) 20. Garcia-Valverde, T., Garcia-Sola, A., Gomez-Skarmeta, A., Botia, J.A., Hagras, H., Dooley, J., Callaghan, V.: An adaptive learning fuzzy logic system for indoor localisation using Wi-Fi in ambient intelligent environments. In: Proceedings of the IEEE World Congress on Computational Intelligence, pp. 25–32 (2012) 21. Hern´ andez, N., Alonso, J.M., Magro, M., Oca˜ na, M.: Hierarchical WiFi localization system. In: International Workshop on Perception in Robotics, IEEE Intelligent Vehicles Symposium, pp. P21.1–P21.6 (2012) 22. Herrero-Pereza, D., Martinez-Barbera, H., LeBlanc, K., Saffiotti, A.: Fuzzy uncertainty modeling for grid based localization of mobile robots. International Journal of Approximate Reasoning 51, 912–932 (2010) 23. Ho, T.: The random subspace method for constructing decision forests. IEEE Transactions on Pattern Analysis and Machine Intelligence 20(8), 832–844 (1998) 24. H¨ uhn, J.C., H¨ ullermeier, E.: FURIA: an algorithm for unordered fuzzy rule induction. Data Mining and Knowledge Discovery 19(3), 293–319 (2009) 25. Kittler, J., Hatef, M., Duin, R.P.W., Matas, J.: On combining classifiers. IEEE Transactions on Pattern Analysis and Machine Intelligence 20, 226–239 (1998) 26. Kuncheva, L.I.: Using measures of similarity and inclusion for multiple classifier fusion by decision templates. Fuzzy Sets and Systems 122, 401–407 (2001) 27. Kuncheva, L.I.: A theoretical study on six classifier fusion strategies. IEEE Transactions on Pattern Analysis and Machine Intelligence 24, 281–286 (2002) 28. Kuncheva, L.I.: Combining pattern classifiers: Methods and Algorithms. Wiley (2004) 29. Kuncheva, L.I., Bezdek, J.C., Duin, R.P.W.: Decision templates for multiple classifier fusion: an experimental comparison. Pattern Recognition 34, 299–314 (2001)
16 30. Magdalena, L.: What is soft computing? revisiting possible answers. In: 8th International FLINS Conference on Computational Intelligence in Decision and Control, pp. 3–10. World Scientific (2008) 31. Menendez, P., Campomanes, C., Trawi´ nski, K., Alonso, J.M.: Topology-based indoor localization by means of WiFi fingerprinting with a computational intelligent classifier. In: Proceedings of the 11th IEEE International Conference on Intelligent System Design and Applications, pp. 1020–1025 (2011) 32. Nerguizian, C., Belkhous, S., Azzouz, A., Nerguizian, V., Saad, M.: Mobile robot geolocation with received signal strength (RSS) fingerprinting technique and neural networks. In: IEEE International Conference on Industrial Technology, pp. 1183–1185 (2004) 33. Optiz, D., Maclin, R.: Popular ensemble methods: An empirical study. Journal of Artificial Intelligence Research 11, 169–198 (1999) 34. Outemzabet, S., Nerguizian, C.: Accuracy enhancement of an indoor ANN-based fingerprinting location system using Kalman filtering. In: 19th IEEE International Symposium on Personal, Indoor and Mobile Radio Communications, pp. 1–5 (2008) 35. Outemzabet, S., Nerguizian, C.: Accuracy enhancement of an indoor ANN-based fingerprinting location system using particle filtering and a low-cost sensor. In: IEEE International Conference on Vehicular Technology, pp. 2750–2754 (2008) 36. Palmer, N., Kemp, R., Kielmann, T., Bal, H.: The case for smartphones as an urgent computing client platform. Procedia Computer Science 9, 1667–1676 (2012) 37. Panov, P., Dˇ zeroski, S.: Combining bagging and random subspaces to create better ensembles. In: Proceedings of the 7th International Conference on Intelligent Data Analysis, pp. 118–129. Springer-Verlag (2007) 38. Paul, R., Aguirre, E., Garcia-Silvente, M., Mu˜ nozSalinas, R.: A new fuzzy based algorithm for solving stereo vagueness in detecting and tracking people. International Journal of Approximate Reasoning 53(4), 693– 708 (2012) 39. Quinlan, J.R.: Improved estimates for the accuracy of small disjuncts. Machine Learning 6(1), 93–98 (1991) 40. Rodriguez, J.J., Kuncheva, L.I., Alonso, C.J.: Rotation forest: A new classifier ensemble method. IEEE Transactions on Pattern Analysis and Machine Intelligence 28(10), 1619–1630 (2006) 41. Schapire, R.: The strength of weak learnability. Machine Learning 5(2), 197–227 (1990) 42. Trawi´ nski, K., Cord´ on, O., Quirin, A.: On designing fuzzy rule-based multiclassification systems by combining FURIA with bagging and feature selection. International Journal of Uncertainty, Fuzziness and Knowledge-Based Systems 19(4), 589–633 (2011) 43. Tsymbal, A., Pechenizkiy, M., Cunningham, P.: Diversity in search strategies for ensemble feature selection. Information Fusion 6(1), 83–98 (2005) 44. Webb, G.I.: Decision tree grafting from the all-tests-butone partition. In: Sixteenth International Joint Conference on Artificial Intelligence, pp. 702–707. Morgan Kaufmann (1999) 45. Witten, I.H., Frank, E., Hall, M.A.: Data Mining: Practical machine learning tools and techniques. 3rd Edition, Morgan Kaufmann, San Francisco (2011) 46. Woods, K., Kegelmeyer, W.P., Bowyer, K.: Combination of multiple classifiers using local accuracy estimates. IEEE Transactions on Pattern Analysis and Machine Intelligence 19, 405–410 (1997)
Krzysztof Trawi´ nski et al. 47. Youssef, M., Agrawala, A.: Small-scale compensation for wlan location determination systems. In: Proceedings of the ACM Workshop on Wireless Security, pp. 11–20 (2003) 48. Yun, S., Lee, J., Chung, W., Kim, E., Kim, S.: A soft computing approach to localization in wireless sensor networks. Expert Systems with Applications 36(4), 7552– 7561 (2009) 49. Zhou, Z.H.: Ensembling local learners through multimodal perturbation. IEEE Transactions of Systems, Man, and Cybernetics, Part B: Cybernetics 35(4), 725– 735 (2005)