VOL. 61, NO. 10
JOURNAL OF THE ATMOSPHERIC SCIENCES
15 MAY 2004
A Multiple Mass Flux Parameterization for the Surface-Generated Convection. Part II: Cloudy Cores SYLVAIN CHEINET Laboratoire de Me´te´orologie Dynamique, CNRS, Paris, France (Manuscript received 12 February 2003, in final form 30 September 2003) ABSTRACT The multiple mass-flux approach introduced in a companion paper aims at parameterizing the surface-generated convection in the atmosphere. The original aspects of this model are as follows. A number of convective updrafts are released in the surface layer. They initially have distinct fractional area and thermodynamic properties, determined through surface layer similarity; that is, by assuming that the thermodynamic fluxes are constant throughout the surface layer. Each updraft ascent is diagnosed using an entraining plume model. In the case of cumulus convection, this comprehensive formulation provides consistent representations of the subcloud mixing, the cloud mixing, and the associated cloudiness. In the present paper, this model is evaluated in two shallow moist convection cases, using the one-dimensional modeling framework. In the continental convection case, the diurnal cloud growth and the related subcloud layer ventilation agree with large eddy simulations. In the oceanic convection case, the model reproduces the steady-state convection structure. It also satisfactorily represents the cumulus thermodynamics (average properties, variability). These results are shown to be relatively robust with respect to several model parameters and to the vertical resolution. Implications in terms of cumulus convection analysis and modeling are discussed. Some critical issues are emphasized, in various types of cloud and mixing schemes. Model predictions, supported by results found in the literature, emphasize the complementary roles of the subcloud layer plumes, the smaller cumuli, and the bigger less diluted cumuli. These various cloud types interact through the mean environment, so that the cloud population and the mean profiles adapt to the large-scale and surface forcings.
1. Introduction Cumulus convection plays a fundamental role in the dynamics of the Tropics and subtropics. Besides their radiative impact (notably for the deep clouds), the convective cumuli (Cu) are associated with an intense mixing on the vertical. Averaged over their life cycle, nonprecipitating (shallow) cumuli do not involve a net release of latent heat in the atmosphere. However, they efficiently redistribute heat and moisture above the wellmixed subcloud layer. In summer over continents, shallow Cu may characterize the transition toward deeper (precipitating) convection. These clouds are also frequently found in the central part of subtropical oceans (e.g., Norris 1998), where they intensify the surface evaporation and enhance the hydrological cycle of the Hadley cell. In deep (precipitating) convection, the occurrence of rain and the interaction with momentum transport may lead to a dramatic change in the dynamics of the convective cells. For example, the reevaporation of precipitation and the melting of falling snow or hail
induce some recirculations, which may affect the subcloud layer dynamics. The scales involved in cumulus convection are not explicitly resolved in numerical weather prediction (NWP) models. During the last 30 years, a number of parameterizations have been proposed for the convective mixing. The eddy diffusivity approach, used to represent the vertical mixing in the boundary layer, has been extended to parameterize the shallow cumulus convection (e.g., Bougeault 1981; Bechtold et al. 1995; Cheinet and Teixeira 2003). Manabe et al. (1965) and Betts and Miller (1986) describe the equilibrium state toward which the atmosphere converges (adjustment process). Arakawa and Schubert (1974) and Tiedtke (1989) use the so-called mass flux approach, in which the upward convective motions (and associated vertical mixing) are explicitly represented, through the integration of a plume model on the vertical. The mass flux approach is almost universally used, and the representations of the moist convective mixing in present NWP models mostly differ by the plume model itself and its closure at cloud base.
Corresponding author address: Sylvain Cheinet, ECMWF, Shinfield Park, Reading RG2 9AX, United Kingdom. E-mail:
[email protected]
a. Mass-flux parameterization of cumulus convection Following Yanai et al. (1973), the updrafts may be parameterized as one ensemble (hereafter referred to as
q 2004 American Meteorological Society
1093
1094
JOURNAL OF THE ATMOSPHERIC SCIENCES
VOLUME 61
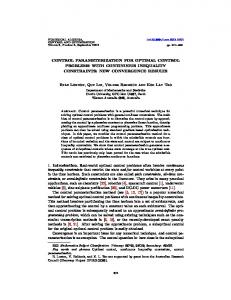
FIG. 1. Conceptual sketch of some mass flux parameterizations of Cu-induced mixing. The cloudy convective ascents may be treated as a whole (bulk-ensemble), or as a number of updrafts (multiple mass flux). The buoyancy sorting formalism follows mixtures between the cloud-base air and the environment. The model extends the multiple mass flux framework to the subcloud layer, where the mixing is otherwise treated separately. An outstanding feature of the present approach is that the updraft fractional areas are handled explicitly and used to derive the cloud properties.
the bulk ensemble approach; Fig. 1). The exchanges through lateral boundaries crucially modulate the dilution rate of the convective parcels, and thus affect the height that the cumuli reach (e.g., Tiedtke 1989; Gregory and Rowntree 1990; Bechtold et al. 2001). Closures of the bulk-ensemble approach gather not only the parameterization of exchanges at individual updrafts’ edges, but also ensemble-averaging issues (see below). Simple and validated closures for the lateral exchanges in updrafts’ ensembles are still to be determined (Siebesma and Cuijpers 1995). This is felt through switches in these closures according to ‘‘first-guess’’ estimates on what type of convection is at work. Unlike the bulk-ensemble approach, Arakawa and Schubert (1974) sort the updrafts into classes, according to their height or, equivalently, to their entrainment rate (so-called multiple mass flux framework). At the expense of an increased complexity, the latter approach explicitly describes a cloud population, and the heterogeneity among convective parcels (at one horizontal level) is represented. Elaborated mass flux parameterizations have also been proposed (Kain and Fritsch 1990; Emanuel 1991), based on the buoyancy sorting mechanism suggested by Raymond and Blyth (1986): at all levels, undiluted cloud-base air mixes with the environment, and the formed mixtures are redirected toward neutral buoyancy (Fig. 1). The physical basis for this mechanism is still a matter of debate. As an example, Taylor and Baker (1991) argue that their observations may as well support the idea that the convective parcels experience a continuous mixing along their ascent. Besides its computational cost (a number of mixtures are generated at all cloud levels), the closure of this approach involves the mixtures’ statistical distribution, which is difficult to infer from observational data. On the other hand, the buoyancy sorting approach represents the thermodynamics associated with the generation of downdrafts at the edges of cumuli. It may thus be an adequate parameterization in cases where downdrafts modulate the convection dynamics. However, a number of convection
cases do not crucially involve downdrafts, including shallow convection (Siebesma 1998), but also deep precipitating convection (Lin and Arakawa 1997). In virtually all moist convection parameterizations, the integration of the plume model is started at cloud base. The determination of the lower boundary conditions (thermodynamic properties of the updrafts, including the mass flux) is an important parameterization issue (Del Genio and Yao 1988). Various closures have been proposed in the literature, possibly depending on the type of convection considered (e.g., Tiedtke 1989). The closure may rely on the convergence of thermodynamic properties (like moisture) in the subcloud layer (Kuo 1965). It may also depend on the mean profiles [e.g., Fritsch and Chappel (1980) use the convective available potential energy (CAPE) as a prognostic variable] or on their rate of destabilization by the largescale dynamics (e.g., Arakawa and Schubert 1974). Closures based on the diagnosis of subcloud layer plumes (McNider and Kopp 1990; Grant 2001) are reported to yield significant improvements in weather and climate prediction (e.g., Ridout and Reynolds 1998; Jakob and Siebesma 2003). These attempts are supported by experimental data and diagnostic tools, which suggest that the convective plumes overshooting the subcloud layer top determine the cumulus properties at cloud base (Wilde et al. 1985; Wetzel 1990, among others). b. Motivations of the present study The assumptions made to determine the closure at cloud base relate to the ventilation of the subcloud layer. However, in many cases, they are not consistent with the subcloud layer mixing scheme. In fact, as discussed above, the separation between subcloud and cloud mixings is somewhat arbitrary in the case of surface-generated convection. Such inconsistencies are clearly flaws in the physical packages of NWP models. Furthermore, besides the vertical mixing, it is also necessary to parameterize the cloud properties. In many NWP models,
15 MAY 2004
CHEINET
the cloud properties (cloud fraction, liquid water content) are computed from a dedicated algorithm (e.g., Bougeault 1981; Tiedtke 1993). As discussed below, this separation between cloud and mixing schemes is questionable in the case of cumulus clouds, which are characterized by a strong coupling between the vertical motions and the latent heat exchanges. In the part I of this study (Cheinet 2003, hereafter C1), a model based on the multiple mass flux approach is introduced for parameterizing the surface-generated convective plumes and their role in the atmosphere. A number of convective updrafts are released in the surface layer, with distinct thermodynamic properties and fractional area. This initiation is formulated in terms of the surface fluxes, based on well established surface layer similarity rules. Each updraft ascent is then diagnosed using the same entraining plume model irrespective of the updraft saturation (Fig. 1). Cheinet (2003) tests this model in a one-dimension framework. He shows that the model applies to dry (unsaturated) convection cases. More precisely, the dry convective plumes and their fundamental role are reproduced in the case of a dry convective boundary layer. In the context of moist convection, one breakthrough compared to many operationally used parameterizations is that this model provides a consistent formulation for the subcloud mixing, the cloud mixing, and the related condensation. Hence, from a formal point of view, the model addresses some of the conceptual issues discussed above with respect to moist convection parameterization in large scale models (consistency between subcloud, cloud mixings, and cloudiness parameterizations) in a rather comprehensive and straightforward way. The present work is an attempt to quantify the model performances in cases of nonprecipitating moist convection. The model will be run in the same one-dimension version as used in C1 (except for one closure, for reasons discussed below). Compared to diagnostic tests, the single-column modeling framework allows us to evaluate the prognostic behavior of a parameterization (Randall et al. 1996) as the synoptic-scale dynamics are prescribed as forcings. For practical NWP applications, it is useful to evaluate a single-column model under various physical forcings. Alternatively, one may test the soundness of a parameterization by evaluating many aspects of its predictions in one case, thereby testing the relevance of the concepts and closures at work. Large eddy simulations (LES) allow such detailed comparisons. Provided that they can be run with the same forcings, LES provide extensive high-resolution numerical data for comparison. They have been successfully evaluated in cases of nonprecipitating cumulus convection (e.g., Sommeria 1976; Sommeria and LeMone 1978, among others). The present paper is organized as follows. Section 2 outlines the model details. Section 3 analyzes the model predictions in the case of oceanic steady state Cu. The robustness of the results are assessed through several
1095
sensitivity tests on model parameters. In section 4, the model is evaluated (with two vertical resolutions) in the case of a diurnal cycle of continental Cu, in which various regimes of convection are successively at work. The latter two sections deal with turbulent fluxes and mean variables comparisons (including cloud structure). In section 5, a thorough evaluation is performed, in order to confirm the model concepts: the modeled representation of the oceanic cumuli properties is compared to the LES, considering averages among the cloudy convective parcels, and also the variability among them. Section 6 presents a more prospective analysis, where the model results are used to characterize some properties of a size-distributed field of cumuli. The results of this study are summarized in section 7. 2. Model outlines The reader is referred to C1 for a detailed and referenced description of the scheme. We briefly recall the main features and controlling parameters in terms of moist convection parameterization. We hereafter denote the liquid water (virtual) potential temperature by u l (u y ), the total (liquid) water content by q t (q l ), and the vertical velocity by w. Given a quantity X, we denote by X the slab mean, and (F X ) S the surface flux of X. We also define X9 5 X 2 X . a. Updrafts initiation The model is designed to represent the plumes that appear in surface generated convection (upward latent and sensible heat fluxes at the surface). Following the multiple mass flux framework, the convective motions are sorted into a spectrum of updrafts. In our approach, each updraft gathers parcels that have similar properties in the surface layer, instead of at cloud base (Fig. 1). The underlying assumption is that similar parcels in the surface layer have a comparable vertical ascent, irrespective of the actual physical structures in which they are embedded. Note that strictly speaking, this definition implies that there is no one-to-one correspondence between the model updrafts and the physical convective structures. The probability density function (PDF) of w in the surface layer is modeled as follows: the w . 0 branch of the distribution is Gaussian-shaped, while the w , 0 branch is a delta function (one homogeneous downdraft, see below). It is then made discrete, defined as ‘‘discretized’’, (at z 5 z s ), each discrete value standing for one updraft. This provides the vertical velocity w i and the fractional area s i of the ith updraft (subscript i). The number N of updrafts is prescribed as in C1, that is, N 5 512 (see the sensitivity test below). Decreasing N leads to grouping more and more different parcels into the same updraft (see C1). The (u y ) i and (q t ) i are taken correlated to w i , and (u l ) i is derived in terms of (u y ) i and (q t ) i . As mentioned in C1, taking fixed cor-
1096
JOURNAL OF THE ATMOSPHERIC SCIENCES
relations between thermodynamic properties in the surface layer is a first step toward a more elaborated formulation, that would account for the surface characteristics. The choice of the statistical distribution for the updrafts fractional area is somewhat arbitrary. It controls the relative weight of each updraft (at all heights, see below). On the other hand, it will be seen that during the simulations, the mean profiles interact selectively with some updrafts, which may open the place for compensative feedbacks that can adapt to this arbitrariness. In order to close their multiple mass flux approach at cloud base, Arakawa and Schubert assume that the cloud population is in quasi equilibrium with the large-scale forcings, given the mean profiles. Their closure avoids the above arbitrariness and has the advantage to represent other than the surface generated types of convection (see below). It also involves a quasi-equilibrium assumption, and a greater complexity (Moorthi and Suarez 1992). The initiation is closed through the variances of w, u y , and q t at the level z s , chosen as 50 m (preliminary tests show that this value can be doubled without significant changes on the results). This surface layer similarity provides the variances in terms of z s and the lower boundary conditions of the model, (F u ) S and (F qt ) S , which are specified (boundary conditions of the model, see C1 for details). The surface layer similarity has been shown to be valid in various convection regimes, over land and ocean (see C1). It assumes that the thermodynamic fluxes are constant throughout the surface layer. In that sense, our closure is comparable to the moisture convergence closure proposed by Kuo (1965), which assumes that the flux of moisture is constant throughout the subcloud layer. b. Updrafts ascent The updrafts ascent is diagnosed with a steady state entraining plume model. The equations for the vertical velocity wi and a conserved property Xi are written as ]X i 5 2e i X9, i ]z
(1a)
]w i2 g 5 2a (u 9) 2 2be i w i2 , ]z uy y i
(1b)
where a, b are nondimensional constants, and e i is an updraft-dependent lateral entrainment rate (per meter). Numerically, Eqs. (1) are discretized over the model vertical grid, assuming there are enough levels for this discretization to make sense (as in any mass-flux scheme). They are integrated upward as long as w i . 0. Equation (1a) is used for X i 5 [(u l ) i , (q t ) i ]. One can then derive (u y ) i , which accounts for the latent heat release in saturated conditions. Finally, (1b) is used to compute w i . Note that the release of updraft air into the environment due to lateral exchanges (so-called lateral
VOLUME 61
detrainment) is parameterized through e. On the other hand, the release of updraft air when the updraft stops (sometimes called forced detrainment) is explicitly accounted for. The overturning process (downward redirected plumes) is also represented with Eqs. (1) integrated downward (see C1). The first equation in (1) has met a wide success among moist convection modelers (e.g., Betts 1976; Tiedtke 1989) and yields realistic matches with observations considering unsaturated plumes buoyancy (see C1). The second equation is also a well-known model for the vertical velocity in dry plumes (Turner 1962; C1). It has also been successfully evaluated in precipitating cumuli (Squires and Turner 1962; Simpson and Wiggert 1969; among many others). It is often used to parameterize the convective precipitation, since the fallout of liquid (or solid) water from a cumulus may be derived from the in-cloud vertical velocity (Pruppacher and Klett 1997). In the model, the above ascent equations are used for dry as well as cloudy convective plumes. This is physically justified by the analogy between the thermodynamic and geometric properties observed in dry and cloudy convective thermals (characterized by a buoyant core ascending and widening, with forced downward motions at the edge). This analogy is discussed by Squires and Turner (1962) and Johari (1992), and is a striking feature of the comparison between various numerical and observational results (see C1 for a referenced discussion on dry plumes, and Sommeria 1976; Carpenter et al. 1998; Kollias et al. 2001 for cloudy plumes). In the past, various closures have been proposed for a and b, in order to account for the pressure perturbation and subplume turbulence terms (see Simpson and Wiggert 1969; Gregory 2001; and section 5 below for discussions on these aspects). Cheinet (2003) performs a prognostic evaluation of (1). By conditionally sampling the updrafts, he demonstrates that taking a 5 1 and b 5 1 allows a realistic prediction of the plume dynamics in the dry convective boundary layer. This set of closure is used in this study as well. Based on observations, e has frequently been formulated in terms of the radius of the convective cloud on which (1) is applied (e.g., Simpson and Wiggert 1969). The correlations between cloud radius, lateral entrainment, vertical velocity and maximum height are well-known features of the spectral mass flux decomposition (Ogura and Cho 1973; Arakawa and Schubert 1974, among others). However, this closure would require us to assign a radius to each updraft, which is far from trivial, since the model updrafts are structurally different from physical clouds. Alternatively, in the present application of (1), e i is taken as in C1:
1t w , C z2 ,
e i 5 max
1
1
i
(2)
s
where t is the plume turnover time (of the order of
15 MAY 2004
CHEINET
100–1000 s), and C s 5 3 (the sensitivity to this parameter is discussed in C1). Equation (2) states that faster updrafts experience less lateral entrainment. This closure was suggested by Siebesma (1998), arguing that it may account for shallow as well as deep convection (without switch). It has been successfully evaluated in the LES diagnostic study of Neggers et al. (2002) in shallow Cu. Cheinet (2003) proposes a closure for t in terms of the normalizing parameters of the dry convective boundary layer. In the case of moist convection, the large-scale modulators of t remain to be determined. Note that the same issue has to be faced with a direct closure on e. As a first step toward a fully closed scheme, our simulations use a case-dependent t, chosen in the light of experimental arguments relating to cloud aspect ratio (width over height). Consistently with the view that cloudy plumes come directly from subcloud plumes, t is taken the same in the subcloud and in the cloud layer. Sensitivity tests show that taking a variable t with height would not crucially affect the model dynamics. c. A unified mixing-cloud scheme Whereas the variation of physical plume widths with height is documented (e.g., Turner studies), the variation of the updrafts fractional area with height is difficult to assess. In order to remain as simple and transparent as possible, the s i are supposed to be constant with height. As will be seen below, this assumption leads to very realistic results with respect to the fractional area covered by convective motions in the two considered cumulus cases (and in dry convection cases, see C1). Another assumption made in the model is that the plume environment (referred to as the environmental downdraft) is taken to be horizontally homogeneous. Although this assumption degrades the representation of the variances (Wang and Stevens 2000), it is commonly used in cumulus convection parameterization, because it allows a satisfactory representation of the thermodynamic fluxes (Siebesma and Cuijpers 1995). At each level, the environmental downdraft properties are determined as compensating the updrafts and overturned updrafts departures from the mean environment. The mixing tendencies of the model prognostic variables (conserved properties u l and q t ) result from the advections due to the updrafts (including their possible overturned component) and the environmental downdraft. Given the s i , the model predicts a discrete statistical distribution of the thermodynamic properties at all heights. For example, this provides the convective cloud fraction (sum of the saturated updrafts fractional area) and in-cloud liquid water content (average of q l over the saturated updrafts). This prevents one from using a dedicated scheme for convective cloudiness. Of course, clouds may not only be associated with surface-generated ascending plumes that saturate (e.g., stratiform clouds formed in the case of moistening and/or cooling
1097
of an atmospheric layer). Besides, upward convection is not always surface generated (e.g., midlevel convection; Tiedtke 1989). At the present stage, this is not accounted for in the model, so only surface-driven convection cases can be represented. Another structural limitation of the present model is that it does not describe the buoyantly driven downward motions that may be induced by radiative cooling (e.g., in stratocumuli), or by evaporative cooling. Finally, it does not account for momentum transport and shear-induced mixing. As such, it may be used operationally in large-scale models only in conjunction with parameterizations dedicated to represent these other types of vertical mixing and cloudiness. For example, the stratiform cloud component may be represented in parallel by a statistical cloud scheme without facing the issues met in modeling the cumuli with the statistical approach (Bougeault 1981). On the other hand, the model is based on a formulation in which the dry and moist plumes are treated with exactly the same equations (Fig. 1), which determine both the vertical mixing and cloud properties. Hence, in the cases of surface-generated convection, subcloud, cloud mixings and associated cloudiness are parameterized in a fully consistent and unified way. A number of unified parameterizations have been proposed in the literature, using the same thermodynamic statistical distributions to compute the mixing and the cloud properties (Bougeault 1981; Lappen and Randall 2001; Golaz et al. 2002). They use prognostic equations to constrain the statistical distributions, and may be rather demanding in terms of computer resources. In comparison, the present model is purely diagnostic with respect to mixing properties (no prognostic variable characterizing the subgrid mixing). It is straightforwardly based on the explicit representation of the convective plumes ascent. In that sense, the model challenges more complex parameterizations of surface-generated convection. Hereafter, unless stated otherwise, the time step (the vertical resolution) will be 60 s (50 m) (see also the sensitivity tests below). 3. Steady-state oceanic convection Steady-state convection frequently occurs over tropical and subtropical oceans, where it has been thoroughly documented through several observational campaigns. The case considered here is described by Siebesma et al. (2003). It is an idealization of the atmospheric conditions observed during the Barbados Oceanographic and Meteorological Experiment (BOMEX). The surface latent and sensible heat fluxes are prescribed as 145 and 8 W m 22 , while some large scale forcings are also accounted for (essentially, through an imposed large scale subsidence and a slight cooling). The convection structure is clearly apparent in the initial profiles (Figs. 2b and 2e). The first hundreds of meters consist of a well-mixed (subcloud) layer. The condi-
1098
JOURNAL OF THE ATMOSPHERIC SCIENCES
VOLUME 61
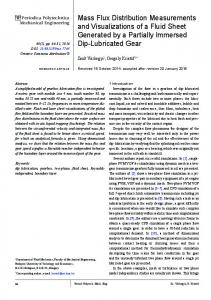
FIG. 2. (a) Cloud and core fractional areas (core parcels are defined as those saturated, ascending, and positively buoyant); (b) qt ; (c) Lw9q9 t ; (d) ql ; (e) u l ; and (f ) C pw9u9l , from BOMEX. Results are averaged over the 6th and the 12th hours of simulation (except for the cloud cover, for legibility). Line styles are indicated in the legends.
tionally unstable layer, where convective clouds develop, is capped by the trade wind inversion. The model is run in the same configuration as in C1. The LES results of Neggers et al. (2002) suggest that the cloud turnover time in the BOMEX case is between 250 and 350 s, irrespective of the cloud size. In our reference simulation, t is thus fixed as t 5 300 s (see the sensitivity test below). After the first hour, characterized by the convection initiation, the model rapidly converges towards a steady state. For example, with the exception of the inversion strengthening due to the large-scale subsidence, the mean profiles and the cloud and convection characteristics obtained after 6 and 12 h of simulation are very similar (Fig. 2). The model performances are hereafter compared to the results of the Royal Netherlands Meteorological Institute (KNMI) LES in Siebesma et al. (2003), considering averages over the sixth hour of model and LES simulations. Siebesma et al. show that, after several hours, all the LES tested on the case converge towards a very comparable turbulence structure (although a significant scatter was obtained for some fields, see below). Shear effects are accounted for in the LES simulation, which is not the case in our model. The comparison between the pre-
dictions is still quite meaningful, since the results of Brown (1999) show that the scalar transports are largely unaffected by shear in shallow convection cases. a. Model evaluation In the model, the cloud is characterized by the saturated updrafts (overturned or not), which have a finite fractional area. As discussed above, although this relation between cloud and mixing is physically obvious, it is in fact an outstanding feature of the present parameterization. Using an idealized bulk-ensemble model with the same property, Asai and Kasahara (1967) show that the convection is most efficient when the fractional area of the active clouds is of a few percent. This is actually the case in the model (Fig. 2a), which suggests that the model convection organizes in order to maximize the vertical transport of heat. The maximum cloud fraction is reached just above cloud base, where many updrafts produce condensation and rapidly stop (forced cumuli; Nitta 1975). The maximum cloud cover, the cloud base, and cloud top all agree with the LES. The characteristic decrease of the cloud area with height is also reproduced. Whereas many single-column models
15 MAY 2004
CHEINET
1099
FIG. 3. BOMEX sensitivity of (left) cloud fraction, (middle) u l , and (right) C pw9u9l , according to model closures: (top) updrafts turnover time t ; (bottom) number of updrafts N.
tend to overestimate the liquid water content in cumuli (e.g., Lenderink et al. 2004, hereafter LEN), the model underestimates the cloud fraction (above 800 m) and the liquid water content (by less than a factor of 2). The overturned updrafts contribution is relatively small, in keeping with the results of Siebesma (1998). Besides, core parcels (saturated, ascending, and positively buoyant) may explain part but not all the model discrepancies (Figs. 2a and 7). By design, passive clouds, formed when convective updrafts stop and undergo dilution in their environment, are not accounted for (consistent with the assumption that the environment is homogeneous). The nonrepresentation of these quiet cloudy parcels is thought to explain at least part of the above deficiencies. Figure 2 also shows the profiles of q t and u l , together with their respective fluxes. The model predictions mostly stay within the variability range of the various LES tested in Siebesma et al. (2003). The conditionally unstable layer is maintained, as well as the inversion above it and the underlying mixed layer. The fluxes structure generally agrees with the LES. Notably, the strong flux convergence above 1300 m is reproduced. Considering the flux of u l , the small difference between the model and the LES in the surface layer relates to the fact that the flux in the first layer is prescribed as the surface flux (see above). The subcloud layer ventilation is underestimated for q t (see the decrease of the latent heat flux). This is not the case for u l , which may suggest that the correlation coefficient between w and q t is stronger than the value of 0.32 used in the surface
layer [e.g., the numerical simulation of Sommeria (1976) and the measurements reported by Nicholls and LeMone (1980)]. This deficiency decreases with time, as the mean profiles and the convection structure adapt to produce a turbulence structure that balances the largescale forcings. b. Sensitivity tests It is important to evaluate the model sensitivity to t, as there are some uncertainties on its value and on which large-scale parameters modulate it. We have performed sensitivity tests by changing t from 240 up to 420 s (Fig. 3, top). As the updraft turnover time increases, the lateral entrainment rate decreases in (1), so the updrafts go up faster and remain less diluted along their ascent. They reach higher levels, and are associated with enhanced fluxes and a more eroded trade wind inversion. The fact that the lateral exchanges modulate the exchanges between the boundary layer and the free troposphere (and thus the inversion height) is already discussed in C1 (vertical entrainment in the case of dry convection). It is here obtained in the context of a cumulus-topped boundary layer. The cloud cover structure remains very stable, though. The temperature and moisture lapse rates in the conditionally unstable layer, and the well-mixed structure of the subcloud layer are both virtually unchanged. Thus, in a general sense, the model sensitivity to t remains at acceptable levels in terms of large-scale modeling requirements.
1100
JOURNAL OF THE ATMOSPHERIC SCIENCES
VOLUME 61
FIG. 4. Cloud properties during the simulation (from ARM): (left) maximum cloud fraction; (middle) integrated liquid water content, and (right) cloud base and top. Line styles are indicated in the legend.
The computational cost is a major limiting factor of the present large-scale models. We have performed sensitivity experiments to the number of updrafts, by decreasing N from 512 down to 8 (Fig 3, bottom). For lower N, each updraft characterizes a larger s i , which produces the discretized aspect of the cloud cover (the local increases are associated with the updraft overturning). However, even for N 5 8, the cloud structure (base and top heights, decrease with height, maximum cover) is very similar. Not only are the fluxes almost unchanged, but also the mean thermodynamical structure is exactly the same. Overall, this very low sensitivity to N is quite encouraging, since lower N are associated with a lower computational cost (see also C1). An interesting academic case is to take N 5 2: among the two generated updrafts, one stays within the subcloud layer (it stops being saturated at 550 m), the other reaches 1700 m. Hence, in the cloud layer, this simulation reproduces the expected behavior of a bulk-ensemble mass-flux scheme that would use (1) and (2). The cloudy updraft is responsible for a slightly excessive mixing in the conditionally unstable layer (this aspect of mass-flux parameterizations is discussed in LEN). Still, the mean profiles and the convection structure remain relatively realistic, which stresses the simulation robustness with respect to N. 4. Diurnal cycle of continental convection A critical test for convection models is to consider the response to nonsteady surface forcings (e.g., diurnal cycle) as successive convection regimes have to be accounted for (dry convection, forced Cu, mature Cu). Here, the shallow convection case described in the LES intercomparison of Brown et al. (2001) is used. It is based on observations made in the southern Great Plains (SGP) in June 1997, in the context of the Atmospheric Radiation Measurement program (ARM). The results are compared with the KNMI LES results (Brown et al. show that the LES tested on the case converge). Here again, although (moderate) shear is accounted for in the
LES, it should not alter the thermodynamic evolution of the boundary layer. The model simulation starts at 0630 local time (LT), and is initialized with the LES profiles obtained at that time. Initially, the prescribed surface fluxes are positive but very weak. They increase until 1300 LT. The latent and sensible heat fluxes are then, respectively, 500 and 125 W m 22 (the Bowen ratio being very different from the ratio in BOMEX). The fluxes then decrease and vanish at 1900 LT. In the absence of observational data on t in this case, the model is closed with t 5 450 s, chosen in order to optimize the model predictions as compared to LES (see the sensitivity test below). The increase compared to the BOMEX case (where t 5 300 s) may be qualitatively understood in the light of the LES results of Neggers et al. (2003): they report that ARM cloud aspect ratios exceed BOMEX ratios by a factor of 1.5. One may speculate that the convective parcels are less diluted with respect to the environmental air; that is, they have a larger turnover time. The other model parameters are left unchanged compared to the BOMEX simulation and C1. Following the intercomparison setup of LEN, two vertical resolutions are tested: the simulation 70L has 70 levels regularly distributed between 50 and 3500 m. The simulation 14L uses 14 levels up to 4000 m, and a grid spacing that increases with height. The following vertical levels, in meters, are used: 100, 300, 500, 700, 940, 1170, 1430, 1720, 2040, 2400, 2780, 3200, 3660, and 4150. a. Cloud structure We first analyze the evolution of the cloud structure (cloud thickness, integrated liquid water content and maximum cloud fraction; Fig. 4). The cloud-base (top) height is diagnosed at the grid-box lower (upper) boundary. As discussed above, the integrated liquid water content is underestimated. The first clouds appear just before 0900 LT in the LES, at 0900 LT in 14L, and before 0930 LT in 70L. The good agreement between the model and the LES supports the suggestion of Wilde et al.
15 MAY 2004
CHEINET
1101
FIG. 5. Cloud cover with height and time, from ARMs for various lateral entrainment closures: (left) t 5 300, (middle) t 5 450 (reference simulation), and (right) t 5 600 s.
(1985) that the cumulus onset coincides with the first convective plumes reaching their condensation level (forced cumuli). The cloud-base height is overestimated in both 14L and 70L, due to an excessive vertical entrainment during the dry convection regime (see below). The convection intensity increases in the late morning. The cloud-top and cloud-base heights increase with time, in agreement with the LES. The somewhat noisy aspect of the maximum cloud fraction (reached at cloud base, as in the LES) relates to the discretized jumps in cloud-base height. In the afternoon, as the surface fluxes decrease (and so does the model updrafts strength), the cloud-top height does not show a clear trend to increase anymore, in the model as well as in the LES. We have performed two additional runs, with t 5 300 and t 5 600 s. As shown in Fig. 5, increasing t leads to enhanced vertical fluxes and higher clouds (in keeping with the sensitivity obtained from BOMEX). It also causes a slightly stronger subcloud layer growth. In the three runs, however, the predicted cloud structure has the correct order of magnitude, and exhibits realistic variations with height and time. Here again, this demonstrates that the model prediction is not crucially determined by the optimization of t. Hence, in a general sense, the agreement between the model and the LES for the cloud properties (onset, growth, disappearance, vertical structure) is quite significant. b. Thermodynamic structure The profiles of u l and of the flux of u l are shown at different times in Fig. 6. Analyzing the corresponding plots for q t (not shown) would yield the same following conclusions. It is clear here that the dry convective boundary layer entrains more (on the vertical) in the model than in the LES during the first hours of simulation. The values used for t are here of several hundred seconds. In the first hours, this is significantly larger than the values that would be obtained by applying the closure proposed by C1. This, together with the crude resolution in 14L, may explain the overestimated ver-
tical entrainment rate (see C1). As a result, the model predicts a drier (and somewhat warmer) subcloud layer compared to the LES in the morning. Conversely, in the afternoon, the model exhibits a slight tendency to underestimate the subcloud layer (and cloud lower layer) ventilation by moist convection. Despite these deficiencies, the predicted turbulence structure generally agrees with the LES. The subcloud well-mixed layer realistically moistens and warms during the day. The growing Cu are associated with a developing conditionally unstable layer. A strong convergence of fluxes (cooling–moistening) takes place in the upper cloud levels as they are progressively incorporated in the bulk cloud layer, in keeping with the LES. As a result, the mean thermodynamic states predicted by the model and the LES are in good agreement. Interestingly, although the afternoon surface fluxes (lower boundary conditions of the updrafts) come back to near their morning values, the morning and afternoon convection types are radically different. The less stratified and more moist environment in the afternoon (Fig. 6) favors the updraft ascent, which explains these differences. These environmental changes are mainly due to the early stages of the convective activity (dry convection, followed by shallow forced convection). The existence of a conditionally unstable layer is a prerequisite for the cumulus convection to develop on the vertical. The dynamical picture obtained here suggests that this existence itself may result from the previous steps of the convective activity (notably the forced cumulus stage, see below). c. Parameterization issues LEN intercompare a number of single-column models considering the precise continental convection case considered here (the reader is referred to that study for a quantitative comparison between the present model and some operationally used parameterizations). Some models use the eddy diffusivity (with higher-order closures) for parameterizing the cumulus layer, while others use
1102
JOURNAL OF THE ATMOSPHERIC SCIENCES
VOLUME 61
FIG. 6. ARM values of (top) u l , and (bottom) C pw9u9l , at 0730, 1030, 1330, and 1630 LT. The thick line represents 70L; the thick dashed line 14L; and the thin line LES.
the mass flux approach. Flaws reported in that intercomparison include cloud fraction overestimation, underestimated cloud thickness, and persistence of convection at the end of the day. These deficiencies are more severe with lower vertical resolutions. In the light of these results, the model predictions compare very well with the LES, which is thought to relate to the consistent treatment of subcloud (and before cloud) mixing, cloud mixing, and associated cloudiness. The robustness with respect to the vertical resolution (Figs. 4 and 6) is also remarkable. In fact, although some differences can be noted between 14L and 70L, the predictions are not degraded with low resolution. The present results also lead to instructive conclusions with respect to the case itself. Our model is purely diagnostic with respect to the convective activity, and still, it is able to represent the cloud structure with time. This suggests that the upper cloud levels adjust very rapidly to the surface forcings. For illustration, we consider the late afternoon predictions. As the surface forcings vanish, the model does not predict any updraft, so the modeled cloud vanishes. The LES seems to behave very much like this idealization, which suggests that there is no self maintenance of convection at that time: the convective activity is only forced by the surface instability. In terms of parameterization, this promotes
the idea that a prognostic closure of convection would not be necessary in this case (see Donner and Phillips 2003 for further discussion on this aspect of continental convection). The diurnal cycle of precipitating convection over land, analyzed by Guichard et al. (2004), is characterized by similar surface forcings during the day, but a weaker initial stratification (allowing deeper cumuli to form in the afternoon). It diverges from our case, in that the convection continues after the surface fluxes vanish (presumably due to the self-organization associated with some precipitating convection cases). Thus, the nocturnal phase of this type of convection cannot be represented by the present model. 5. Evaluation of updraft properties The previous two sections have evaluated the model performances with respect to the turbulent fluxes and mean variables (including cloud structure). The 1D framework allows further comparisons with observational (or LES) data, from which one can test whether the parameterization is based on sound concepts and closures. The present model critically relies on the diagnosis of the updraft ascent. The updraft properties with height are now discussed, focusing on the BOMEX case, for which the value chosen for t has been satis-
15 MAY 2004
CHEINET
1103
FIG. 7. Mean core properties with height from BOMEX: (a) ul , (b) qt , (c) ql , (d) u9y , and (e) w (also with the vertical velocity obtained for the cloudy updraft in the run with N 5 2). Line styles are indicated in the legends.
factorily evaluated. A quantitative evaluation would require a specific treatment of the LES data (in order to sort the convective parcels), which is out of the scope of the present study. The updraft properties can still be indirectly evaluated against the available LES data, including the mean core properties with height and the variability among the in-cloud variables. Results shown are averaged over the sixth hour of simulation. a. Mean core properties Figure 7 shows the model predictions for the mean core properties, for which LES data are available. Core parcels are defined as those saturated, ascending, and positively buoyant. The excesses in the conserved variables (u9l and q9t ) are in remarkable agreement with the LES. A zero lateral entrainment rate would lead to constant u l and q t with height. Conversely, with infinite lateral entrainment, the core properties would match the environment. Hence, the parameterized lateral exchanges are determinant in producing these realistic predictions (Figs. 7a and 7b). Interestingly, the mean core total water content agrees well with the LES in the cloud lower levels. Together with the mean state difference noted on Fig. 2, one sees that q9t is larger in the LES than in the model, as already suggested. The mean core buoyancy (and to a lesser extent, the liquid water content) are underestimated compared to the KNMI LES (Figs. 7c and 7d). It will
be shown below that some of the most extreme core parcels are missed by the model, which explains this underestimation. Note however that Siebesma et al. (2003) report a relatively large scatter among LES for the vertical velocity and nonconserved properties (q l and u y ) of cores. Besides, the model mean state is slightly warmer than the LES (the difference being approximately 0.2 K at z 5 1250 m; Fig. 2e). The differences between the model and the LES may thus involve a combination of the following reasons: the choice of a particular LES, some deficiencies in the parameterization of the plumes (e.g., PDF at the surface, closures in the ascent equations), or differences in the predicted mean states (that would indirectly imply the above discrepancies). The mean core vertical velocity is in good agreement with the LES. This result deserves some attention, because an accurate diagnosis of the vertical velocity in convective plumes is important in terms of convection parameterization. As will be discussed below, the vertical velocity of each model updraft increases and then decreases with height in the cloud layer. Averaging w over the buoyant updrafts does not lead to this behavior. Although in the model, each individual convective parcel follows (1), apparently, the mean core does not. Physically, one expects that subensemble effects are smaller for each model updraft compared to the mean core (see also the discussion of C1 related to his Fig. 5), so the ascent equations may not be the same. Math-
1104
JOURNAL OF THE ATMOSPHERIC SCIENCES
ematically, the nonlinearity of (1) may imply that these equations require different closures a, b, and e according to the entities to which they are applied. In other words, the equations (closures) used for parameterizing the ascent of a convective entity critically depend upon what is defined as the convective entity. Accordingly, the subscript ‘‘core’’ hereafter denotes that the closures a, b, and e are considered for the application of (1) to the mean core. Siebesma et al. (2003) analyze the thermodynamic properties obtained by applying the ascent equations (1) directly to the mean core properties (diagnostic evaluation of the bulk-ensemble approach). They use a slightly different closure (i.e., ecore 5 1/z) and evaluate various closures for acore and bcore . They find that (acore 5 1, bcore 5 1) leads to overestimate the mean core vertical velocity (compared to their LES) by almost a factor of 2. In the simulation with N 5 2 (which comes to a bulkensemble mass-flux scheme in the cloud layer), the cloudy updraft is parameterized with (1), closures being (a 5 1, b 5 1) and (2). The vertical velocity of this updraft does not suffer the severe deficiency noted by Siebesma et al. (Fig. 7e). The comparison is however not direct, because there are some differences in the mean environmental profiles. Besides, the closure on ecore chosen in their study is significantly smaller (at all heights in the cloud layer) than the closure obtained through (2). The sensitivity of the ascent equations to both aspects needs to be assessed before conclusions on acore and bcore can be drawn. b. In-cloud variability Our multiple mass flux approach structurally accounts for the variety among updrafts (noting that, like statistics over the LES domain, it does not distinguish the heterogeneities inside each physical cloud from the cloudto-cloud variability). For example, at each level, it provides an idealized subgrid statistical distribution of the thermodynamical variables. This aspect of the model predictions is ignored in the above bulk-ensemble analysis. We now consider the LES and model statistical distributions at z 5 1250 m, chosen as representative of the cloud layer. LES data is considered at only one time step, which is backed up by the good agreement between these data and the detailed distributions analysis of Wang and Stevens (2000). The correlations between w and various thermodynamical variables are shown in Fig. 8. First, analyzing the LES data, it appears that the core parcels cover only a very small fraction of the domain (several tens of LES grid points; see also Fig. 2) and have well-defined properties compared to the clear environment. The departures from mean in all the variables increase with w. A parcel with a large q l (low u l , large q t ) has experienced a large buoyancy gain (through latent heat release), which may have been converted into vertical motion provided that the parcel remained isolated along its as-
VOLUME 61
cent. Hence the correlation between w and the other thermodynamic properties supports the idea that the faster moving convective parcels are less diluted along their ascent. Overall, the in-cloud variability at the considered level can be adequately viewed as the manifestation of the variety among (and inside) the ascending parcels, consistent with the deep tropical convection study of Lin and Arakawa (1997). The model predictions for the updrafts (that form a line; see C1) are in good agreement with the LES. The clear environment value is not represented, as it is always within the scatter of the LES environmental parcels. The alignment that characterizes clouds and cores is reproduced, with exactly the same slope. The model line is always within the LES scatter of core and cloud parcels. The model updrafts are closer to LES cores than LES cloudy noncore parcels, as the latter may not be representative of the convective plumes (Siebesma and Cuijpers 1995). The apparent shift to lower values of u9y and u9l may be attributed to a different mean state between the model and the LES. The fact that the model predicts the same correlation as the LES suggests that the ascent equations produce realistic updraft dynamics. Besides, it is found that the predicted ranges for the thermodynamic properties of the convective parcels are in relatively good agreement with the LES. This tends to support the model assumption, that the convective parcels ascent can be parameterized irrespective of the physical structures in which the parcels are embedded. In order to quantify this variability with height, we have compared the vertical velocity variance of w in the model and in the LES (Fig. 9a). More than one-half of the LES variance of w is due to the turbulence in the environment. The model does not describe this component, so it underestimates the total variance of w. This is of minor importance, since w9 2 is not a model prognostic variable, and the environmental turbulence is associated with negligible thermodynamic fluxes. In the model, 90% of the total variance of w is due to the updrafts. This in-cloud contribution is in good agreement with the LES counterpart as reported by De Roode and Bretherton (2003). Figure 9b shows the standard deviations of w, u l , and q t among the model updrafts (scaling the differences among updrafts). Consistent with the diagnostic evaluation performed by Neggers et al. (2002), these quantities generally agree with their LES counterparts (order of magnitude, increase with height). Hence, the model not only reproduces the mean core properties, but it is also capable of reproducing the major part of the variability among the convective parcels of a cumulus field. One noted discrepancy between the model and the LES is that the model ignores the ø20% most extreme core events (Fig. 8). Considering the conserved variables, all the cloud parcels exhibit well defined departures from the mean environment. As a result, the extreme core events do not have a major contribution to the statistics of u l and q t that are well simulated by the
15 MAY 2004
CHEINET
1105
FIG. 8. Correlations between w and (a) q9t , (b) q l , (c) u9l , and (d) u9y at z 5 1250 m from BOMEX. One symbol represents one LES grid box, sorted according to core (open circle), cloud (cross), and clear (dot). Model updrafts form the full lines (see C1).
model (see above). However, the noncore cloud parcels have rather small q l and u9y , so the extreme core parcels have nonnegligible contributions to the statistics of these latter quantities. This explains the underestimations noted above for the mean core averages of q l and u9y . This feature is even more important for the vertical fluxes, as extreme core parcels combine the strongest values of w and the strongest departures from the mean environment. Hence, the model underpredicts the liquid water and buoyancy fluxes (Figs. 9c and 9d). According to our results, about one-half of these fluxes is built by the extreme core parcels. As noted above, these deficiencies may reveal some parameterization issues in the updrafts initiation or in the ascent equations. However, it has been demonstrated that these issues only marginally alter the model prognostic behavior in the two cases tested here. The above discrepancies illustrate the very strong sensitivity of some particular fields (e.g., fluxes of nonconserved variables) to the plume properties. In turn, the plume properties at one level critically depend on how the buoyancy force and the lateral exchanges modulate along the plumes ascent, that is, far below that level. In other words, the thermodynamic PDFs at a given level strongly depend upon lower-level physics,
and in that sense, are nonlocal. Hence, the parameterized PDFs in cumulus atmospheres should account for these nonlocal aspects (e.g., through prognostic or diagnostic equations of the higher-order statistical moments). The difficulty of the task is discussed by Larson et al. (2002). They show that many PDFs, diagnostically fitted on BOMEX data, underestimate the liquid water flux. This feature is a matter of concern, especially for the parameterizations that use PDFs as cornerstone closures for deriving cumulus layers properties like the cloudiness and/or the vertical mixing (e.g., Bougeault 1981; Bechtold et al. 1995; Golaz et al. 2002). 6. Size-distributed cumuli The above study clearly shows that the model reproduces many aspects of the cumulus convection, with respect to the cloud thermodynamics and to the induced turbulent fluxes. Hence the model can be used as an idealized tool to assess some aspects of the cumulus convection that may not be easily diagnosed with LES or observational data. This is, for example, the case for the properties of cumuli as sorted according to the height they reach. In the model, the updrafts that form the cloud all condensate at 500 m. They can be sorted into classes
1106
JOURNAL OF THE ATMOSPHERIC SCIENCES
VOLUME 61
FIG. 9. BOMEX second-order moments with height: (a) variance of w, with its incloud component (LES data after De Roode and Bretherton 2003), (b) standard deviations among model updrafts for w, u l and q t , (c) Lw9q9 l , and (d) C pw9u9y .
of cloud height between (n 2 1) 3 200 and n 3 200 m, with n 5 1, 6. This section analyzes the classes properties, focusing on the possible implications of the results on cumulus convection analysis and modeling. Nitta (1975), Soong and Ogura (1976), and Esbensen (1978) analyze various aspects of the cloud population in the BOMEX case. These studies are purely diagnostic, they use specific cloud models, large scale forcings and spectral decompositions, but they provide a valuable basis for qualitative comparison. a. Properties of updraft classes Figure 10 shows the properties of the classes, including in the subcloud layer, where they are not saturated. The mass flux is rather constant with height throughout the subcloud layer. The physical picture is here at odds with Tiedtke (1989), according to which the mass flux profile is linear from the cloud-base value to zero at the surface. In the parameterization package of an NWP model, the mass flux profile in the subcloud layer controls the interactions between the cloud and the subcloud layers, with direct impacts on the surface layer ventilation. The discrepancy noted above would thus deserve further studies in order to be clarified. For
now, we may note that Siebesma et al. (2003) and Brown et al. (2001) suggest that the subcloud layer should be comparable to a dry convective boundary layer (not cloud topped), for which the present scheme has been satisfactorily evaluated (C1). Each updraft class slightly slows just before reaching cloud base. This is consistent with the positive thermal stratification met there (see C1). Accordingly, the vertical velocity variance predicted by the model has a local minimum at cloud base, in agreement with LES data (Fig. 9a; Sommeria 1976). Immediately above cloud base, the model predicts a sharp decrease of the cloud mass flux with height. This maximum clearly relates to the small clouds that stop just above cloud base. It is discussed as such in the BOMEX analysis of Nitta (1975) and Esbensen (1978), but it is not simulated by the LES. Reasons for this discrepancy have not been investigated. Figure 10h also suggests that the most powerful updrafts, which are responsible for the exchanges with the free troposphere, have a rather small contribution to the total convective mass flux at cloud base (Nitta 1975; Soong and Ogura 1976). The same feature is obtained for the cloudy updraft in the simulation with N 5 2, and the mean state has been found to be reasonable in that simulation. Although tempting
15 MAY 2004
CHEINET
at that point, it would be speculative to deduce from these results that the convective activity can be represented without parameterizing the smaller clouds (see below). In the bulk cloud layer, the mass flux through the cloudy updrafts agrees well with the mass flux carried by cloudy (or core) parcels in the LES (Fig. 10h). It decreases with height, whereas each class accelerates with height (Fig. 10c) along most of its ascent [consistently with the observations of Warner (1970)]. The model updrafts clearly overshoot their level of neutral buoyancy (Fig. 10a). As an updraft approaches its maximum height, its vertical velocity rapidly decreases, whereas the lateral entrainment it experiences increases (Fig. 10d). This positive feedback between deceleration and dilution comes from the closure (2), and is associated with strongly nonlinear updraft ascents with height (already discussed above). Lin and Arakawa (1997) report a comparable result for subensembles of plumes in a deep convection simulation with a cloud resolving model. Carpenter et al. (1998) perform a trajectory analysis of numerically generated congestus cumuli and obtain consistent conclusions. Accordingly, in the model, very different convective behaviors result from relatively small differences in the thermodynamic properties at cloud base. Only the strongest updrafts reach the upper cloud levels. Despite their small fractional coverage (Fig. 10g), these updrafts determine the strong thermodynamic fluxes in the upper cloud levels, and are thus essential modulators of the convection and its interaction with the free troposphere (e.g., Soong and Ogura 1976). Figure 10d shows that these strongest updrafts remain relatively isolated along their ascent, as reported in fair weather cumuli (Kollias et al. 2001) or congestus cumuli (Heymsfield et al. 1978; Carpenter et al. 1998). The lateral entrainment rate of the most powerful updrafts is weaker than the bulk-ensemble lateral entrainment rate. This means that the lateral entrainment rate to apply in the bulk-ensemble approach should strongly decrease with height (and may even change sign) in order to reproduce the mean updraft properties at cloud upper levels (see Swann 2001, for further discussions). Warner (1970) claimed that the model (1), with a fixed e, could not predict simultaneously the cloud-top height and the in-cloud liquid water content in the bulk cloud layer. In his view, the plumes that determine the mean liquid water content also determine the cloud top. His argument, thus, specifically addresses the bulk-ensemble applications of (1), and is not relevant to the present multiple mass flux approach. Precisely, his conclusions were challenged by Weinstein (1971) and Cotton (1971), arguing that the entraining plume model only applies to the ‘‘actively rising towers’’ of the cloud (see also Lin and Arakawa 1997). Consistently with Warner results, at z 5 1250 m, the mean in-cloud liquid water content is about 0.4 g kg 21 , but reaches 0.65 g kg 21 in the strongest model updrafts (Fig. 10b), that determine the
1107
cloud-top height. The experimental results of Warner (1970) and Lin and Arakawa (1997) can thus be interpreted as qualitative validations of the entrainment closure (2), according to which faster plumes remain more isolated. In all cases, our results suggest that the ascent equations used in a mass flux parameterization critically depend upon what kind of updraft is represented (e.g., bulk-ensemble versus multiple mass flux approaches). b. Heat and moisture budgets This section analyzes the contributions of each updraft class to the transport of heat and moisture. Hereafter, the temperature variations refer to u l , in order to account for the forthcoming evaporation of cumulus liquid water in its environment (Yanai et al. 1973). Due to the surface forcings, the net effect of one updraft, integrated over height, is to moisten and warm the atmosphere. However, as apparent in Figs. 10e and 10f, this effect is not homogeneous with height, because it results from two terms that both modulate with height (e.g., Nitta 1975; Soong and Ogura 1976). First, each updraft contributes to the environmental downdraft, which advects dry and warm air from above. Second, the air deposited from the updraft into the cloud edges (here, the environment) induces a moistening and cooling (if u9l is negative, as in dry overshooting updrafts and cloudy updrafts). This deposit occurs both through the lateral exchanges and when the updraft stops. Figure 10 suggests that each cloudy updraft induces a net drying–warming tendency along most of its ascent, while it cools and moistens the levels where it slows and stops. The convective tendency at one level results from the combination of the updraft effects. Figure 11 shows the convective moisture tendency, split into components induced by the noncloudy updrafts, small cloudy updrafts, and bigger cloudy updrafts. Results are averaged over the 12th hour of simulation, as this time closely approximates a steady state (Fig. 11a). The convection structure is almost unchanged compared to the sixth hour, so Fig. 10 is qualitatively relevant. The noncloudy updrafts efficiently moisten the subcloud layer, warm the surface levels, and cool the cloud base (in analogy with the dry convective boundary layer). The clouds dry and warm the upper part of the subcloud layer [in qualitative agreement with Esbensen (1978)]. In the cloud lower levels, the cooling–moistening tendencies induced by the small forced cumuli counteract the warming–drying effect due to the higher updrafts (Fig. 11b; Sommeria 1976). This results in a net warming– moistening effect, which balances the large scale forcings (Soong and Ogura 1976). In the trade wind inversion layer, the convection effect is dominated by a strong cooling–moistening tendency, as tropospheric air is progressively incorporated into the cumulus layer (vertical entrainment). The overturning is active in the inversion layer only, where it brings some penetrating updrafts back into the conditionally unstable layer.
1108
JOURNAL OF THE ATMOSPHERIC SCIENCES
VOLUME 61
FIG. 10. Properties of subensembles from BOMEX presented according to the detraining height from cloud base: (a) u9y , (b) q l , (c) w, (d) e, (e) contributions to Lw9q9 l ; (f ) contributions to C pw9u9l ; (g) cumulative contributions to cloud cover; (h) cumulative contributions to mass flux. Line styles are indicated in the legends.
This analysis qualitatively agrees with the results of Soong and Ogura (1976, e.g., their Fig. 16). For example, they recognize that the larger clouds relieve the smaller ones in carrying moisture upward. It is also consistent with the results discussed in the ARM case above, with respect to the respective roles of subcloud layer mixing, small, and larger clouds. However, since the BOMEX case is steady state, the subcloud, forced, and well-developed convection stages are concurrent. The steady state obtained in the BOMEX case arises from the imposed large-scale forcings (in particular the large-scale subsidence), which maintain the trade wind inversion (e.g., Nitta 1975). Interestingly, the subtropical large-scale subsidence is induced by the deep cumuli over the intertropical convergence zone (ITCZ). In a way, the Hadley cell (trade wind cumuli favor deeper convection in the ITCZ) has a small-scale counterpart over the subtropical oceans; that is, small forced cumuli favor the development of trade wind cumuli. Expectedly, the large-scale vertical motion is found to be well correlated with the cumulus population (e.g., Yanai et al. 1976).
c. Interactions between updrafts Arakawa and Schubert recognize that the various cloud sizes influence each other through modifications of the environment (felt by lateral entrainment). They parameterize these interactions (their so-called kernel). In our model, these interactions are not parameterized; they are accounted for in the course of integration (indeed, they can be considered simultaneous at the steady state). This aspect of the model is comparable to the socalled relaxed version of the Arakawa–Schubert scheme (Moorthi and Suarez 1992). The model framework allows a comprehensive assessment of these interactions, by first noting that a drier–warmer environment reduces the updraft strength, because the entrained air reduces the latent heat release, that is, the buoyancy production (e.g., Sommeria and LeMone 1978). In full agreement with Esbensen (1978), the results discussed above suggest that small clouds support the development of bigger clouds, by maintaining a favorable (moist and cold) environment for their ascent. On the other hand, the big clouds dry and warm their lower-level environment, by
15 MAY 2004
CHEINET
FIG. 10. (Continued )
FIG. 11. (a) Total moisture tendency from BOMEX, with convective and large-scale forcings components; (b) split of the convective tendency according to updraft types (cloudy updrafts are distinguished according to whether they reach 1100 m).
1109
1110
JOURNAL OF THE ATMOSPHERIC SCIENCES
which they tend to suppress the small clouds. Such feedback loops are characteristic of a size-distributed population of cumuli. According to Zhao and Austin (2003), they can be captured with the buoyancy sorting parameterization. It is here found that they can be produced by a multiple mass-flux approach as well. At the steady state, there is a balance between the mixing tendency and the surface and large-scale forcings. This backs up the way Arakawa and Schubert close their multiple mass flux approach at cloud base. They derive the cloud population by assuming that it is in quasi equilibrium with the large-scale forcings, given the mean profiles. In our experiment, the forcings are fixed, and the thermodynamic profiles and cloud population adapt one to the other as the simulation converges towards a quasi-steady state. The choice of the closure N 5 2 strongly constrains the cloud population (e.g., no intermediate size clouds). Thus, the mean profiles are to change, in order to allow the cloudy updraft to penetrate the trade wind inversion (and balance the large scale forcings). The fact that the predicted mean profiles remain reasonable is presumably a case-dependent feature, and larger values of N should be preferred. As another illustration on how the steady state convergence and the cloud populations are linked, we may consider the cloud lower levels in BOMEX. The tendency induced by the smaller clouds balances the tendencies induced by the compensative (and possibly the large-scale) subsidence(s). However, according to our model, the smaller clouds have smaller departures from mean. Thus, the BOMEX mean state can be maintained only if the small clouds cover a larger fractional area. This provides a basis for explaining the systematic decrease of the cloud fraction with height in the steady state (shallow) cumulus convection in the subtropics. 7. Summary and conclusions The present study is dedicated to evaluating the parameterization introduced in Cheinet (2003) in cases of moist convection. This model is based on a multiple mass flux approach, where the convective motions in the surface layer are sorted into a spectrum of N updrafts with different initial conditions. The updraft vertical motions (and other properties) are taken to be Gaussian distributed, and the closure (variance of the vertical velocity in the surface layer) relies on the local free convection similarity. The entraining plume equations (1) used for the updrafts ascent are closed by means of a time scale t that is interpreted as the plume turnover time. This closure causes faster updrafts to experience less lateral entrainment. In our simulations, t is empirically derived based on observational arguments. It is shown that the model predictions are moderately sensitive to it. As in C1, the closure on the lateral entrainment is found to control the vertical entrainment rate in the inversion layers. It is also shown that N can be decreased to about 10 without significantly altering the
VOLUME 61
results, in both dry and moist convection cases (see C1). Taking N 5 2 in moist convection cases is found to be an interesting academic case, in which one updraft mixes the subcloud layer, while the other forms the cumulus (which reduces to a bulk-ensemble parameterization). The same surface-generated convective plumes are used to compute the mixing tendencies in the subcloud and in the cloud layers, so the model provides a unified description of the subcloud and the cloud mixing. Besides, it structurally accounts for the variety among updrafts at one level. Since the updrafts are modeled with a finite fractional area, the model yields an idealized subgrid statistical distribution of the thermodynamic variables. This means that the convective cloudiness (saturated updrafts) is handled consistently with the mixing. In that sense, the present model overcomes some issues met in many operationally used convection parameterizations (e.g., closure at cloud base, description of cloudiness associated with convection). It is also noteworthy that the time step and vertical resolutions used in this study match mesoscale modeling requirements, and do not prohibit the use in large-scale models. On the other hand, the present approach does not represent midlevel convection, stratiform cloud formation, momentum transport, and shear-induced mixing. Thus, it may be used operationally in large scale models only in conjunction with parameterizations dedicated to represent these processes. a. Model evaluation The single-column modeling framework is used to test the model in two cases of nonprecipitating moist convection. The model is evaluated in the case of steady-state oceanic convection, and in the nonsteady case of the diurnal cycle of continental convection. The results are compared with an LES run with the same imposed large-scale forcings. We have analyzed the updraft properties in the oceanic case. The mean core properties with height are mainly reproduced by the model. The updraft variability is realistic; it increases with height, as simulated by the LES. These results are confirmed by a thorough analysis of the joint properties among cloudy convective parcels as predicted by the model and the LES at one level in the bulk cloud layer. The satisfactory simulation of convective plume properties with height reinforces the idea that the model produces an adequate convection dynamics in the cases considered. It is however found that the model misses the most extreme plumes. The in-core averages and the fluxes of liquid water and buoyancy are thus underestimated. These discrepancies are thought to relate to the updraft ascent parameterization (initiation in the surface layer, ascent equations). They do not alter the model prognostic behavior. Overall, this outstanding evaluation of the updraft properties emphasizes the soundness of the model basic views. In terms of mean state predictions, the model does
15 MAY 2004
CHEINET
not describe the remnant clouds formed while the plumes dilute in their environment, so it underestimates some cloud related quantities. Yet it satisfactorily reproduces the cumulus convection (cloud structure, associated fluxes) in the oceanic case. The quasi-steady state that characterizes the case is reproduced in very good agreement with the LES, as well as the subcloud layer ventilation. There is a slight water storage in the subcloud layer in the first six hours, presumably due to an underestimated closure on the correlation between w and q t . In the continental convection case, the vertical entrainment is somewhat overestimated in the early morning, as the scaling proposed by C1 for t in the dry convection regime is not used. In the late morning and afternoon, our purely diagnostic model is able to represent the growing cumulus layer. Furthermore, it is shown that the thermodynamic structure of the subcloud and cloud layers qualitatively agrees with the LES during the whole simulation, even when the vertical resolution is degraded. These results are quite significant, especially in light of the performances of other one dimensional models tested in the same cases. The model proposes a unified description of surfacegenerated convection (dry and cloudy), based on the diagnostic of the convective plumes (Fig. 1). In light of the results discussed here and in C1, the following conclusion arises. In both dry and moist convection cases, prognostic evaluations show that the model reproduces the plumes thermodynamics with height, as well as the evolution that they induce on the mean variables. Hence, our results suggest that many aspects of the surfacegenerated convection can be efficiently parameterized and predicted through this comprehensive framework. b. Implications Due to its original structure, the present model provides new insights into the parameterization and analysis of cumulus convection. The fact that our model behaves realistically in the case of continental convection suggests that no prognostic closure is required for that case. The closure used in some convection parameterizations, that the convective mass-flux is linear with height in the subcloud layer, is not supported by the present results. Reasons and implications for this discrepancy probably deserve further investigation. Besides, the model results show that although each convective parcel may follow a set of ascent equations, averages of conditionally sampled parcels (e.g., core, cloud) may follow another set of equations or closures. This means that the ascent equations primarily depend upon the convective entity to which they are applied. Illustratively, it is suggested that the lateral entrainment rate in the bulk-ensemble approach must decrease with height. The well-known argument of Warner (1970) is interpreted in that sense. Finally, it is found that the thermodynamic properties of the model updrafts are modulated by lateral exchanges along their
1111
ascent. At a given level in the cloud layer, the thermodynamic statistical distributions depend upon nonlocal (lower levels) physics, and may not be parameterized in terms of purely local parameters, as done in some mixing or cloudiness parameterizations. This is notably true for the nonconserved quantities (e.g., buoyancy flux parameterization). In order to close their multiple mass flux approach at cloud base, Arakawa and Schubert (1974) assume that the cloud population is in quasi equilibrium with the large-scale forcings, given the mean profiles. The alternative closure used here is based on the surface and subcloud layer processes. Our results demonstrate that this choice is sound to represent the surface-generated shallow cumulus convection. Besides, the model proposes a comprehensive framework for assessing how the convective plume population and the mean profiles can adapt to the large-scale forcings. It is suggested that the dry convection and forced cumuli regimes are two preconditioning steps toward the development of mature cumuli. In steady-state cases, the different types of clouds coexist, and interact indirectly through the mean environment. The cloud lower levels are modulated by a feedback loop: the smaller cumuli favor the development of bigger clouds, while the bigger clouds (and possibly the synoptic forcing) tend to suppress the small clouds. In the trade wind inversion, the strongest cumuli, that experience less dilution along their ascent, balance the large-scale subsidence. The latter forcing is due to the deep convection in the ITCZ, which hints an analogy with the Hadley cell. As a further illustration, simple arguments suggest that, under nondisturbed (a fortiori suppressed) conditions, shallow cumulus convection can maintain as a steady state only if the cloud fraction decreases with height. The above qualitative arguments clearly stress the need for further quantitative evaluations based on observational data. In terms of modeling perspectives, the model has been extended to represent precipitating surface-generated convection. The rain in each updraft can be parameterized in full consistency with the present framework, from the updraft vertical velocity (through the fallout, see above). This version reasonably simulates the transition from shallow nonprecipitating to deeper precipitating convection as the tropospheric humidity increases. It also reproduces the daily part of the diurnal cycle of precipitating cumuli over land (Guichard et al. 2004). The extension of the model to represent downward-generated plumes (due to radiative cooling, e.g., in stratocumulus, or due to evaporative cooling, e.g., in precipitating cumuli) is now considered. Acknowledgments. This work was performed in the context of the European Project on Cloud Systems (EUROCS; financially supported by the European Union), which relates to the GEWEX Cloud System Study (GCSS) international effort. I wish to thank P. Bechtold, P. Bougeault, M. Koehler, P. Siebesma, and the three
1112
JOURNAL OF THE ATMOSPHERIC SCIENCES
anonymous reviewers for their helpful comments. I would also like to thank the EUROCS team for fruitful discussions, in particular G. Lenderink and R. Neggers, who also provided the KNMI LES data. REFERENCES Arakawa, A., and W. Schubert, 1974: Interaction of a cumulus cloud ensemble with the large-scale environment. Part I. J. Atmos. Sci., 31, 674–701. Asai, T., and A. Kasahara, 1967: A theoretical study of the compensating downward motions associated with cumulus clouds. J. Atmos. Sci., 24, 487–496. Bechtold, P., J. W. M. Cuijpers, P. Mascart, and P. Trouilhet, 1995: Modeling of trade wind cumuli with a low-order turbulence model: Toward a unified description of Cu and Se clouds in meteorological models. J. Atmos. Sci., 52, 455–463. ——, E. Bazile, F. Guichard, P. Mascart, and E. Richard, 2001: A mass-flux convection scheme for regional and global models. Quart. J. Roy. Meteor. Soc., 127, 869–886. Betts, A., 1976: Modeling subcloud layer structure and interactions with a shallow cumulus layer. J. Atmos. Sci., 33, 2363–2382. ——, and M. Miller, 1986: A new convective adjustment scheme. Part 2: Single-column tests using gate wave, BOMEX, ATEX, and arctic air-mass data sets. Quart. J. Roy. Meteor. Soc., 112, 693–709. Bougeault, P., 1981: Modeling the trade-wind cumulus boundary layer. Part I: Testing ensemble cloud relations against numerical data. J. Atmos. Sci., 38, 2414–2428. Brown, A., 1999: Large-eddy simulation and parameterization of the effect of shear on shallow cumulus convection. Bound.-Layer. Meteor., 91, 65–80. ——, and Coauthors, 2001: Large-eddy simulation of the diurnal cycle of shallow cumulus convection over land. Quart. J. Roy. Meteor. Soc., 127, 1–19. Carpenter, R., K. Droegmeier, and A. Blyth, 1998: Entrainment and detrainment in numerically simulated cumulus congestus clouds. Part III: Parcel analysis. J. Atmos. Sci., 55, 3440–3455. Cheinet, S., 2003: A multiple mass-flux parameterization for the surface-generated convection. Part I: Dry plumes. J. Atmos. Sci., 60, 2313–2327. ——, and J. Teixeira, 2003: A simple formulation for the eddy-diffusivity parameterization of cloudy boundary layers. Geophys. Res. Lett., 30, 1930, doi:10.1029/2003GL017377. Cotton, W., 1971: Comments on ‘‘Steady-state one-dimensional models of cumulus convection.’’ J. Atmos. Sci., 28, 647–648. De Roode, S., and C. Bretherton, 2003: Mass-flux budgets of shallow cumulus clouds. J. Atmos. Sci., 60, 137–151. Del Genio, A., and M.-S. Yao, 1988: Sensitivity of a global climate model to the specifications of convective updraft and downdraft mass fluxes. J. Atmos. Sci., 45, 2641–2668. Donner, L. J., and V. T. Phillips, 2003: Boundary layer control on convective available potential energy: Implications for cumulus parameterization. J. Geophys. Res., 108, 4701, doi:10.1029/ 2003JD003773. Emanuel, K., 1991: A scheme for representing cumulus convection in large-scale models. J. Atmos. Sci., 48, 2313–2335. Esbensen, S., 1978: Bulk thermodynamic effects and properties of small tropical cumuli. J. Atmos. Sci., 35, 826–837. Fritsch, J., and C. Chappell, 1980: Numerical prediction of convectively driven mesoscale pressure systems. Part I: Convective parameterization. J. Atmos. Sci., 37, 1722–1734. Golaz, J.-C., V. Larson, and W. Cotton, 2002: A PDF-based model for boundary layer clouds. Part I: Methods and model description. J. Atmos. Sci., 59, 3540–3551. Grant, A., 2001: Cloud-base fluxes in the cumulus-capped boundary layer. Quart. J. Roy. Meteor. Soc., 127, 407–421. Gregory, D., 2001: Estimation of entrainment rate in simple models of convective clouds. Quart. J. Roy. Meteor. Soc., 127, 53–72.
VOLUME 61
——, and P. Rowntree, 1990: A mass flux convection scheme with representation of cloud ensemble characteristics and stabilitydependent closure. Mon. Wea. Rev., 118, 1483–1506. Guichard, F., and Coauthors, 2004: Modelling the diurnal cycle of deep precipitating convection over land with CRMs and SCMs. Quart. J. Roy. Meteor. Soc., in press. Heymsfield, A., P. Johnson, and J. Dye, 1978: Observations of moist adiabatic ascent in northeast Colorado cumulus congestus clouds. J. Atmos. Sci., 35, 1689–1703. Jakob, C., and A. Siebesma, 2003: A new subcloud model for massflux convection schemes: Influence on triggering, updraft properties and model climate. Mon. Wea. Rev., 131, 2765–2778. Johari, H., 1992: Mixing in thermals with and without buoyancy reversal. J. Atmos. Sci., 49, 1412–1426. Kain, J., and J. Fritsch, 1990: A one-dimensional entraining/detraining plume model and its application in convective parameterization. J. Atmos. Sci., 47, 2784–2802. Kollias, P., B. Albrecht, R. Lhermitte, and A. Savtchenko, 2001: Radar observations of updrafts, downdrafts and turbulence in fairweather cumuli. J. Atmos. Sci., 58, 1750–1766. Kuo, H. L., 1965: On the formation and intensification of tropical cyclones through latent heat release by cumulus convection. J. Atmos. Sci., 22, 40–63. Lappen, C.-L., and D. Randall, 2001: Toward a unified parameterization of the boundary layer and moist convection. Part I: A new type of mass-flux model. J. Atmos. Sci., 58, 2021–2036. Larson, V., J.-C. Golaz, and W. Cotton, 2002: Small-scale and mesoscale variability of scalars in cloudy boundary layers: Joint probability density functions. J. Atmos. Sci., 59, 3519–3539. Lenderink, G., and Coauthors, 2004: Diurnal cycle of cumulus clouds over land: A single column model intercomparison study. Quart. J. Roy. Meteor. Soc., in press. Lin, C., and A. Arakawa, 1997: The macroscopic entrainment processes of simulated cumulus ensemble. Part II: Testing the entraining-plume model. J. Atmos. Sci., 54, 1044–1053. Manabe, S., J. Smagorinsky, and F. Strickler, 1965: Simulated climatology of a general circulation model with a hydrologic cycle. Mon. Wea. Rev., 93, 769–798. McNider, R., and F. Kopp, 1990: Specification of the scale and magnitude of thermals used to initiate convection in cloud models. J. Appl. Meteor., 29, 99–104. Moorthi, S., and M. Suarez, 1992: Relaxed Arakawa–Schubert: A parameterization of moist convection for general circulation models. Mon. Wea. Rev., 120, 978–1002. Neggers, R., A. Siebesma, and H. Jonker, 2002: A multiparcel model for shallow cumulus convection. J. Atmos. Sci., 59, 1655–1668. ——, H. Jonker, and A. Siebesma, 2003: Size statistics of cumulus cloud populations in large-eddy simulations. J. Atmos. Sci., 60, 1060–1074. Nicholls, S., and M. LeMone, 1980: The fair weather boundary layer in GATE: The relationship of subcloud fluxes and structure to the distribution and enhancement of cumulus clouds. J. Atmos. Sci., 37, 2051–2067. Nitta, T., 1975: Observational determination of cloud mass flux distributions. J. Atmos. Sci., 32, 73–91. Norris, J., 1998: Low cloud type over the ocean from surface observations. Part II: Geographical and seasonal variations. J. Climate, 11, 383–403. Ogura, Y., and H.-R. Cho, 1973: Diagnostic determination of cumulus cloud populations from observed large-scale variables. J. Atmos. Sci., 30, 1276–1286. Pruppacher, H., and J. Klett, 1997: Microphysics of Clouds and Precipitation. Kluwer Academic Publishers, 954 pp. Randall, D., K.-M. Xu, R. Somerville, and S. Iacobellis, 1996: Singlecolumn models and cloud ensemble models as links between observations and climate models. J. Climate, 9, 1683–1697. Raymond, D., and A. Blyth, 1986: A stochastic mixing model for nonprecipitating cumulus clouds. J. Atmos. Sci., 43, 2708–2718. Ridout, J., and C. Reynold, 1998: Western Pacific warm pool region
15 MAY 2004
CHEINET
sensitivity to convective triggering by boundary layer thermals in the NOGAPS atmospheric GCM. J. Climate, 11, 1553–1573. Siebesma, A. P., 1998: Shallow cumulus convection. Buoyant Convection in Geophysical Flows, E. J. Plate et al., Eds., Kluwer Academic Publishers, 441–486. ——, and J. Cuijpers, 1995: Evaluation of parametric assumptions for shallow cumulus convection. J. Atmos. Sci., 52, 650–666. ——, and Coauthors, 2003: A large eddy simulation intercomparison study of shallow cumulus convection. J. Atmos. Sci., 60, 1201– 1219. Simpson, J., and V. Wiggert, 1969: Models of precipitating cumulus towers. Mon. Wea. Rev., 97, 471–489. Sommeria, G., 1976: Three-dimensional simulation of turbulent processes in an undisturbed trade wind boundary layer. J. Atmos. Sci., 33, 216–241. ——, and M. LeMone, 1978: Direct testing of a three-dimensional model of the planetary boundary layer against experimental data. J. Atmos. Sci., 35, 25–39. Soong, S.-T., and Y. Ogura, 1976: A determination of the trade-wind cumuli population using BOMEX data and an axisymmetric cloud model. J. Atmos. Sci., 33, 992–1007. Squires, P., and J. Turner, 1962: An entraining jet model for cumulonimbus updraughts. Tellus, 14, 422–434. Swann, H., 2001: Evaluation of the mass-flux approach to parameterizing deep convection. Quart. J. Roy. Meteor. Soc., 127, 1239–1260. Taylor, G., and M. Baker, 1991: Entrainment and detrainment in cumulus clouds. J. Atmos. Sci., 48, 112–121.
1113
Tiedtke, M., 1989: A comprehensive mass flux scheme for cumulus parameterization in large-scale models. Mon. Wea. Rev., 117, 1779–1800. ——, 1993: Representation of clouds in large-scale models. Mon. Wea. Rev., 121, 3040–3061. Turner, J., 1962: The ‘starting plume’ in neutral surroundings. J. Fluid. Mech., 13, 356–368. Wang, S., and B. Stevens, 2000: Top-hat representation of turbulence statistics in cloud-topped boundary layers: A large eddy simulation study. J. Atmos. Sci., 57, 423–441. Warner, J., 1970: On steady-state one-dimensional models of cumulus convection. J. Atmos. Sci., 27, 1035–1040. Weinstein, A., 1971: Comments on ‘‘Steady-state one-dimensional models of cumulus convection.’’ J. Atmos. Sci., 28, 648–651. Wetzel, P., 1990: A simple parcel method for prediction of cumulus onset and area-averaged cloud amount over heterogeneous land surfaces. J. Appl. Meteor., 29, 516–523. Wilde, N., R. Stull, and E. Eloranta, 1985: The ICL zone and cumulus onset. J. Appl. Meteor., 24, 640–657. Yanai, M., S. Esbensen, and J.-H. Chu, 1973: Determination of bulk properties of tropical cloud clusters from large-scale heat and moisture budgets. J. Atmos. Sci., 30, 611–627. ——, J.-H. Chu, T. Stark, and T. Nitta, 1976: Response of deep and shallow tropical cumuli to large-scale processes. J. Atmos. Sci., 33, 976–991. Zhao, M., and P. Austin, 2003: Episodic mixing and buoyancy-sorting representation of shallow convection: A diagnostic study. J. Atmos. Sci., 60, 892–912.