micromachines Article
A Multiplexed Microfluidic Platform for Bone Marker Measurement: A Proof-of-Concept Patricia Khashayar 1,2,3 , Ghassem Amoabediny 4,5 , Bagher Larijani 6 , Morteza Hosseini 1 , Rik Verplancke 2 , David Schaubroeck 2 , Steven Van Put 2 , Farideh Razi 7 , Michel De Keersmaecker 8 , Annemie Adriaens 8 , Stefan Goemaere 9 , Tom Fiers 9 and Jan Vanfleteren 2, * 1 2 3 4 5 6 7 8 9
*
Nanobiotechnology Department, Faculty of New Sciences & Technologies, University of Tehran, Tehran 1439957131, Iran;
[email protected] (P.K.);
[email protected] (M.H.) Center for Microsystems Technology, Imec and Ghent University, Gent-Zwijnaarde 9052, Belgium;
[email protected] (R.V.);
[email protected] (D.S.);
[email protected] (S.V.P.) Osteoporosis Research Center, Endocrinology and Metabolism Clinical Sciences Institute, Tehran University of Medical Sciences, Tehran 1411413137, Iran Department of Biotechnology, Faculty of Chemical Engineering, School of Engineering, University of Tehran, Tehran 1417614418, Iran;
[email protected] Nanobiotechnology Department, Research Center for New Technology in Life Sciences Engineering, University of Tehran, Tehran 1417614418, Iran Endocrinology and Metabolism Research Center, Endocrinology and Metabolism Clinical Sciences Institute, Tehran University of Medical Sciences, Tehran 1411413137, Iran;
[email protected] Diabetes Research Center, Endocrinology and Metabolism Clinical Sciences Institute, Tehran University of Medical Sciences, Tehran 1411413137, Iran;
[email protected] Department of Analytical Chemistry, Ghent University, Krijgslaan 281 S12, Ghent 9052, Belgium;
[email protected] (M.D.K.);
[email protected] (A.A.) Unit for Osteoporosis and Metabolic Bone Diseases, Ghent University Hospital, Ghent 9052, Belgium;
[email protected] (S.G.);
[email protected] (T.F.) Correspondence:
[email protected]; Tel.: +32-9-26-45-360
Academic Editor: Kwang W. Oh Received: 21 February 2017; Accepted: 19 April 2017; Published: 25 April 2017
Abstract: In this work, we report a microfluidic platform that can be easily translated into a biomarker diagnostic. This platform integrates microfluidic technology with electrochemical sensing and embodies a reaction/detection chamber to measure serum levels of different biomarkers. Microfabricated Au electrodes encased in a microfluidic chamber are functionalized to immobilize the antibodies, which can selectively capture the corresponding antigen. An oxidative peak is obtained using the chronoamperometry technique at room temperature. The magnitude of the response current varies linearly with the logarithmic concentration of the relative biomarker and, thus, is used to quantify the concentration of the relative biomarker in serum samples. We demonstrated the implementation, feasibility and specificity of this platform (Osteokit) in assaying serum levels of bone turnover markers (BTMs) using osteocalcin (limits of detection (LOD) = 1.94 ng/mL) and collagen type 1 cross-linked C-telopeptide (CTX) (LOD = 1.39 pg/mL). To our knowledge, this is the first such device fabricated to measure BTMs. Our results also showed that the sensitivity of Osteokit is comparable with the current states of art, electrochemiluminescence (ECLIA). Keywords: biosensor; bone turnover markers; osteoporosis; gold nanoparticles; electrochemistry
1. Introduction Current trends towards theranostics and the provision of personalized diagnostic therapy tailored to an individual has emphasized the need for inexpensive point-of-care (PoC) devices capable of
Micromachines 2017, 8, 133; doi:10.3390/mi8050133
www.mdpi.com/journal/micromachines
Micromachines 2017, 8, 133
2 of 13
performing rapid analysis, with small volumes of sample, minimum number of assay steps, and no need for highly-skilled personnel for routine checkups and patient screening [1,2]. This is of greater importance in remote and resource-limited settings, such as developing countries, where access to central laboratories is limited and, thus, on-site diagnosis can lead to improved health status and quality of life [3]. This is while enzyme-linked immunosorbent assay (ELISA), electrochemiluminescence immunoassay (ECLIA), and other prevailing laboratory techniques in the current state of the art for biomarker quantification do not lend themselves well to miniaturization for application at the point-of-care [4]. Thus, performing rapid measurements to monitor several biochemical parameters at the same time to reach an accurate medical decision still remains a largely unmet challenge. In this context, multiplexed detection of different biomarkers using microfluidic systems has attracted considerable interest [5,6]. This is mainly due to the fact that such systems provide a promising method to miniaturize immunoassays, which have played an important role in the diagnosis of different diseases in the past 50 years. Such devices also provide added benefits, such as portability, increased reliability, improved sensitivity, decreased analysis time, minimal reagent consumption, and parallel processing [7,8]. In other words, the high surface-to-volume ratio of the microfluidic channels facilitates faster and more sensitive reactions, which is of great importance in meeting the major demands for the on-site detection of various analytes [9,10]. Among different techniques used to generate signals in these platforms, electrochemical methods have shown the most suitable results because of their simple instrumentation, easy signal quantification, rapid response, low cost, portability, reliability, good sensitivity, and excellent selectivity [11,12]. The sensitivity of biosensor platforms depend on various parameters, such as the microfluidic flow, as well as the specific surface area, conductivity, and charge transfer properties of the sensing platform [9]. In this regard, functionalized gold nanoparticles (AuNPs) have shown promising results in improving the performance of the system through facilitating the electron exchange between the antibody complex and the electrode [13]. Despite the recent improvements in the development of multiplexed microfluidic-based systems, especially in personalized cancer diagnostics, a clear challenge still resides in the integration and operation of such microfluidic platforms for the measurement of different biomarkers in clinical practice [14–16]. As such, a few attempts have been made in the past for the development of new screening assay methods for bone turnover markers (BTMs); yet none have succeeded to fully satisfy the criteria needed for their application in clinical practice [17]. BTMs are important determinants of bone strength as they demonstrate the bone-remodeling rate by assessing bone resorption and formation [18,19]. Monitoring the efficacy of bone-active drugs is currently the most promising clinical application for BTMs since, by using this technique, the changes in BTM levels in response to therapeutic interventions would be measurable in a shorter time interval (as early as 4–12 weeks) [20]. Moreover, the pre-treatment levels are also useful in identifying the patients who will most benefit from the treatment. This is while “the routine use of biochemical markers of bone turnover in clinical practice is not generally recommended, as these tests vary in sensitivity and specificity and their appropriate role in patient management is not yet known [21].” Thus, measuring bone mineral density (BMD) using dual energy X-ray absorptiometry (DXA) is currently considered as the gold standard for osteoporosis diagnosis despite its proven setbacks [22,23]. In the present work, we report the design and fabrication of a sensitive microfluidic platform integrated with electrochemical sensing that can easily be translated into a protein biomarker diagnostic. To our knowledge, this is the first microfluidic-based device designed as a step toward developing a PoC system for the measurement of several BTMs.
Micromachines 2017, 8, 133
3 of 13
2. Results Micromachines 2017, 8, 133
3 of 12
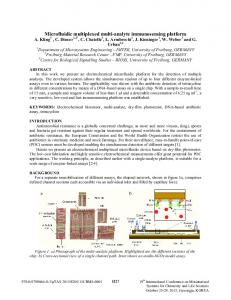
2.1. Osteokit Characterization Having a well-dispersed layer of AuNPs with a uniform size distribution is the first and a critical step ainwell-dispersed surface modification. The deposition time size and distribution scan rate are, therefore, Having layer of AuNPs with a uniform is the first and properly a critical controlled to modification. assure sufficient deposition distribution AuNPs [24]. The step in surface The deposition timeand and uniform scan rate are, therefore, of properly controlled to electrochemical ofand the uniform stepwisedistribution fabrication of AuNPs the electrochemical sensor chip was studied assure sufficient behavior deposition [24]. The electrochemical behavior of using cyclicfabrication voltammetry Compared with electrodes, the as-prepared the stepwise of the (CV). electrochemical sensor chipconventional was studied using cyclic voltammetry (CV). AuNPs-based electrode-on-chip showed athe 7.5-fold larger current responseelectrode-on-chip [24]. Compared with conventional electrodes, as-prepared AuNPs-based showed As mentioned in our previous a 7.5-fold larger current response [24]. article, the adsorption of the antibodies onto the working electrode was associated with a article, significant reductionofof conductive of the electrode working As mentioned in our previous the adsorption thethe antibodies onto area the working electrode, as well a considerable increase its electric resistance, resulting in a significant was associated withas a significant reduction of theinconductive area of the working electrode, as well as in theincrease magnitude the electrochemical response current [25]. This in suggests successful adecrease considerable in its of electric resistance, resulting in a significant decrease the magnitude of immobilization of antibodies on the electrode. the electrochemical response current [25]. This suggests successful immobilization of antibodies on Later, the presence of antigens on the working electrode resulted in an increase in the the electrode. double-layer capacitance and, hence, reduced electrode electrochemical behavior of in the solution Later, the presence of antigens on the working resulted in an increase thetest double-layer proportionaland, to the concentration of the antigen. This was used as the for the determination of capacitance hence, reduced electrochemical behavior of the testbasis solution proportional to the antigen concentration and plotting the calibration curve. concentration of the antigen. This was used as the basis for the determination of antigen concentration and plotting the calibration curve. 2.2. Calibration of the Osteokit 2.2. Calibration of the Osteokit The electrochemical response of the Osteokit was studied as a function of different The electrochemical response of the was studied as a function of different concentrations concentrations of osteocalcin (Oc) andOsteokit collagen type 1 cross-linked C-telopeptide (CTX) using of osteocalcin (Oc) andtechnique collagen type 1 cross-linked C-telopeptide (CTX) using(0.1 chronoamperometry chronoamperometry under identical experimental conditions mM potassium technique under identical experimental conditions (0.1 mM potassium [K3 Fe(CN) 6 ] as ferricyanide [K3Fe(CN) 6] as a redox probe, at a potential of 0.65 V for 15ferricyanide s), respectively. It is noted athat redox at consumption a potential of of 0.65 V for 15 s), respectively. It is 100 noted that the sample consumption of theprobe, sample this prototype chip was only μL, which is less than traditional this prototype chip was only 100 µL, which is less than traditional methods (10 mL). methods (10 mL). The antigen concentrations; this is The magnitude magnitudeof ofresponse responsecurrent currentratio ratiodecreased decreasedwith withincreasing increasing antigen concentrations; this due to the of immune complexes between the antibody and antigen, a hindrance is due to formation the formation of immune complexes between the antibody and resulting antigen, in resulting in a in electron charge transfer rate at the electrode–electrolyte interface (Figure 1). The magnitude hindrance in electron charge transfer rate at the electrode–electrolyte interface (Figure 1). The of current ratio in the Osteokit with a CTX was linearly dependent on the magnitude of current ratio in the Osteokit with immunoelectrode a CTX immunoelectrode was linearly dependent on logarithmic CTXCTX concentration with an an R2 Rof2 of 0.78. the logarithmic concentration with 0.78.The Thecorrelation correlationcoefficient coefficientwas was 0.99 0.99 and and the the limits of of detection detection (LOD) (LOD) and andlimits limits of ofquantification quantification(LOQ) (LOQ)were werecalculated calculatedto tobe be1.39 1.39pg/mL pg/mL and and 4.22 pg/mL, respectively. pg/mL, respectively.
(a)
(b)
Figure 1. Calibration curve plotted based on the electrochemical response studies of the Osteokit as a Figure 1. Calibration curve plotted based on the electrochemical response studies of the Osteokit as function of (a) CTX concentration (1–1000 pg/mL); and (b) Oc concentration (1–100 ng/mL). a function of (a) CTX concentration (1–1000 pg/mL); and (b) Oc concentration (1–100 ng/mL).
Similarly, the Osteokit with an Oc immunoelectrode exhibited a near-linear relationship between the current ratio and logarithmic Oc concentration from 1 to 100 ng/mL (R2 = 0.93) (Figure 1). The LOD was experimentally found to be 1.94 ng/mL. The system had a LOQ of 5.89 ng/mL with a correlation coefficient of 0.96. The Osteokit demonstrated a large dynamic range, which was on the order of the physiological concentration of the studied antigens in the serum (reference range of Oc: 9–42 ng/mL; CTX: 25–1008
Micromachines 2017, 8, 133
4 of 13
Similarly, the Osteokit with an Oc immunoelectrode exhibited a near-linear relationship between the current ratio and logarithmic Oc concentration from 1 to 100 ng/mL (R2 = 0.93) (Figure 1). The LOD was experimentally found to be 1.94 ng/mL. The system had a LOQ of 5.89 ng/mL with a correlation coefficient of 0.96. Micromachines 2017, 8,demonstrated 133 4 of 12 The Osteokit a large dynamic range, which was on the order of the physiological concentration of the studied antigens in the serum (reference range of Oc: 9–42 ng/mL; pg/mL). Notably, the titration revealed an revealed apparent an sub-linearity at the low end the CTX: 25–1008 pg/mL). Notably, curve the titration curve apparent sub-linearity at theoflow dynamic range for both analytes, which could be attributed to the translation of the actual number of end of the dynamic range for both analytes, which could be attributed to the translation of the actual antigensofcaptured the AuNPs. number antigensby captured by the AuNPs.
2.3.Selectivity Selectivityand andCross-Reactivity Cross-Reactivity 2.3. Inorder orderto to check the selectivity and potential cross-reactivity, the measurements were In check the selectivity and potential cross-reactivity, the measurements were performed performed for a constant concentration of the opposite antigen along with Parathyroid hormone for a constant concentration of the opposite antigen along with Parathyroid hormone (PTH). (PTH). The Osteokit a minimum change the baseline value (3%–5%) withrespect respecttotoOc Oc The Osteokit showedshowed a minimum change fromfrom the baseline value (3%–5%) with (100 pg/mL) and PTH (100 pg/mL) as interferents on the CTX immunoelectrode (Figure 2). Similarly (100 pg/mL) and PTH (100 pg/mL) as interferents on the CTX immunoelectrode (Figure 2). there wasthere no remarkable response when the Oc immunoelectrode was exposed to CTX (100 to ng/mL) Similarly was no remarkable response when the Oc immunoelectrode was exposed CTX and PTH (100 ng/mL) (minimum change of 3%–5% from baseline). These results show that the (100 ng/mL) and PTH (100 ng/mL) (minimum change of 3%–5% from baseline). These results show Osteokit is selective for both CTX and Oc and no crosstalk occurs between the channels. that the Osteokit is selective for both CTX and Oc and no crosstalk occurs between the channels.
(a)
(b)
Figure 2. (a) Electrochemical response measured for the Oc sensor incubated with CTX (100 ng/mL), Figure 2. (a) Electrochemical response measured for the Oc sensor incubated with CTX (100 ng/mL), PTH (100 ng/mL), and Oc (100 ng/mL); and (b) the response measured for CTX sensor incubated PTH (100 ng/mL), and Oc (100 ng/mL); and (b) the response measured for CTX sensor incubated with with the Oc (100 pg/mL), PTH (100 pg/mL), and CTX (100 pg/mL). the Oc (100 pg/mL), PTH (100 pg/mL), and CTX (100 pg/mL).
2.4. Stability and Repeatability 2.4. Stability and Repeatability The results showed a remarkable reproducibility of the results, tested by the application of the The results showed a remarkable reproducibility of the results, tested by the application of same concentration of either antigen on different platforms (relative standard deviation (RSD) lower the same concentration of either antigen on different platforms (relative standard deviation (RSD) than 8%). The sensing interface was used ten times without sacrificing its detection efficiency. When lower than 8%). The sensing interface was used ten times without sacrificing its detection efficiency. the sensing surfaces were regenerated for more tests, the detection of either antigen was not as When the sensing surfaces were regenerated for more tests, the detection of either antigen was not as sensitive as before. This might be the result of the immobilized antibody losing its activity after sensitive as before. This might be the result of the immobilized antibody losing its activity after being being used repeatedly. used repeatedly. To investigate the stability of the chips, the sensing interfaces were stored at room temperature To investigate the stability of the chips, the sensing interfaces were stored at room temperature for for a week. Compared with the relatively fresh sensing interfaces, the signal of the conserved ones a week. Compared with the relatively fresh sensing interfaces, the signal of the conserved ones only only decreased by 8.1% for the Oc immunoelectrode and 8.8% for the CTX immunoelectrode. The decreased by 8.1% for the Oc immunoelectrode and 8.8% for the CTX immunoelectrode. The small small decrease may be ascribed to the partial degradation of the immobilized antibody. decrease may be ascribed to the partial degradation of the immobilized antibody. 2.5.Real RealSerum SerumMeasurements Measurements 2.5. Tocompare comparethethe sensitivity of platform our platform withcurrent the current gold standard real To sensitivity of our with the gold standard methods,methods, real samples samplesserum) (human serum) previously tested with ECLIA used as the analyte (Ocwere samples were (human previously tested with ECLIA were usedwere as the analyte (Oc samples obtained obtained from the Endocrinology and Metabolism Research Institute (EMRI) laboratory and CTX from the Endocrinology and Metabolism Research Institute (EMRI) laboratory and CTX samples were samples were obtained from Universitair ziekenhuis (UZ) Hospital). The serum of ten patients whose Oc and CTX levels were recently measured using ECLIA was used. Using the trend function and based on the calibration curve, the concentration of Oc and CTX in the tested samples were calculated according to the obtained current. The results were then compared. According to the results, the coefficients of variation for ECLIA and Osteokit were calculated to be 4.6% and 3.7% for
Micromachines 2017, 8, 133
5 of 13
obtained from Universitair ziekenhuis (UZ) Hospital). The serum of ten patients whose Oc and CTX levels were recently measured using ECLIA was used. Using the trend function and based on the calibration curve, the concentration of Oc and CTX in the tested samples were calculated according to the obtained current. The results were then compared. According to the results, the coefficients of variation for ECLIA and Osteokit were calculated to be 4.6% and 3.7% for Oc, and 6.4% and 7.7% for CTX. Micromachines 2017, 8, 133 between the results of the sensor and that of ECLIA was investigated and 5 of 12 The correlation the Micromachines 2017, 8, 133 5 of 12 2 results are depicted as the correlation and Bland and Altman plots in Figures 3 and 4. The R of the trend line line in in the the correlation correlation plot plot was was 0.85 0.85 for for Oc Oc and and 0.87 0.87 for for CTX. CTX. This This indicates indicates that that the the Osteokit Osteokit trend trend line in the correlation plot was 0.85 for Oc and 0.87 for CTX. This indicates that the Osteokit has an an acceptable acceptable correlation correlation with with ECLIA ECLIA in measuring both CTX. However, However, the the results results are are has in measuring both Oc Oc and and CTX. has anacceptable acceptablefor correlation with ECLIA inCTX. measuring both Oc and CTX. However, the results are more lower serum levels of This could be explained due to the fact that the more acceptable for lower serum levels of CTX. This could be explained due to the fact that the more acceptable serum levels of CTX. This between could be explained due to and the fact ratio that the calibration curve for waslower plotted for CTX CTX concentrations and 1000 1000 pg/mL pg/mL for calibration curve was plotted for concentrations between 11 and and the the ratio for calibration curve was plotted for CTX concentrations between 1 and 1000 pg/mL and the ratio for higher concentrations concentrations required requiredfor forthe thecomparison comparisonwas wasextrapolated. extrapolated.The The sub-linearity curve higher sub-linearity of of thethe curve at higher concentrations required for the comparison was extrapolated. The sub-linearity of the curve at the higher concentrations also aggravated the accuracy concerns. the higher concentrations also aggravated the accuracy concerns. at the higher concentrations also aggravated the accuracy concerns.
(a) (a)
(b) (b)
Figure 3. Plot displaying (a) the correlation between Osteokit and ECLIA results for Oc measurement Figure 3. Plot Plot displaying displaying (a) (a) the the correlation correlation between between Osteokit Osteokit and and ECLIA ECLIA results results for Oc measurement Figure 3. (b) chronoamperometric response for Oc measurement using Osteokit and ECLIA.for Oc measurement (b) chronoamperometric response for Oc measurement using Osteokit and ECLIA. (b) chronoamperometric response for Oc measurement using Osteokit and ECLIA.
(a) (a)
(b) (b)
Figure 4. Plot displaying (a) the correlation between Osteokit and ECLIA results for CTX measurement Figure 4. Plot displaying response (a) the correlation between Osteokit and ECLIAand results for CTX measurement (b) chronoamperometric for CTX measurement using Osteokit ECLIA. Figure 4. Plot displaying (a) the correlation between Osteokit and ECLIA results for CTX measurement (b) chronoamperometric response for CTX measurement using Osteokit and ECLIA. (b) chronoamperometric response for CTX measurement using Osteokit and ECLIA.
3. Discussion 3. Discussion 3. Discussion The improvement of detection sensitivity and analysis time has been a key motivation for the The improvement of detection sensitivity and analysis time lowers has been a consumed key motivation for the development of analytical microsystems [26,27]. Size reduction thea reagent The improvement of detection sensitivity and analysis time has been key motivation for and the development of analytical microsystems [26,27]. Size reduction lowers the consumed reagent and sample volume and, thus, could help with portability of the device. This, however, may compromise development of analytical microsystems [26,27]. Size reduction lowers the consumed reagent and sample volume and,of thus, could help with portability the device. This,This however, may compromise the detection the could device, especially for lowof rates [28]. is while the maximum sample volumelimit and, thus, help with portability offlow the device. This, however, may compromise the detection limitforofreliable the device, especially for low of flow [28]. This is while allowed pressure operation and integrity the rates microfluidic device limitsthe themaximum flow rate allowed pressure for reliable operation and integrity of the microfluidic device limits the flow rate [29]. [29]. In this perspective, we developed an electrochemical biosensor for BTM measurement in a In this perspective, we developed an electrochemical biosensor BTM or measurement a microfluidic chip architecture for identifying individuals at risk of for fracture monitoring inthe microfluidic chip architecture for identifying individuals at risk of fracture or monitoring the treatment process in osteoporotic patients. In order to improve sensitivity and specificity, we treatment process in osteoporotic patients. In order to improve sensitivity and specificity, we
Micromachines 2017, 8, 133
6 of 13
the detection limit of the device, especially for low flow rates [28]. This is while the maximum allowed pressure for reliable operation and integrity of the microfluidic device limits the flow rate [29]. In this perspective, we developed an electrochemical biosensor for BTM measurement in a microfluidic chip architecture for identifying individuals at risk of fracture or monitoring the treatment process in osteoporotic patients. In order to improve sensitivity and specificity, we addressed the following parameters: (1) (2)
Successful and functional immobilization of the antibodies on sensor surfaces to perform reagentless detection; Amplification of reaction signals.
It is known that adsorption of proteins onto bulk metal surfaces leads to their denaturation and loss of bioactivity [30]. Unstable immobilization of antibodies on the electrode surface, as well as nonspecific binding, are the main factors that determine the detection limit for an immunoassay [31]. Our previous work attempted to address this issue [25]. In the presented work, modification of the gold electrode with AuNPs provided a suitable environment for stable immobilization of BTMs, while keeping their bioactivity in a microreactor environment and, thus, supporting high-quality and low-background electrochemical sensing. The biomarkers were immobilized on the treated surface through covalent binding using cross-linkers. Immobilization of proteins based on the formation of covalent bonds is among the most widely used techniques, mainly because of the stable nature of the resulted complex [32,33]. The efficiency of this technique was confirmed, as mentioned earlier [25]. Moreover, the use of high specific antibodies as a bioaffinity sensing interface not only improved the selectivity, but also allowed detection with significantly low amounts of the sample. (3)
Flawless flow of the solutions in the microchannels during the preparation steps and electrochemical process.
In this work, the analyte flowed in and out of the chamber, achieved through capillary motion and pressure-driven flow, generated by a syringe. The flow behavior mainly depended on the inlet flow rate and, thus, the liquid was introduced into the system with a constant volumetric flow rate [34]. Very low and high flow rates were observed to be associated with gas bubble introduction in the channels. Moreover, the burst test results showed that the inlet flow rates higher than 5000 µL/min may fail either at the point of attachment of the interconnect, or at the interface between the two bonded parts [35]. Liquid movement was also controlled by different fluidic resistance within the parallel channel network. During the experiment, the pressurized solution mainly flowed into the reaction chamber as the fluidic resistance of other channels, which were filled with air at this point, was higher than that of the reaction chamber. The adopted design was also accountable for reduced back flow and improved the movement of the solutions without gas bubbles being trapped in the channels and affecting the detection signal. Moreover, a wash step was performed at the beginning to ensure the removal of the remaining air in the interconnects, channels, and chambers. This is important because when hydraulic pressure is applied, gas bubbles remaining in the interconnection holes can be trapped in the reaction chamber and cause significant problems in the detection process by disturbing the fluid flow or drying out the electrodes [36]. (4)
Reduced reagent adsorption in channel walls and the absence of cross-talk due to the diffusion of electroactive products from one electrode to the neighboring one.
The use of the microchannels provided controlled functionalization of the sensing platform, while preventing possible contamination and crosstalk. One of the main purposes of the fabrication of microfluidic devices with feature size in the micrometer range is to reduce the quantity of the needed sample. In this regard, non-specific adsorption of proteins to channel walls should be prohibited as it may cause an unpredictable reduction in the
Micromachines 2017, 8, 133
7 of 13
concentration of the assay component and slow its transport rate. As a result, controlled protein adsorption characteristics of the material used in the microchannel structure is of great importance. These materials should also provide proper channel enclosure without deforming small features or clogging the channels during the bonding process [37,38]. To overcome these concerns, we used tape both as a glue to bond layers and as a channel structure [35]. The double-sided tape provided a uniform thickness for keeping the bonding yield high, preventing leakage, delamination, and channel rupture under applied pressure. It also enabled the design of low feature size patterns. On the other hand, the combination of the adhesive tape and the milled holder offered a means to rapidly fabricate prototype devices and, thereafter, the refinement of the design to meet the required performance was easier. In other words, using the tape, channel fabrication became rapid and simple. Moreover, the modular design of the chip allowed us to easily modify the microfluidic manifold and the electrochemical-sensing components separately. Thus, modification was no longer an outlandish task. 4. Materials and Methods 4.1. Chemicals L-glutathione reduced (GSH), chloroauric acid (HAuCl4 ·3H2 O), b-1-ethyl-3-(3-dimethylamonipropyl) carbodiimide (EDC), sulfo-N-hydroxysuccinimide (s-NHS), bovine serum albumin (BSA), phosphate buffered saline (PBS), PBS-Tween 20, and potassium hexacyanoferrate (III) (K3 [Fe(CN)6 ]) were purchased from Sigma-Aldrich (Diegem, Belgium). PBS solution (10 mM, NaCl 0.138 M, KCl 0.0027 M, pH 7.4), and PBS-Tween 20 were prepared by dissolving one package in 1000 mL of de-ionized (DI) water. PBS was used to prepare the antibody (10 µg/mL) and antigen solutions. All other solvents and chemicals were of analytical grade. For functionalization of the electrodes, monoclonal osteocalcin antibody (ab133612) and full-length osteocalcin protein (ab152231) was obtained from Abcam Co. (Cambridge, UK). Anti-collagen type I antibody (MAB1340) and human collagen type I (CC050) were obtained from Merck Chemicals (Overijse, Belgium). Double-coated polyester diagnostic tape 9965 (3M Medical Specialties, St. Paul, MN, USA) was used. It consisted of a 0.05 mm opaque white polyester film coated on both sides with a 0.02 mm neutral pressure sensitive acrylate adhesive and supplied between two clear, 0.05 mm silicone-coated polyester release liners. 4.2. Apparatus All electrochemical experiments were performed using a computer-controlled Autolab PGSTAT101 (Metrohm, Antwerpen, The Netherlands). Cyclic voltammetry (CV) and chronoamperometry were utilized to characterize the stepwise fabrication of the device and the antigen quantification. An electroactive substance, 0.1 mM K3 [Fe(CN)6 ] containing 0.01 M NaCl, was used as the electrolyte solution for electrochemical readings. All electrochemical measurements were performed in a standard three-electrode format at room temperature. In order to check the accuracy of the system, ECLIA immunoassay (Elecsys 2010 autoanalyzer, Roche Diagnostics GmbH, Mannheim, Germany) was used to measure serum levels of Oc (intra- and interassay coefficients of variation 1.2%–4.0% and 1.7%–6.5%, respectively) and CTX (intermediate precision CV of