Statistica Sinica 20 (2010), 1683-1707
A MULTIVARIATE CONTROL CHART FOR DETECTING INCREASES IN PROCESS DISPERSION Chia-Ling Yen and Jyh-Jen Horng Shiau National Chiao Tung University
Abstract: For signalling alarms sooner when the dispersion of a multivariate process is “increased”, a multivariate control chart for Phase II process monitoring is proposed as a supplementary tool to the usual monitoring schemes designed for detecting general changes in the covariance matrix. The proposed chart is constructed based on the one-sided likelihood ratio test (LRT) for testing the hypothesis that the covariance matrix of the quality characteristic vector of the current process, Σ, is “larger” than that of the in-control process, Σ0 , in the sense that Σ − Σ0 is positive semidefinite and Σ 6= Σ0 . Assuming Σ0 is known, the LRT statistic is derived and then used to construct the control chart. A simulation study shows that the proposed control chart indeed outperforms three existing two-sided-test-based control charts under comparison in terms of the average run length. The applicability and effectiveness of the proposed control chart are demonstrated through a semiconductor example and two simulations. Key words and phrases: Average run length, likelihood ratio test, multivariate process dispersion, one-sided test, two-sided test.
1. Introduction Statistical process control (SPC) is a fundamental methodology consisting of many techniques that have been proven useful in quality and productivity improvement of products and processes. Among these techniques, the control chart is the featured technique for keeping processes in control by monitoring key quality characteristics of interest. When the process is changed by some assignable causes, an effective control chart should be able to detect the changes quickly and signal requests for investigation. If assignable causes are found, then subsequent corrective actions should be taken to eliminate them. There are two phases of control charting in SPC, Phase I and Phase II. In Phase I analysis, historical observations are analyzed to determine whether the process is in control, to understand the sources of variation in the process, and to estimate the in-control parameters of the process. In contrast, Phase II control charting aims at on-line monitoring of future observations by using the control limits, constructed based on the estimated in-control process parameters from Phase I, to determine if the process continues to be in control. The objective of
1684
CHIA-LING YEN AND JYH-JEN HORNG SHIAU
Phase II analysis is to quickly detect process changes. Obviously, a successful Phase II process monitoring depends heavily on a successful Phase I analysis. In this study, we focus on Phase II control charts. To avoid letting the estimation error in Phase I interfere with the comparisons of various control charts, Phase II studies usually assume that the characteristics of the in-control process are known. Practitioners used to monitor just one quality characteristic for a process, but processes are now getting so complicated that multivariate SPC techniques, which can provide simultaneous scrutiny of several possibly correlated process variables, are in great need for monitoring and diagnostic purposes. The purpose here is to propose a multivariate control chart designed for detecting dispersion “increases” for processes in which two or more quality characteristics need to be monitored simultaneously. For two multivariate processes, perhaps there is no way to define precisely which has larger dispersion. However, it is quite natural to say, for two covariance matrices, Σ is “larger” than Σ0 when Σ − Σ0 is positive semidefinite and Σ 6= Σ0 . The proposed control chart is intended for applications in which it is more urgent to signal out-of-control conditions for dispersion increases than other kinds of changes. Consider a multivariate process with p quality characteristics of interest, and suppose that the p × 1 quality characteristic vector X follows a multivariate normal distribution, Np (µ, Σ), with mean vector µ and covariance matrix Σ. For monitoring the process mean vector µ, the Hotelling T 2 chart (Hotelling (1947)) may be the most popular chart. However, the T 2 chart has a notorious drawback in that it is sensitive not only to shifts in the mean µ but also to changes in the covariance matrix Σ (Hawkins (1991, 1993); Mason, Tracy, and Young (1995)). This confounding of “location” and “scale” shifts is clearly not desirable in this setting. Substantial works on SPC methods have been devoted to monitoring the process mean, while relatively little research has addressed the monitoring of process dispersion. However, it has been recognized that shifts in process dispersion can have a significant impact on process monitoring of the mean. Moreover, as pointed out by many authors including Montgomery (2009), monitoring process dispersion has its own importance. For these reasons, various charts have been developed in recent years, including (i) Shewhart-type charts based on the generalized variance by, for example, Alt (1985), Alt and Bedewi (1986), Alt and Smith (1998), and Djauhari (2005); (ii) Shewhart-type charts based on the likelihood ratio test (LRT) by Sakata (1987), Calvin (1994), Levinson, Holmes, and Mergen (2002), and Vargas and Lagos (2007); (iii) multivariate exponentially weighted average (MEWMA) control charts by, for example, Yeh, Huwang and Wu (2004), Reynolds and Cho (2006), Reynolds and Stoumbos (2006), Huwang, Yeh, and Wu (2007), and Hawkins and Maboudou-Tchao
DETECTING INCREASES IN PROCESS DISPERSION
1685
(2008); (iv) multivariate cumulative sum (MCUSUM) control charts by Chan and Zhang (2001) and Runger and Testik (2004); and (v) other schemes different from the above, for example, the Shewhart procedures proposed in Tang and Barnett (1996a,b) based on decomposing the covariance matrix, and the multivariate projection chart proposed by Hao, Zhou, and Ding (2008). For more detail on multivariate control charts, readers are referred to review papers by, for example, Wierda (1994), Yeh, Lin, and McGrath (2006), Bersimis, Psarakis, and Panaretos (2007). Yeh, Lin, and McGrath (2006) reviewed the multivariate control charts for monitoring changes in Σ that were developed between 1990 and 2005; and Bersimis, Psarakis, and Panaretos (2007) reviewed multivariate extensions for all kinds of univariate control charts: multivariate Shewhart-type, MCUSUM-type, and EWMA-type control charts, as well as the multivariate control charts based on Principal Components Analysis (PCA) and Partial Least Squares (PLS). Most of the techniques developed for multivariate dispersion monitoring in the literature are centered on detecting changes of any kind in the covariance matrix. However, for most practitioners, it probably matters more if the process dispersion increases because, when this happens, the quality of products or processes has deteriorated, and unnecessary wastes have been and will continue to be produced. It would definitely be worthwhile to have a multivariate control chart that can detect dispersion increases sooner than control charts designed for monitoring general changes in the covariance matrix. Suppose X is distributed as Np (µ0 , Σ0 ) when the process is in control. We consider testing H0 : Σ = Σ0 vs. H1 : Σ ≥ Σ0 and Σ 6= Σ0 ,
(1.1)
where Σ ≥ Σ0 denotes that Σ − Σ0 is positive semidefinite. Thus the out-ofcontrol condition has the variance of every linear combination of X, var(a0X), greater than or equal to that when the process is in control, where a is any nonzero p × 1 vector. When a process is in control, neither the process mean nor the covariance matrix changes. However, (1.1) does not specify the status of the process mean µ so H0 in (1.1) is not exactly the in-control condition. Nevertheless, we continue to use the term “in control” even when not specifically considering the status of the process mean. In this paper, we present a simple, yet effective, one-sided LRT-based control chart based on the exact likelihood function pertinent to detecting increases in multivariate process dispersion. For (1.1) with Σ0 known, the only work on one-sided tests seems to be Calvin (1994), in which (1.1) is divided into two sequential testing hypotheses and a two-stage control charting scheme is constructed. The process dispersion
1686
CHIA-LING YEN AND JYH-JEN HORNG SHIAU
is considered to have increased only when the control charts of both stages are out of control. In practice, Calvin’s method is more complicated than the usual one-chart scheme. It is important to emphasize that the proposed control chart is not intended to be a substitute for any monitoring scheme that is designed for detecting general changes in the covariance matrix. Instead, it should be used as a supplementary tool with the purpose of earlier detection of dispersion increases so that wastes might be reduced. The rest of the paper is organized as follows. Section 2 describes the proposed control chart in some detail. Section 3 provides a procedure for computing the control limits. Section 4 compares, by simulation, the proposed chart with three existing techniques based on the two-sided tests of H0 : Σ = Σ0 vs. H1 : Σ 6= Σ0 from the perspective of the average run length (ARL). Section 5 gives a semiconductor example and two simulated examples to demonstrate the applicability and the effectiveness of the proposed chart. Section 6 concludes the paper with a brief summary and some remarks. 2. One-Sided LRT-based Control Chart In order to derive the LRT statistic for testing (1.1), we borrow some techniques from Anderson, Anderson, and Olkin (1986), Anderson (1989), and Kuriki (1993), though the model considered in these papers is different from the one considered here. 2.1. One-sided LRT statistic Suppose the in-control process covariance matrix Σ0 is known. At time t, a random sample {Xt1 , . . . , Xtn } is taken from the process, with Xtj , j = 1, . . . , n, independent and identically distributed (i.i.d.) as Np (µ, Σ), where µ and Σ are unknown. To test if the process dispersion increases at time t, we derive the LRT statistic. Let the sample mean and the sample covariance matrix of this sample be, respectively, n ¯ t = 1 Σ Xtj X n j=1
and St =
1 n ¯ t )(Xtj − X ¯ t )0 . Σ (Xtj − X n j=1
(2.1)
Then Bt ≡ nSt has the Wishart distribution with n − 1 degrees of freedom and covariance matrix Σ, denoted Wp (n−1, Σ). The reason for using n instead of the usual n − 1 in the sample covariance matrix St is to simplify the derivation of the LRT of (1.1). Dykstra (1970) proved that St is positive definite with probability 1 if and only if n > p.
DETECTING INCREASES IN PROCESS DISPERSION
Theorem 1. The LRT statistic for testing (1.1) is ∗ p n/2 , for p∗ > 0 Π {di exp [−(di − 1)]} λ = i=1 , 1 , for p∗ = 0
1687
(2.2)
where d1 ≥ · · · ≥ dp > 0 are the roots of |St − dΣ0 | = 0 and p∗ is the number of di > 1. The proof is given in the Appendix. The testing procedure is usually performed by the statistic ∗ p n Σ [(di − 1) − log di ] , for p∗ > 0 T = −2 log λ = . i=1 0 , for p∗ = 0
(2.3)
The rejection region of the test is {T > Tα }, where the critical value Tα is the (1 − α)th quantile of the distribution of T . Since the distribution of T is not easy to derive analytically, one can obtain Tα by Monte Carlo simulation. 2.2. The proposed control charts To construct a control chart based on (2.3), simply take the critical value Tα as the (upper) control limit. That is, if the monitoring statistic T is greater than the control limit Tα , then the process is considered to be out of control. The control limit can be obtained efficiently by a procedure given in the next section. 3. Control Limits In the following, we show how Tα can be computed by generating data from Np (0, Ip ). Since Σ is assumed symmetric positive definite, there exists a unique symmetric positive definite matrix Σ1/2 such that Σ=(Σ1/2 )(Σ1/2 ) (Golub and Van Loan (1989, p. 395)). To Simplify the notation, (Σ1/2 )−1 is denoted by Σ−1/2 . Let Ztj ≡ Σ−1/2 Xtj . Then {Ztj , j = 1, . . . , n} can be considered as a random sample of size n from Np (Σ−1/2 µ, Ip ), if Xtj follows Np (µ, Σ). Thus ¯ t and S (z) ≡ Σ−1/2 St Σ−1/2 are the sample mean and sample ¯t ≡ Σ−1/2 X Z t covariance matrix of the transformed sample, respectively. First, note that (z) nSt is distributed as Wp (n − 1, I¯p ). Second,¯ when the process is in control, ¯ (z) ¯ Σ=Σ0 . Then |St − dΣ0 | = 0 and ¯St − dIp ¯ = 0 have the same roots, since ¯ ¯ ¯ (z) ¯ |St − dΣ0 | = |Σ0 |¯St − dIp ¯ and Σ0 is assumed positive definite. This implies that, when the process is in control, the distribution of the monitoring statistic
1688
CHIA-LING YEN AND JYH-JEN HORNG SHIAU
T based on the eigenvalues of St Σ−1 0 is the same as that based on the eigenval(z) ues of St . Thus, without loss of generality, we can assume that the in-control parameters µ0 = 0 and Σ0 = Ip when studying the distribution of T under Ho . Here is a procedure for approximating the control limit, where N is the number of simulated values of T in one simulation run and b is the number of repeated runs. Procedure 1. (For computing the control limit) Step 1. Input p, n, α, N , and b. Step 2. For t=1 to N , (i) generate n i.i.d. random vectors Xt1 , . . . , Xtn from Np (0, Ip ); (ii) compute St by (2.1); (iii) compute the eigenvalues of St , d1 ≥ · · · ≥ dp ; (iv) compute Tt by (2.3). Step 3. Compute the (1 − α)th sample quantile of {T1 , . . . , TN }. Step 4. Repeat Steps 2−3 b times. Take the average of the b quantiles as the control limit CLp, n, α . The purpose of the replications in Step 4 is to give a more accurate quantile estimate as well as to provide information on the precision of the computed control limit CLp, n, α . For p = 2, 3, 4, n = 5, 10, 15, 20, 25, α = 0.05, 0.01, 0.0027, N = 1, 000, 000, and b = 100, Table 1 gives CLp, n, α and its standard error (in parentheses). We observe the following from this table. • For the same p and α, the larger the n is, the larger is CLp, n, α . • For the same n and α, the larger the p is, the larger is CLp, n, α . • The smaller the α is, the larger is the standard error. This is typical for quantile estimators, especially when the tail is thin. For cases not covered in Table 1, a MATLAB program we used for computing the control limits is available at http://www.stat.nctu.edu.tw/subhtml/ source/teachers/jyhjen.htm. SPC practitioners can compute the control limit by simply inputting the appropriate parameters, p, n, α, N , and b, according to their applications.
DETECTING INCREASES IN PROCESS DISPERSION
1689
Table 1. The control limits of the proposed control chart and their standard errors (in parentheses) for various p, n, and α.
p=2
n=5 n = 10 n = 15 n = 20 n = 25
α = 0.05 3.05397 (0.00073) 3.67012 (0.00083) 3.95820 (0.00071) 4.13514 (0.00083) 4.26165 (0.00076)
α = 0.01 5.74518 (0.00163) 6.51889 (0.00193) 6.87760 (0.00185) 7.10464 (0.00189) 7.26285 (0.00178)
p=3
n=5 n = 10 n = 15 n = 20 n = 25
4.80793 5.69597 6.12026 6.38572 6.57258
(0.00083) (0.00080) (0.00102) (0.00099) (0.00093)
7.92760 (0.00178) 8.99673 (0.00213) 9.50740 (0.00209) 9.82577 (0.00221) 10.05576 (0.00206)
10.48552 11.66028 12.22800 12.58276 12.85012
(0.00341) (0.00355) (0.00377) (0.00404) (0.00396)
p=4
n=5 n = 10 n = 15 n = 20 n = 25
6.64788 7.86886 8.46550 8.84356 9.11189
(0.00096) (0.00104) (0.00096) (0.00120) (0.00121)
10.15678 11.59488 12.29732 12.74062 13.05840
12.95896 14.53483 15.30894 15.79198 16.13724
(0.00436) (0.00442) (0.00382) (0.00487) (0.00431)
(0.00204) (0.00207) (0.00218) (0.00276) (0.00236)
α = 0.0027 8.04116 (0.00337) 8.90371 (0.00352) 9.31402 (0.00345) 9.56986 (0.00378) 9.74458 (0.00361)
4. A Comparative Study In this section, we compare the proposed one-sided LRT-based control chart with three existing charts that are based on some two-sided tests of H0 : Σ = Σ0 vs. H1 : Σ 6= Σ0 in terms of ARL. We do not include some existing charts, such as those by Yeh, Huwang and Wu (2004), Reynolds and Cho (2006), Huwang, Yeh, and Wu (2007), and Hawkins and Maboudou-Tchao (2008), in the performance study, since these are EWMA-type control charts, as opposed to the Shewharttype chart that we propose. 4.1. Two-sided LRT-based control charts The two-sided LRT statistic given in Anderson (2003, p. 439) for testing H0 : Σ = Σ0 vs. H1 : Σ 6= Σ0 can be expressed as ¯ ¯n/2 ¯ exp{− n trSt Σ−1 + pn }. (4.1) λ∗ = ¯St Σ−1 0 0 2 2 Since both St and Σ0 are symmetric and positive definite, from Theorem 4.14 of Schott (2005) and a simple transformation, there exists a nonsingular matrix Z such that St = ZDd Z 0 and Σ0 = ZZ 0 , where Dd = diag(d1 , . . . , dp ) with d1 ≥ · · · ≥ dp being the roots of |St − dΣ0 | = 0. Then (4.1) can be re-expressed as p n pn λ∗ = | Dd |n/2 exp{− trDd + } = Π { di exp [−(di − 1)] } n/2 . (4.2) 2 2 i=1
1690
CHIA-LING YEN AND JYH-JEN HORNG SHIAU
Note that (4.2) (for the two-sided LRT) and (2.2) (for the one-sided LRT) are of the same form. The only difference is that the one-sided LRT only includes those di > 1 in the product while the two-sided LRT uses all di ’s. Unfortunately, the two-sided LRT based on λ∗ is biased. However, by replacing n by n − 1 in (4.1), one can obtain an unbiased two-sided LRT based on the following modified likelihood ratio statistic: ¯(n−1)/2 1 e p(n−1)/2 ¯¯ ¯ exp{− trBt Σ−1 Bt Σ−1 λ∗(mod) = ( ) (4.3) 0 0 }. n−1 2 See Sugiura and Nagao (1968). The control chart based on (4.3) is referred to here as the “two-sided Modified-LRT” control chart. 4.2. A control chart based on decomposition Assuming Σ0 is known, Tang and Barnett (1996a,b) proposed a multivariate Shewhart chart for monitoring H0 : Σ = Σ0 vs. H1 : Σ 6= Σ0 that is based on decomposing Bt /(n − 1) into the sum of a series of independent χ2 statistics. 2 and s2i·1,...,i−1 , Decompose Σ and Bt /(n − 1) the same way, and take σi·1,...,i−1 respectively, to be the conditional population and sample variance of the ith variable given the first i − 1 variables. Also, take Σi,i+1,...,p·1,...,i−1 to be the conditional population covariance matrix of the last p − i + 1 variables given the first i − 1 variables. σ12 and s21 are, respectively, the population and sample variance of the first variable. In addition, let ϑi and Ri (i = 2, . . . , p) denote, respectively, the (p − i + 1) × 1 vectors of population and sample regression coefficients when each of the last p − i + 1 variables is regressed on the (i − 1)th variable while the first i − 2 variables are held fixed. When the current sample of n observations is drawn, an appropriate statistic based on a decomposition is T
(decom)
=
2p−1 ∑
Zj2 ,
(4.4)
j=1
where
]) ( [ (n − 1)s21 2 =Φ , χn−1 σ12 ]) ( [ (n − 1)s2j·1,2,...,j−1 2 −1 2 f or j = 2, . . . , p, Zj = Φ χn−j 2 σj·1,2,...,j−1 ( [ ]) 2 Zp+1 = Φ−1 χ2p−1 (n − 1)s21 (R2 − ϑ2 )0 Σ−1 (R − ϑ ) , 2 2 2,...,p·1 Z12
−1
and, for j = 3, . . . , p, [ ( ]) 2 (R − ϑ ) . Zp+j−1 = Φ−1 χ2p−j+1 (n − 1)s2j−1·1,2,...,j−2 (Rj − ϑj )0 Σ−1 j j 2,...,p·1,...,j−1
DETECTING INCREASES IN PROCESS DISPERSION
1691
Note that Φ−1 (·) is the inverse of the distribution function of N (0, 1) and χ2v [x] ≡ P (χ2v ≤ x) is the distribution function of the χ2 distribution with v degrees of freedom. This decomposition is not unique since it depends on how the p variables are arranged in order. Tang and Barnett (1996a) suggested the variables should be arranged in decreasing order of importance from 1 to p to reflect the relative importance of the variables. When the process is in control, Zj ’s are i.i.d. as N (0, 1) and hence T (decom) is distributed as χ22p−1 . Thus the control chart can be established by plotting T (decom) ’s against the sampling sequence, and an out-of-control alarm is signaled when T (decom) exceeds the control limit, χ22p−1 (1 − α), the (1 − α)th quantile of χ22p−1 . The control charts based on (4.4) is referred to here as the “TBdecomposed” control chart. 4.3. Comparisons We compare the proposed chart with the two-sided LRT, two-sided ModifiedLRT, and TB-decomposed control charts in terms of ARL. Denote the in-control ARL by ARL0 and out-of-control ARL by ARL1 . Let T be the test statistic. To estimate ARL, we first generate N statistics T1 , . . . , TN for a very large number N and then compute the proportion of Ti ’s that exceed the control limit constructed in Section 3 for achieving a preset falsealarm rate α. After repeating the above steps b times, we obtain b proportions. Two estimating procedures can be considered: (i) take the reciprocal of each proportion as an estimate of ARL and then average these b ARL estimates to get the final ARL estimate; (ii) average the b proportions and then take the reciprocal of the average as the ARL estimate. For the first ARL estimator, the standard error can be obtained easily by taking√the sample standard deviation of the b ARL estimates and then dividing it by b. The standard error of the second estimator can be obtained by the following argument. Note that, multiplying each proportion by N , we have b statistics that are i.i.d. binomial(N, θ), where θ is the detecting power, i.e., the probability that T statistic of a randomly selected sample exceeds the control limit. When the process is in control, θ = α, the false-alarm rate. Denote the second ARL [ Since ARL [ is the reciprocal of the maximum likelihood estimator by ARL. estimator (MLE) of θ, then, by the asymptotic efficiency property of MLE, it [ follows a limiting normal distribution with mean can be easily shown that ARL √ 1/θ and standard deviation (1 − θ)/(N bθ3 ). Then the standard error of this
1692
CHIA-LING YEN AND JYH-JEN HORNG SHIAU
ARL estimator can be calculated by [
2
[ (ARL [ − 1) ARL (N b)
]1/2 .
(4.5)
It was found in our simulation study that the difference between the results of the two estimating procedures was negligible. We thus only report the results of the second approach. Assume that the covariance matrix has been “increased” from Σ0 to Σ. As shown before, the distribution of T in (2.3) is invariant in Σ0 . Thus, without loss of generality, we can assume that Σ0 = Ip when simulating the distribution of T . For simplicity, we consider p = 2. To create out-of-control scenarios, express Σ as ] [ √ ∆ ρ ∆1 ∆2 √ 1 , ρ ∆1 ∆2 ∆2 where ∆i ≥ 1, i = 1, 2. This means the variance of the ith quality characteristic has been increased by a factor of ∆i for i = 1, 2, and ρ is the correlation coefficient. It can be easily shown that the eigenvalues of Σ − Σ0 are ] √ 1[ (∆1 + ∆2 − 2) ± (∆1 − ∆2 )2 + 4ρ2 ∆1 ∆2 (4.6) 2 and, under the condition that Σ − Σ0 is positive semidefinite, the range of ρ is restricted by [ ] (∆1 − 1)(∆2 − 1) 1/2 |ρ| ≤ . (4.7) ∆1 ∆2 Note that the case when only the correlation changes (i.e., ∆1 = ∆2 = 1 and ρ 6= 0) does not satisfy (4.7). In our comparative study, we set α = 0.0027 (i.e., ARL0 ≈ 370) and considered p = 2 and n = 5, 10 with the following three scenarios of Σ: (1) ∆1 = ∆2 = c and ρ = 0 (that is, Σ = cΣ0 ) for c = 1.25, 1.5, 1.75, 2, 2.25, 2.5, 2.75, 3. (2) ∆1 6= ∆2 and ρ = 0 for the following eight combinations: (∆1 , ∆2 ) = (1.25, 1), (1.75, 1), (2.25,1), (2.75,1), (1.25,1.75), (1.75,2.25), (2.75,1.25), (2.25,2.75). (3) For ρ 6= 0, under the condition (4.7), we chose |ρ| =0.2 and 0.4 for the following four combinations: (∆1 , ∆2 ) = (1.75, 1.75), (1.75, 2.25), (2.25, 2.25), (2.25, 2.75). Note that these combinations were selected from scenarios (1) and (2) so that we could study the effect of ρ on ARL performance.
DETECTING INCREASES IN PROCESS DISPERSION
1693
Table 2. ARLs and their standard errors (in parentheses) of the control charts under study for n = 5 when Σ − Σ0 is positive semidefinite. p=2 ∆1
n=5
∆2
One-sided
Two-sided LRT
Modified-LRT
TB-decomposed
[ρ = 0] 0.00 0.00 1.25 1.25 1.50 1.50 1.75 1.75 2.00 2.00 2.25 2.25 2.50 2.50 2.75 2.75 3.00 3.00
370.237 69.2106 23.8224 11.5632 6.91187 4.73748 3.56269 2.85965 2.40662
(0.71143) (0.05716) (0.01138) (0.00376) (0.00168) (0.00092) (0.00057) (0.00039) (0.00029)
369.686 440.129 358.564 208.000 105.702 55.3383 31.7439 19.8941 13.4635
(0.70984) (0.92231) (0.67802) (0.29926) (0.10816) (0.04079) (0.01760) (0.00865) (0.00475)
370.450 272.795 128.429 57.1190 28.6055 16.4050 10.5358 7.37932 5.52952
(0.71204) (0.44973) (0.14498) (0.04279) (0.01503) (0.00644) (0.00325) (0.00186) (0.00118)
370.600 115.050 39.9944 18.1724 10.1564 6.57161 4.71030 3.63512 2.96044
(0.71248) (0.12287) (0.02497) (0.00753) (0.00307) (0.00155) (0.00091) (0.00059) (0.00041)
1.25 1.75 2.25 2.75
1.00 1.00 1.00 1.00
129.516 28.2042 11.4874 6.53473
(0.14683) (0.01471) (0.00372) (0.00154)
404.098 269.094 109.151 46.5300
(0.81132) (0.44060) (0.11351) (0.03140)
316.865 112.851 39.5069 18.4330
(0.56315) (0.11935) (0.02452) (0.00770)
207.232 49.0024 18.1628 9.51687
(0.29760) (0.03395) (0.00752) (0.00278)
1.25 1.75 2.25 2.75
1.75 2.25 2.75 1.25
21.5994 6.77878 3.54941 5.89136
(0.00980) (0.00163) (0.00057) (0.00130)
291.257 93.6812 30.3433 48.2448
(0.49621) (0.09019) (0.01644) (0.03316)
103.678 26.8064 10.3241 17.8396
(0.10506) (0.01362) (0.00315) (0.00732)
32.1836 9.58700 4.62188 8.62655
(0.01797) (0.00281) (0.00088) (0.00238)
[ρ = 0.2] 1.75 1.75 1.75 2.25 2.25 2.25 2.25 2.75
10.6472 6.47171 4.60650 3.49432
(0.00331) (0.00151) (0.00087) (0.00055)
150.438 72.6989 44.4238 25.9099
(0.18390) (0.06156) (0.02927) (0.01293)
45.6064 23.1351 14.7008 9.59569
(0.03046) (0.01088) (0.00544) (0.00281)
17.0810 9.27298 6.44080 4.57628
(0.00685) (0.00267) (0.00150) (0.00087)
[ρ = 0.4] 1.75 1.75 1.75 2.25 2.25 2.25 2.25 2.75
8.69711 5.70170 4.24177 3.32637
(0.00241) (0.00124) (0.00076) (0.00051)
77.1564 42.4345 27.6573 17.9877
(0.06733) (0.02731) (0.01428) (0.00741)
28.1557 16.3980 11.2343 7.91568
(0.01467) (0.00643) (0.00359) (0.00208)
14.3449 8.38249 6.03881 4.42330
(0.00524) (0.00228) (0.00136) (0.00082)
In the simulation study, we took N = 1, 000, 000 and b = 100 to obtain the ARL estimate along with its standard error for each scenario. For α = 0.0027, the control limits obtained from the empirical distributions of the one-sided LRT, two-sided LRT, and two-sided Modified-LRT were, respectively, 8.04116, 22.68151, and 17.67692 for n = 5; 8.90371, 17.53596, and 15.45388 for n = 10. Moreover, the control limit of the TB-decomposed control chart was χ23 (0.9973)=14.15625 for both of n = 5, 10. Tables 2−3 give, respectively for n = 5 and 10, the estimates of ARL and their standard errors (in parentheses) of the four charts under comparison for the scenarios (1)−(3) described above. The following are observed. • The ARL1 value of the one-sided LRT control chart was much smaller than
1694
CHIA-LING YEN AND JYH-JEN HORNG SHIAU
Table 3. ARLs and their standard errors (in parentheses) of the control charts under study for n = 10 when Σ − Σ0 is positive semidefinite. p=2 ∆1
n=10
∆2
One-sided
Two-sided LRT
Modified-LRT
TB-decomposed
[ρ = 0] 0.00 0.00 1.25 1.25 1.50 1.50 1.75 1.75 2.00 2.00 2.25 2.25 2.50 2.50 2.75 2.75 3.00 3.00
370.932 43.9506 12.2232 5.46448 3.21706 2.26244 1.77936 1.50672 1.34228
(0.71344) (0.02880) (0.00409) (0.00115) (0.00048) (0.00025) (0.00016) (0.00011) (0.00008)
368.923 334.228 101.751 31.6456 13.0682 6.84932 4.27350 3.02003 2.33100
(0.70764) (0.61012) (0.10213) (0.01752) (0.00454) (0.00166) (0.00077) (0.00043) (0.00027)
369.441 159.591 41.2284 14.4928 6.90922 4.09836 2.82486 2.16195 1.77936
(0.70914) (0.20098) (0.02615) (0.00532) (0.00168) (0.00072) (0.00038) (0.00023) (0.00016)
370.835 81.0847 20.8143 8.26446 4.40205 2.86533 2.13220 1.73069 1.49254
(0.71316) (0.07256) (0.00927) (0.00223) (0.00081) (0.00039) (0.00023) (0.00015) (0.00010)
1.25 1.75 2.25 2.75
1.00 1.00 1.00 1.00
92.9779 14.1212 5.24672 2.99625
(0.08917) (0.00512) (0.00108) (0.00042)
351.719 70.8578 17.9949 7.57638
(0.65868) (0.05922) (0.00742) (0.00194)
231.514 36.2783 10.6060 5.05989
(0.35150) (0.02155) (0.00329) (0.00102)
160.955 23.4440 7.60861 3.94264
(0.20356) (0.01111) (0.00196) (0.00068)
1.25 1.75 2.25 2.75
1.75 2.25 2.75 1.25
10.7408 3.15698 1.77361 2.74637
(0.00335) (0.00046) (0.00016) (0.00036)
69.5597 12.1154 4.20565 7.54463
(0.05760) (0.00404) (0.00075) (0.00193)
31.6737 6.60213 2.80186 4.85443
(0.01754) (0.00156) (0.00038) (0.00095)
16.4837 4.22095 2.11249 3.64625
(0.00649) (0.00076) (0.00022) (0.00059)
[ρ = 0.2] 1.75 1.75 1.75 2.25 2.25 2.25 2.25 2.75
4.96162 3.01251 2.20807 1.75519
(0.00099) (0.00043) (0.00024) (0.00015)
23.0950 10.1917 6.13960 3.94734
(0.01086) (0.00309) (0.00139) (0.00068)
11.8256 5.93103 3.85034 2.70926
(0.00389) (0.00132) (0.00065) (0.00035)
7.62047 4.07178 2.82309 2.10128
(0.00196) (0.00071) (0.00038) (0.00022)
[ρ = 0.4] 1.75 1.75 1.75 2.25 2.25 2.25 2.25 2.75
3.96379 2.65893 2.05579 1.69227
(0.00068) (0.00034) (0.00021) (0.00014)
12.2423 6.84659 4.65686 3.31454
(0.00410) (0.00166) (0.00089) (0.00050)
7.52998 4.53534 3.24149 2.44803
(0.00192) (0.00085) (0.00049) (0.00029)
6.03234 3.61603 2.65271 2.04522
(0.00135) (0.00058) (0.00034) (0.00021)
that of the other three control charts for all cases tested. This indeed confirms our expectation that the one-sided control chart would outperform the two-sided control charts when detecting dispersion increases. Furthermore, the TB-decompsed control chart had a better ARL1 performance than both of the two-sided LRT and Modified-LRT charts. Note that the two-sided LRT control chart is biased, in the sense that some of its ARL1 values exceeded ARL0 (≈ 370), which made the two-sided LRT control chart the worst in ARL performance. • For all the combinations of ∆1 and ∆2 in scenarios (1)−(3), the ARL1 for n = 10 was smaller than that for n = 5. This confirms the general expectation that detecting power gets larger when the subgroup size gets
DETECTING INCREASES IN PROCESS DISPERSION
1695
larger. For fixed n and ρ, the ARL1 decreased when both ∆1 and ∆2 increased or when one increased and the other one was fixed. This again is not surprising since it is easier to detect larger shifts. Also, a smaller ARL1 resulted in a smaller standard error due to (4.5). • For the effect of ρ, we first observe that, by (4.6), the eigenvalues of Σ − Σ0 depend on ρ through ρ2 . Hence the sign of ρ does not play any role in ARL1 performance as confirmed in our simulation study. The most interesting thing found in the simulation study was that ARL1 decreased when |ρ| increased from 0 to 0.4. This suggests that the ability of the proposed chart to detect increases in dispersion gets better as the correlation (positive or negative) between the two quality characteristics becomes stronger. Our explanation for this is that a stronger correlation implies a stronger binding between the two variables, which allow them to borrow more strength from each other. 4.4. Discussion We have that the proposed one-sided control chart outperforms the two-sided control charts under study when process dispersion “increases” in the sense of the hypothesis H1 of (1.1). We are curious about its performance when used in applications where this alternative hypothesis does not hold. For example, in some medical applications where the variables are mostly related to characteristics of diseases or health conditions, it is common to observe that the correlations between variables change while individual variances remain the same. To study this, we conducted a simulation study in the case of p = 2. Consider three out-of-control scenarios in which Σ − Σ0 is not positive semidefinite: (i) ∆1 = ∆2 = 1 but ρ 6= 0; (ii) ∆1 ≥ 1 and ∆2 ≥ 1, but ρ does not satisfy (4.7); and (iii) ∆1 ≥ 1 but ∆2 < 1. The simulation settings were the same as the previous comparative study: α = 0.0027, p = 2, n = 5, 10, N = 1, 000, 000, and b = 100. Tables 4 and 5 give the ARL1 values along with their standard errors of the four charts for n = 5 and 10, respectively. We observe the following from the tables. • It was encouraging to find that the proposed chart still performed quite well when Σ − Σ0 was not positive semidefinite, as long as the dispersion was not obviously “decreased” (scenarios (i) and (ii), and some cases of (iii)), at least for the cases under our study. Furthermore, for most of cases tested, the proposed one-sided chart still had the best ARL1 performance and similar ARL1 behaviors to those discussed earlier in Subsection 4.3 were also observed.
1696
CHIA-LING YEN AND JYH-JEN HORNG SHIAU
Table 4. ARLs and their standard errors (in parentheses) of the control charts under study for n = 5 when Σ − Σ0 is not positive semidefinite. p=2 ∆1
∆2
n=5 ρ
One-sided
LRT
Two-sided Modified-LRT
TB-decomposed
[scenario (i)] 1.00 1.00 0.2 0.4 0.6 0.8
241.467 (0.37444) 117.237 (0.12640) 62.0993 (0.04854) 37.1216 (0.02231)
331.281 236.764 127.948 45.2206
(0.60206) (0.36354) (0.14416) (0.03007)
306.952 183.298 85.8477 30.4298
(0.53690) (0.24749) (0.07908) (0.01651)
319.679 200.688 99.4134 41.7354
(0.57068) (0.28359) (0.09862) (0.02664)
[scenario (ii)] 1.25 1.00 0.2 0.4 1.75 1.00 0.2 0.4 2.25 1.00 0.2 0.4 2.75 1.00 0.2 0.4 1.25 1.75 0.4 0.6 1.75 1.75 0.6 0.8 1.75 2.25 0.6 0.8 2.25 2.25 0.6 0.8 2.25 2.75 0.6 0.8 2.75 1.25 0.4 0.6
97.5270 56.5442 24.9742 18.9341 10.8204 9.29471 6.31083 5.76330 14.5090 10.6820 6.82878 5.44665 4.80855 4.04115 3.73949 3.24750 3.04882 2.73171 5.17591 4.54102
349.681 230.471 223.256 134.917 93.2794 61.9994 41.6692 31.0067 123.192 57.7216 37.2078 16.2696 23.1507 11.5476 16.2492 8.88053 11.6432 6.97263 29.9503 18.8402
(0.65296) (0.34912) (0.33284) (0.15613) (0.08961) (0.04842) (0.02657) (0.01698) (0.13618) (0.04347) (0.02239) (0.00636) (0.01090) (0.00375) (0.00635) (0.00249) (0.00380) (0.00170) (0.01611) (0.00796)
247.601 136.978 92.1645 56.6780 34.8933 25.3581 17.0274 13.7645 47.4124 25.4505 16.4000 8.83661 10.7942 6.54378 7.96425 5.22767 6.06239 4.28543 12.9248 9.32315
(0.38882) (0.15973) (0.08800) (0.04229) (0.02031) (0.01252) (0.00682) (0.00492) (0.03230) (0.01258) (0.00644) (0.00247) (0.00338) (0.00154) (0.00210) (0.00107) (0.00136) (0.00078) (0.00446) (0.00269)
177.636 113.419 45.2805 35.6890 17.4749 15.4480 9.30205 8.67726 23.9669 17.0397 10.8946 7.45369 7.03131 5.33521 5.32329 4.27279 4.08988 3.47925 7.80198 6.75864
(0.23609) (0.12026) (0.03013) (0.02102) (0.00709) (0.00587) (0.00268) (0.00240) (0.01149) (0.00682) (0.00343) (0.00189) (0.00173) (0.00111) (0.00111) (0.00077) (0.00072) (0.00055) (0.00203) (0.00162)
[scenario (iii)] 1.25 0.80 0.0 0.2 1.25 0.40 0.0 0.2 1.75 0.80 0.0 0.2 1.75 0.40 0.0 0.2 2.25 0.80 0.0 0.2 2.25 0.40 0.0 0.2 2.75 0.80 0.0 0.2 2.75 0.40 0.0 0.2
188.331 (0.25777) 145.347 (0.17463) 272.843 (0.44985) 244.688 (0.38197) 32.9551 (0.01863) 29.7617 (0.01596) 39.8513 (0.02484) 38.0109 (0.02312) 12.6149 (0.00430) 11.9708 (0.00396) 14.2953 (0.00521) 13.9168 (0.00500) 6.96777 (0.00170) 6.76649 (0.00162) 7.63496 (0.00197) 7.52037 (0.00192)
334.483 299.461 149.737 138.287 228.114 197.066 109.695 100.673 96.9783 85.3480 54.9371 50.9571 42.6784 39.0199 27.7384 26.1925
(0.61082) (0.51735) (0.18262) (0.16203) (0.34377) (0.27594) (0.11436) (0.10051) (0.09501) (0.07838) (0.04035) (0.03602) (0.02755) (0.02406) (0.01434) (0.01315)
291.345 243.570 146.297 133.019 107.115 91.2182 64.7556 59.3872 38.2198 34.4474 26.9594 25.3424 17.9914 16.8230 13.9041 13.2982
(0.49644) (0.37935) (0.17634) (0.15284) (0.11034) (0.08664) (0.05171) (0.04538) (0.02332) (0.01992) (0.01374) (0.01250) (0.00742) (0.00669) (0.00499) (0.00466)
253.926 228.726 164.091 164.154 53.6783 50.8804 42.9409 42.9464 19.1926 18.6352 16.6700 16.6127 9.87401 9.71524 8.92949 8.90093
(0.40383) (0.34516) (0.20956) (0.20968) (0.03896) (0.03593) (0.02781) (0.02781) (0.00819) (0.00783) (0.00660) (0.00656) (0.00294) (0.00287) (0.00251) (0.00250)
(0.09582) (0.04214) (0.01223) (0.00802) (0.00339) (0.00268) (0.00145) (0.00126) (0.00533) (0.00332) (0.00165) (0.00115) (0.00094) (0.00070) (0.00062) (0.00049) (0.00044) (0.00036) (0.00106) (0.00085)
DETECTING INCREASES IN PROCESS DISPERSION
1697
Table 5. ARLs and their standard errors (in parentheses) of the control charts under study for n = 10 when Σ − Σ0 is not positive semidefinite. p=2 ∆1
∆2
n = 10 ρ
One-sided
LRT
Two-sided Modified-LRT
TB-decomposed
[scenario (i)] 1.00 1.00 0.2 0.4 0.6 0.8
188.754 (0.25864) 70.5451 (0.05883) 31.7797 (0.01763) 17.2348 (0.00694)
246.959 87.7278 22.6752 4.32312
(0.38731) (0.08170) (0.01056) (0.00079)
214.445 67.5256 18.2046 3.99955
(0.31330) (0.05508) (0.00755) (0.00069)
253.878 91.8554 26.8080 6.36128
(0.40372) (0.08755) (0.01362) (0.00147)
[scenario (ii)] 1.25 1.00 0.2 0.4 1.75 1.00 0.2 0.4 2.25 1.00 0.2 0.4 2.75 1.00 0.2 0.4 1.25 1.75 0.4 0.6 1.75 1.75 0.6 0.8 1.75 2.25 0.6 0.8 2.25 2.25 0.6 0.8 2.25 2.75 0.6 0.8 2.75 1.25 0.4 0.6
61.1838 (0.04747) 29.8339 (0.01602) 12.1489 (0.00406) 8.69253 (0.00241) 4.90663 (0.00097) 4.15243 (0.00074) 2.89654 (0.00040) 2.64381 (0.00034) 6.62287 (0.00157) 4.70316 (0.00091) 3.07321 (0.00044) 2.46398 (0.00030) 2.25522 (0.00025) 1.92579 (0.00019) 1.84106 (0.00017) 1.63337 (0.00013) 1.58067 (0.00012) 1.45023 (0.00010) 2.42056 (0.00029) 2.13809 (0.00023)
207.316 67.5279 50.8978 24.1776 15.2086 9.91563 6.88811 5.30567 21.2003 8.84590 6.12474 2.74413 4.19399 2.28804 3.23234 2.01240 2.56145 1.78251 5.19164 3.52038
(0.29778) (0.05508) (0.03595) (0.01164) (0.00573) (0.00296) (0.00167) (0.00110) (0.00953) (0.00248) (0.00139) (0.00036) (0.00075) (0.00026) (0.00048) (0.00020) (0.00032) (0.00016) (0.00106) (0.00056)
130.295 44.0444 27.7528 15.0450 9.32091 6.66748 4.71271 3.86417 12.7507 6.29042 4.42479 2.32802 3.16148 1.97142 2.51333 1.75595 2.06422 1.58087 3.71100 2.76432
(0.14816) (0.02890) (0.01435) (0.00564) (0.00269) (0.00159) (0.00091) (0.00065) (0.00437) (0.00145) (0.00082) (0.00027) (0.00046) (0.00019) (0.00031) (0.00015) (0.00021) (0.00012) (0.00061) (0.00037)
116.427 49.7551 20.8225 14.2149 7.22240 6.02859 3.83956 3.48773 10.2350 6.05743 4.15187 2.47990 2.88415 2.01208 2.30113 1.76740 1.88576 1.56706 3.24293 2.68286
(0.12509) (0.03474) (0.00927) (0.00517) (0.00180) (0.00135) (0.00065) (0.00055) (0.00311) (0.00136) (0.00074) (0.00030) (0.00040) (0.00020) (0.00026) (0.00015) (0.00018) (0.00012) (0.00049) (0.00035)
[scenario (iii)] 1.25 0.80 0.0 0.2 1.25 0.40 0.0 0.2 1.75 0.80 0.0 0.2 1.75 0.40 0.0 0.2 2.25 0.80 0.0 0.2 2.25 0.40 0.0 0.2 2.75 0.80 0.0 0.2 2.75 0.40 0.0 0.2
137.158 (0.16004) 95.6220 (0.09302) 190.506 (0.26225) 165.199 (0.21169) 16.3332 (0.00640) 14.3968 (0.00527) 19.0766 (0.00811) 18.0272 (0.00744) 14.3968 (0.00527) 5.36199 (0.00112) 6.23301 (0.00143) 6.06873 (0.00137) 3.15201 (0.00046) 3.05875 (0.00044) 3.35417 (0.00051) 3.30258 (0.00050)
232.080 161.147 37.5143 31.3924 57.1911 44.1376 17.1791 14.9439 44.1376 13.8391 7.48878 6.84196 7.01277 6.44060 4.18256 3.93561
(0.35279) (0.20393) (0.02267) (0.01731) (0.04287) (0.02899) (0.00691) (0.00558) (0.02899) (0.00496) (0.00191) (0.00165) (0.00172) (0.00150) (0.00075) (0.00067)
185.797 122.341 37.5309 31.1212 33.0358 26.4527 13.2818 11.7222 26.4527 8.97365 5.75069 5.32961 4.89211 4.57939 3.35480 3.19140
(0.25257) (0.13476) (0.02268) (0.01708) (0.01870) (0.01335) (0.00465) (0.00384) (0.01335) (0.00253) (0.00125) (0.00111) (0.00097) (0.00087) (0.00051) (0.00047)
169.887 136.195 46.3011 44.0131 23.9667 21.8864 12.5253 12.1337 21.8864 7.36641 5.21777 5.10552 3.97254 3.87765 3.06708 3.01726
(0.22078) (0.15836) (0.03116) (0.02887) (0.01149) (0.01000) (0.00425) (0.00405) (0.01000) (0.00186) (0.00107) (0.00103) (0.00068) (0.00066) (0.00044) (0.00043)
1698
CHIA-LING YEN AND JYH-JEN HORNG SHIAU
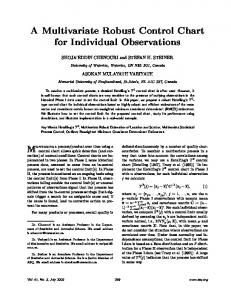
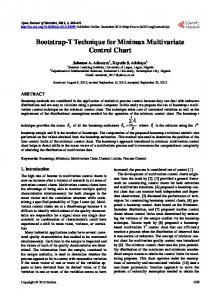
• For fixed n, ∆1 , and ∆2 , stronger correlation enhanced detecting power for each of the charts. However, the improving rates were different across the charts. To see this, we highlight in Tables 4 and 5 the cases where the one-sided chart no longer leads; there the improving rate of the one-sided chart may not be as large as, say, that of the two-sided Modified-LRT chart, because it starts losing its leading status when ρ gets too large. Nonetheless, the number of highlighted cases is not many. Also by comparing the highlighted cases between Tables 4 and 5, we find that the effect of n is similar. That is, while the detecting power increases for all charts as n increases, the improving rate of the proposed chart is the slowest. There are some cases that the proposed chart leads for n = 5, but not for n = 10. • Scenario (iii) has one variance decreased while the other is increased from the in-control case. It is noted that when one of the variances decreases while keeping all other parameters fixed, the detecting power of the onesided chart drops while that of the other charts increases; the one-sided chart is designed for detecting dispersion increases only and hence the power of the chart gets lower as the size of decrease gets larger. On the other hand, since the other charts are based on two-sided tests, they gain more power as the size of decrease gets larger. This can be seen clearly from Figures 1−2 where the ARL1 values for ∆1 = 1.25, 1.75, 2.25, 2.75, ∆2 = 0.4, 0.6, 0.8, ρ = 0, 0.2 are displayed, respectively, for n = 5 and n = 10. For fixed n, ∆1 , and ρ, the ARL1 of the proposed chart declines as the extent of decrease in ∆2 reduces from 0.4 to 0.8, while those of the other three charts all trend up (with that of the two-sided LRT chart being the largest). Also, for fixed n and ρ, the ARL1 curve of the proposed chart gets flatter as ∆1 increases, since the increase of ∆1 is offsetting the decrease of ∆2 . For the three cases that the dispersion seems “decreased”, (∆1 , ∆2 ) = (1.25, 0.4), (1.75, 0.4), (2.25, 0.4), the proposed chart still has better power than others for the last two cases. While this seems a bit odd, the power does depend on the relative strength between the conflicting “forces” of “increase” and “decrease”. 5. Examples In this section, the application of the proposed control chart is illustrated with a semiconductor example. In addition, two simulated examples are presented to demonstrate the better detecting power of the one-sided control chart over the existing two-sided control charts when process dispersion increases.
DETECTING INCREASES IN PROCESS DISPERSION
1699
Figure 1. The ARL1 values for one-sided (◦), two-sided LRT (∇), two-sided Modified-LRT (4), and TB-decomposed (∗) control charts for n = 5 in scenario (iii).
5.1. A semiconductor example Data related to a metal layer process for the semiconductor element of a wafer were taken from a semiconductor company in Taiwan. The two quality characteristics monitored are “after-develop-inspection-critical-dimension (ADICD)” and “after-etch-inspection-critical-dimension (AEICD)”; these values are strongly related to the conductivity. The two dimensions are measured at five points on each wafer after the develop-action and etch-action, respectively. Because the five measurements on the same wafer are likely to be correlated, we take the average of them as the representative of a wafer; averages of ADICD and AEICD of the same wafer are denoted by X1 and X2 , respectively. Note that X1 and X2 are correlated and write X = (X1 , X2 )0 . Fifty random samples, each ( of size 5, were ) taken 0.79966 ¯¯ = and the from the in-control process. The sample mean was X 0.85744
1700
CHIA-LING YEN AND JYH-JEN HORNG SHIAU
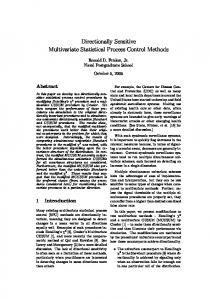
Figure 2. The ARL1 values for one-sided (◦), two-sided LRT (∇), two-sided Modified-LRT (4), and TB-decomposed (∗) control charts for n = 10 in scenario (iii). 50 5 ¯ 0 ¯ sample covariance matrix was S = (50 × 5 − 1)−1 Σ Σ (Xij − X)(X ij − X) = i=1j=1 ( ) 3.55462 × 10⁻⁴ 1.30949 × 10⁻⁴ . The sample correlation coefficient between 1.30949 × 10⁻⁴ 4.86645 × 10⁻⁴ the 250 X1 ’s and X2 ’s is ρˆ = 0.32244. Since we assume Σ0 is known, we treat S as the in-control process covariance matrix Σ0 . For p = 2, n = 5, and α = 0.0027, as given before, the one-sided, two-sided LRT, two-sided Modified-LRT, and TB-decomposed control limits were 8.04116, 22.68151, and 17.67692, and 14.15625, respectively. We used these control limits to monitor another 25 samples, each of size 5, taken on-line from the process. The control charts are displayed in Figure 3. There the 7th, 10th, 12th, and 17th samples exceed the control limit of the one-sided control chart, while the 10th, 12th, and 17th samples exceed the control limits of the TB-decomposed control chart, the 10th and 12th samples exceed the control limits of the twosided modified-LRT control chart, and only the 10th sample exceeds the control
DETECTING INCREASES IN PROCESS DISPERSION
1701
Figure 3. One-sided, two-sided LRT, two-sided Modified-LRT, and TBdecomposed control charts on 25 new samples of the semiconductor example; the one-sided control chart outperforms the other three control charts.
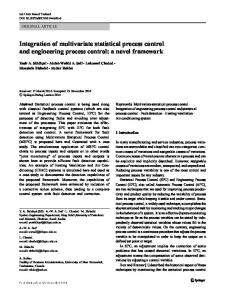
limit of the two-sided LRT control chart. This result matches the general observations made on the ARL1 performances of the four charts in Subsection 4.3. In particular, this shows the one-sided control chart to be more sensitive than the other three control charts. ¯ as the in-control mean, as a mean chart, the Hotelling T 2 chart By treating X of the 25 new samples is presented in Figure 4. The control limit is χ22 (0.9973) = 11.82901. Three points (7th, 12th, and 18th) exceed the control limit. Among these three points, the 12th point was also detected by all the dispersion charts and the 7th point was detected only by the proposed chart. 5.2. Simulated examples Consider the example of the previous subsection. Assume the random vec¯ tor X from the in-control process is distributed as Np (µ0 , Σ0 ) with µ0 = X and Σ0 = S. We simulated some in-control data and out-of-control data to investigate the effectiveness of the proposed control chart.
1702
CHIA-LING YEN AND JYH-JEN HORNG SHIAU
Figure 4. The Hotelling T 2 control chart on 25 new samples of the semiconductor example.
60 samples, each of size 5, were generated. The first ten and the 31st to 40th samples were from the in-control process, the 11th to 30th samples were from ¯ Σ ) with Σ ≥ Σ ¯ Σ ), and the 41st to 60th samples were from N (X, Np (X, 2 1 0 1 p and Σ2 ≥ Σ0 . Let [√ ] [√ 0 ] ] [√ ] [√ 0 ∆1 0 ∆1 0 ∆1 √0 ∆1 √0 √ √ Σ1 = Σ0 , Σ0 and Σ2 = 0 0 ∆2 ∆2 0 0 ∆02 ∆02 where ∆1 , ∆2 , ∆01 , and ∆02 are all greater than 1. Two scenarios were considered for Σ1 and Σ2 : (i)(∆1 , ∆2 ) = (1.75, 2.25) and (∆01 , ∆02 ) = (1.75, 1), and (ii) (∆1 , ∆2 ) = (2.25, 2.25) and (∆01 , ∆02 ) = (1.75, 1.75). Figure 5 (6) depicts the one-sided, two-sided LRT, two-sided Modified-LRT, and TB-decomposed control charts for scenario (i) ((ii)). It is striking to observe that the one-sided control chart effectively picks, respectively, 4 (6) and 1 (3) out-of-control points from the first and the second out-of-control regions, while the two-sided LRT control chart does not detect any for either scenario. TBdecomposed (two-sided Modified-LRT) picks 3 (1) out-of-control points from the first and none (none) from the second out-of-control region for scenario (i); and picks 4 (2) points from the first and 2 (0) points from the second out-of-control region for scenario (ii). The figures also confirm that the first out-of-control region is easier to detect than the second, and that scenario (ii) is easier to detect than scenario (i), as expected. 6. Conclusions In this paper, assuming the in-control covariance matrix Σ0 is known, we have constructed a control chart for Phase II on-line monitoring based on the
DETECTING INCREASES IN PROCESS DISPERSION
1703
Figure 5. One-sided, two-sided LRT, two-sided Modified-LRT, and TBdecomposed control charts for scenario (i) of the simulated example.
one-sided likelihood ratio test; this chart is particularly sensitive in detecting dispersion increases for multivariate processes. The control limit can be obtained by the Monte Carlo method. It is shown that the control limit does not depend on µ0 and Σ0 . For practitioners, control limits of various settings are given in Table 1. For the settings not covered in the table, a MATLAB program for computing them is provided at our website. A performance study showed that, in terms of the average run length, the proposed control chart outperforms the three existing control charts under study when process dispersion increases. The applicability and effectiveness of the proposed chart are illustrated through a semiconductor example and two simulated examples. Although it is important to detect dispersion increases sooner so as to prevent producing more defective or substandard product items, we emphasize that other kinds of dispersion changes are important as well. Thus the proposed control chart should be used as a supplement to the standard monitoring procedures rather than as a substitute. The proposed control chart is a Shewhart-like chart. It is well known that EWMA and CUSUM charts are more sensitive to small changes. An EWMA
1704
CHIA-LING YEN AND JYH-JEN HORNG SHIAU
Figure 6. One-sided, two-sided LRT, two-sided Modified-LRT, and TBdecomposed control charts for scenario (ii) of the simulated example.
chart for effective monitoring of dispersion increases will be studied in another paper. Acknowledgement The authors would like to express their gratitude to the Editors, an associate editor, and an anonymous referee for the careful review and constructive suggestions. This work was supported in part by the National Research Council of Taiwan, Grant No. NSC95-2118-M-009-006-MY2 and NSC97-2118-M-009-002MY2. Appendix. Proof of Theorem 1 The likelihood function of n observations, Xt1 , . . . , Xtn , is { } 1 n −n/2 0 −1 −pn/2 L(µ, Σ) = (2π) |Σ| exp − Σ (Xtj − µ) Σ (Xtj − µ) . 2 j=1
(A.1)
¯ t is the MLE of µ. Since Σ0 is To maximize L(µ, Σ), we first note that µ ˆ≡X
DETECTING INCREASES IN PROCESS DISPERSION
1705
known, rewrite the log likelihood function of (A.1), concentrated with respect to ¯ t , as ˆ X µ= ] n n [ pn ˆ Σ) = − log 2π − log |Σ| − tr St Σ−1 . (A.2) `(µ, 2 2 2 Let Θ ≡ Σ − Σ0 . Assume that rank(Θ) = k, 0 ≤ k ≤ p. Since Θ is symmetric and positive semidefinite, from Theorem 4.14 of Schott (2005) there exists a nonsingular matrix Γ such that Θ = ΓDς Γ0 and Σ0 = ΓΓ0 , where Dς = diag(ς1 , . . . , ςp ) with ς1 ≥ · · · ≥ ςk > ςk+1 = · · · = ςp = 0 being the roots of |Θ − ςΣ0 | = 0, by the assumptions that Σ0 is positive definite and rank(Θ) = k. Let δ1 ≥ · · · ≥ δp be the roots of |Σ − δΣ0 | = 0. Since |Σ − δΣ0 |=|Θ − (δ − 1)Σ0 | = 0, we have δi = ςi + 1, i = 1, . . . , p. Let Dδ = diag(δ1 , . . . , δp ). Then Dδ = Dς + Ip with δ1 ≥ · · · ≥ δk > δk+1 = · · · = δp = 1 and Σ = ΓDδ Γ0 . Hence, |Σ| = |ΓDδ Γ0 | = |Σ0 ||Dδ |. Similarly, there exists a nonsingular matrix Z such that St = ZDd Z 0 and Σ0 = ZZ 0 , where Dd = diag(d1 , . . . , dp ) with d1 ≥ · · · ≥ dp > 0 being the roots of |St − dΣ0 | = 0. Then tr(St Σ−1 ) = tr[(Γ−1 Z)Dd (Γ−1 Z)0 Dδ−1 ]. Substituting these results into ¯t, ˆ =X (A.2), we have the log likelihood function, concentrated with respect to µ ] pn n n n [ log 2π − log |Σ0 | − log |Dδ | − tr (Γ−1 Z)Dd (Γ−1 Z)0 Dδ−1 . 2 2 2 2 (A.3) Since ΓΓ0 = ZZ 0 , we have Ip = Γ−1 ZZ 0 Γ0−1 = (Γ−1 Z)(Γ−1 Z)0 . Thus Γ−1 Z is an orthogonal matrix. By a theorem of Von Neumann (1937) (stating that, for Q orthogonal and Ds and Dt diagonal with positive elements, min tr(Ds−1 QDt Q0 ) = `(Dδ , Γ) = −
Q
tr(Ds−1 Dt )), we obtain that min tr[(Γ−1 Z)Dd (Γ−1 Z)0 Dδ−1 ] = tr(Dd Dδ−1 ). ThereΓ−1 Z
fore, maximizing `(Dδ , Γ) in (A.3) is reduced to maximizing pn log 2π − 2 pn = − log 2π − 2
`(Dδ ) = −
n log |Σ0 | − 2 n log |Σ0 | − 2
n log |Dδ | − 2 n p Σ (log δi + 2 i=1
n tr(Dd Dδ−1 ) 2 di ) δi
(A.4)
with respect to δ1 , . . . , δp . Note that, for fixed di , log δi + di /δi reaches its minimum at δi = di . Let δ = (δ1 , . . . , δp )0 . Then the maximizer of `(Dδ ) over {δ | δ1 ≥ · · · ≥ δk > δk+1 = · · · = δp = 1} is δ = (d1 , . . . , dk∗ , 1, . . . , 1)0 , where k ∗ = min (k, p∗ ), with p∗ the number of di > 1. To simplify notation, write maxL(µ, Σ) for given k as L∗ (k ∗ ). Then, after µ, Σ
some simple algebra, the maximum likelihood function of (A.1) can be rewritten as ] [ n p k∗ −n/2 L∗ (k ∗ ) = (2π)−pn/2 e−pn/2 |Σ0 |−n/2 Π di Π∗ exp − (di − 1) . 2 i=1 i=k +1
1706
CHIA-LING YEN AND JYH-JEN HORNG SHIAU
It is trivial to show that L∗ (k ∗ ) is nondecreasing in k ∗ . Then the LRT statistic for testing (1.1) is ∗ maxL∗ (k ∗ ) p n/2 ∗ L (0) H0 , for p∗ > 0 Π {di exp [−(di − 1)]} = = . i=1 maxL∗ (k ∗ ) L∗ (p∗ ) 1 , for p∗ = 0 H1
References Alt, F. B. (1985). Multivariate quality control. In Encyclopedia of Statistical Sciences 6 (Edited by S. Kotz , N. L. Johnson, and C. B. Read), 110-112. Wiley, New York. Alt, F. B. and Bedewi, G. E. (1986). SPC of dispersion for multivariate data. In ASQC Quality Congress Transactions, 248-254. Alt, F. B. and Smith, N. D. (1998). Multivariate process control. In Handbook of Statistics 7 (Edited by P. R. Krisnaiah and C. R. Rao), 333-351. Elsevier Science Publishers, New York. Anderson, T. W. (1989). The asymptotic distribution of the likelihood ratio criterion for testing rank in multivariate components of variance. J. Multivariate Anal. 30, 72-79. Anderson, T. W. (2003). An Introduction to Multivariate Statistical Analysis. 3rd edition. Wiley, New York. Anderson, B. M., Anderson, T. W. and Olkin, I. (1986). Maximum likelihood estimators and likelihood ratio criteria in multivariate components of variance. Ann. Statist. 14, 405-417. Bersimis, S., Psarakis, S. and Panaretos, J. (2007). Multivariate statistical process control charts: an overview. Quality and Reliability Engineering International 23, 517-543. Calvin, J. A. (1994). One-sided test of covariance matrix with a known null value. Comm. Statist. Theory Methods 23, 3121-3140. Chan, L. K. and Zhang, J. (2001). Cumulative sum control charts for the covariance matrix. Statist. Sinica 11, 767-790. Djauhari, M. A. (2005). Improved monitoring of multivariate process variability. J. Quality Tech. 37, 32-39. Dykstra, R. L. (1970). Establishing the positive definiteness of the sample covariance matrix. Ann. Math. Statist. 41, 2153-2154. Golub, G. H. and Van Loan, C. F. (1989). Matrix Computations. Johns Hopkin University Press, Baltimore. Hao, S., Zhou, S. and Ding, Y. (2008). Multivariate process variability monitoring through projection. J. Quality Tech. 40, 214-226. Hawkins, D. M. (1991). Multivariate quality control based on regression-adjusted variables. Technometrics 31, 61-75. Hawkins, D. M. (1993). Regression adjustment for variables in multivariate quality control. J. Quality Tech. 25, 170-182. Hawkins, D. M. and Maboudou-Tchao, E. M. (2008). Multivariate exponentially weighted moving covariance matrix. Technometrics 50, 155-166. Hotelling, H. (1947). Multivariate quality control. In Techniques of Statistical Analysis (Edited by C. Eisenhart, M. W. Hastay and W. A. Wallis). McGraw-Hill, New York.
DETECTING INCREASES IN PROCESS DISPERSION
1707
Huwang, L., Yeh, A. B. and Wu, C.-W. (2007). Monitoring multivariate processing variability for individual observations. J. Quality Tech. 39, 258-278. Kuriki, S. (1993). One-sided test for equality of two covariance matrices. Ann. Statist. 21, 1379-1384. Levinson, W., Holmes, D. S. and Mergen, A. E. (2002). Variation charts for multivariate processes. Quality Engineering 14, 539-545. Mason, R. L., Tracy, N. D. and Young, J. C. (1995). Decomposition of T 2 for multivariate control chart interpretation. J. Quality Tech. 27, 99-108. Montgomery, D. C. (2009). Introduction to Statistical Quality Control. 6th edition. Wiley, New York. Reynolds, Jr. M. R. and Cho, G.-Y. (2006). Multivariate control charts for monitoring the mean vector and covariance matrix. J. Quality Tech. 38, 230-253. Reynolds, Jr. M. R. and Stoumbos, Z. G. (2006). Comparisons of some exponentially weighted moving average control charts for monitoring the process mean and variance. Technometrics 48, 550-567. Runger, G. C. and Testik, M. C. (2004). Multivariate extensions to cumulative sum control charts. Quality and Reliability Engineering International 20, 587-606. Sakata, T. (1987). Likelihood ratio test for one-sided hypothesis of covariance matrices of two normal populations. Comm. Statist. Theory Methods 16, 3157-3168. Schott, J. R. (2005). Matrix Analysis for Statistics. 2nd edition. Wiley, New York. Sugiura, N. and Nagao, H. (1968). Unbiasedness of some test criteria for the equality of one or two covariance matrices. Ann. Math. Statist. 39, 1686-1692. Tang, P. F. and Barnett, N. S. (1996a). Dispersion control for multivariate processes. Austral. J. Statist. 38, 235-251. Tang, P. F. and Barnett, N. S. (1996b). Dispersion control for multivariate processes–some comparisons. Austral. J. Statist. 38, 253-273. Vargas, N. J. A. and Lagos, C. J. (2007). Comparison of multivariate control charts for process dispersion. Quality Engineering 19, 191-196 Von Neumann, J. (1937). Some matrix-inequalities and metrization of matrix Space. Tomsk University Rev. 1, 283-300. Reprinted (1962). In John Von Neumann Collected Works 4 (Edited by A. H. Taub), 205-219. Pergamon, New York. Wierda, S. J. (1994). Multivariate statistical process control–recent results and directions for future research. Statistica Neerlandica 48, 147-168. Yeh, A. B., Huwang, L. and Wu, Y. F. (2004). A likelihood ratio based EWMA control chart for monitoring multivariate process variability. IIE Transactions in Quality and Reliability Engineering 36, 865-879. Yeh, A. B., Lin, D. K.-J. and McGrath, R. N. (2006). Multivariate control charts for monitoring covariance matrix: a review. Quality Technology and Quantitative Management 3, 415-436. Institute of Statistics, National Chiao Tung University, Hsinchu, Taiwan, 30010 R.O.C. E-mail:
[email protected] Institute of Statistics, National Chiao Tung University, Hsinchu, Taiwan, 30010 R.O.C. E-mail:
[email protected] (Received August 2006; accepted July 2009)