OPEN ACCESS Int. Res. J. of Science & Engineering, 2014; Vol. 2 (6): 191-202
ISSN: 2322-0015
RESEARCH ARTICLE
A Multivariate EWMA Control Chart for Skewed Populations using Weighted Variance Method Atta AMA1*, Shoraim MHA1 and Yahaya SSS2 1Department
of Economics and Policy Sciences, College of Commerce and Economics, Hodeida University, Hodeida,
Yemen. 2Department
of Mathematic and Statistics, School of Quantitative Sciences, Universiti Utara Malaysia, Sintok, Malaysia
*Corresponding author Email:
[email protected]
Manuscript Details
ABSTRACT
Received : 18.09.2014 Revised : 27.10.2014 Accepted : 12.11.2014 Published: 18.11.2014
This article proposes Multivariate Exponential Weighted Moving Average control chart for skewed population using heuristic Weighted Variance (WV) method, obtained by decomposing the variance into the upper and lower segments according to the direction and degree of skewness. This method adjusts the variance-covariance matrix of quality characteristics. The proposed chart, called WV-MEWMA hereafter, reduces to standard multivariate Exponential Weighted Moving Average control chart (standard MEWMA) when the underlying distribution is symmetric. Incontrol and out-of-control ARLs of the proposed WV-MEWMA control chart are compared with those of the weighted standard deviation Exponential Weighted Moving Average (WSD-MEWMA) and (standard MEWMA) control charts for multivariate normal, lognormal and gamma distributions. In general, the simulation results show that the performance of the proposed WV-MEWMA chart is better than WSD-MEWMA and Standard MEWMA charts when the underlying distributions are skewed.
ISSN: 2322-0015
Editor: Dr. Arvind Chavhan
Cite this article as: Atta AMA, Shoraim MHA and Yahaya SSSA. Multivariate EWMA Control Chart for Skewed Populations using Weighted Variance Method Int. Res. J. of Sci. & Engg., 2014; 2 (6):191-202.
Keywords: MEWMA; skewed populations; average run length (ARLs); Weighted Variance.
1. INTRODUCTION
Copyright: © Author(s), This is an open access article under the terms of the Creative Commons Attribution Non-Commercial No Derivs License, which permits use and distribution in any medium, provided the original work is properly cited, the use is noncommercial and no modifications or adaptations are made.
© 2014| All right reserved
In the quality of the process, there are many cases determined by the joint level of several quality characteristics. For example the quality of chemical process may depend on the joint level of viscosity, concentration, molecular weight, and pH (Chang,2007). Since these quality characteristics are clearly correlated and monitoring them separately will be misleading. Thus it is desirable to have control charts that can monitor multivariate measurement simultaneously. The most widely used multivariate control 2
charts are the Hotelling’s T , multivariate CUSUM (MCUSUM) and multivariate EWMA (MEWMA) charts. Many researchers have developed the MEWMA chart, however a potential disadvantage of the control charts is the normality assumption of the underlying process distribution. 191
Atta et al., 2014 In practice, the normality assumption is usually difficult to justify and is often violated. For instance, the measurements from chemical process, filling processes, and semiconductor processes are often skewed. See (Khoo et al., 2009). As skewness increases, the incontrol ARL of conventional chart decreases. Here, we will discuss some extensions of the MEWMA chart; (Yumin, 1996) investigated the MEWMA chart with the generalized smoothing parameter matrix, where the principal components of the original variables are used to construct the MEWMA chart. (Sullivan and Woodall, 1996) recommended the use of a MEWMA chart for a preliminary analysis of multivariate observations. (Prabhu and Runger,1997) provided recommendations for the selection of parameters for a MEWMA chart. They used the Markov chain method to provide design recommendations for a MEWMA chart that parallels many of the results provided by (Lucas and Saccucci, 1990) for the univariate EWMA chart. (Runger et al., 1999) showed how the shift detection capability of the MEWMA chart can be significantly improved by transforming the original process variables to a lower dimensional subspace through the use of a U transformation. The U transformation is similar to the option of principal components, but it allows the user to define the specific subspace to be monitored. (Stoumbos and Sullivan, 2002) investigated the effects of non-normality on the statistical performance of the MEWMA chart. They showed that the MEWMA chart can be designed to be robust to non-normality and very effective in detecting process shifts of any size or direction, even for highly skewed and extremely heavy-tailed multivariate distributions. (Kim and Reynolds, 2005) investigated the MEWMA chart for monitoring the mean vector when the sample sizes are unequal. (Pan, 2005) proposed and examined the sensitivity of a MEWMA chart when the distribution of the chart’s statistic is derived from the Box quadratic form. (Yeh et al., 2005) proposed a MEWMA chart that monitors changes in the variance-covariance matrix of a multivariate normal process for individual observations. (Reynolds and Kim,2005) showed that the MEWMA chart based on sequential sampling is more efficient in detecting changes in the mean vector than standard control charts based on nonsequential sampling. (Lee and Khoo, 2006) proposed the optimal statistical designs of the MEWMA chart based on ARL and MRL. (Hawkins et al.,2007) proposed a general MEWMA chart in which the smoothing matrix is full, rather than having only diagonal elements. In additional to these extensions,
192
(Chang, 2007) proposed MCUSUM and MEWMA charts based on weighted standard deviation method (WSD) to solve the problem of multivariate skewness. While in this article, another MEWMA chart is developed by using weighted variance method (WV) suggested by (Bai and Choi,1995) and this newly developed MEWMA chart (WV-MEWMA) is a multivariate extension of the chart proposed by (Khoo and Atta,2008). The section 2 and 3 review the multivariate Weighted Standard Deviation (WSD) and the proposed multivariate Weighted Variance (WV) methods respectively, followed by WSD-MEWMA and proposed WV- MEWMA charts in section 4 and 5. In section 6, the performance of the proposed chart is compared with WSD-MEWMA and standard MEWMA charts in terms of in-control and out-of-control ARLs for multivariate lognormal and gamma distributions. Finally, conclusion is drawn in section 7.
2. Weighted Standard Deviation (WSD) Method Chang and Bai (2004) proposed the WSD method to modify the variance-covariance matrix of each quality characteristic. Assume that p-variate random vector
X = ( X 1 ,L , X p )
T
(
µ = µ1 ,L , µ p σ12 = ∑
)
is
distributed
with
mean
T
and variance-covariance
ρ12 σσ L ρ1 p σσ 1 2 1 p 2 σ2 L ρ2 p σ2σp . O M σ2p
(1)
Here, T denotes the transpose of a vector or matrix, is the standard deviation of X j , and correlation coefficient of
ρij
σj
is the
X i and X j . The modified P
variance-covariance matrix of 2 multivariate normal distribution for approximation, is.
( σW )2 ρ σW σW L ρ σW σW 12 1 2 1p 1 p 1 2 W W W W ( σ2 ) L ρ2 pσ2 σp (2) ∑ = W ∑W = O M W 2 ( σp )
www.irjse.in
where W =
diag {W1 , W2 ,..., Wp } ,
A Multivariate EWMA Control Chart for Skewed Populations using Weighted Variance Method
2θj , if Xij > µj Wj = . 2 1 − θ , otherwise ( ) j
(3)
σW j = W jσ j , θ j = Pr ( X j ≤ µ j ) Note that, if X ij is greater than
µj
, the PDF related to
X ij is modified by adjusting the ith row and jth column of variance-covariance matrix using 2θ jσ j in place of
σj
. Otherwise, the ith row and jth column of variance-
(
covariance matrix is adjusted by 2 1 − θ j However, the correlation matrix
ρ = { ρij }
)σ
.
j
does not
change even though the variance-covariance matrix is adjusted. The WSD method approximates the original p
PDF with segments from 2 multivariate normal distributions. See (Chang and Bai 2004) for more details.
( σQ )2 ρ σQσQ L ρ σQσQ 12 1 2 1p 1 p 1 Q 2 Q Q Q ( σ2 ) L ρ2 pσ2 σp (4) ∑ = Q∑Q = O M Q 2 ( σp )
Q = diag {Q1 , Q2 ,..., Qp } ,
2θj , if Xij > µj Qj = 2 (1 − θj ) , otherwise
Note that, in variance-covariance matrix in 4,
σ Qj = Q j σ j
θ j = Pr ( X ij ≤ µ j )
and
(WV) method to setting up control limits of X R and R
modified by adjusting the ith row and jth column of
2θ j σ j in place of
. Otherwise, the ith row and jth column of variance-
covariance matrix is adjusted by
ρ = { ρij }
2 (1 − θ j ) σ j . Also,
charts for skewed populations. (Khoo et al.,2009)
the correlation matrix
proposed X S and S charts for skewed populations
though the variance-covariance matrix is adjusted.
using Weighted Variance (WV) method. An EWMA chart using Weighted Variance (WV) method of skewed population was suggested by (Khoo and Atta, 2008). The WV method decomposes the variance into two parts while the WSD method decomposes the standard deviation into two parts. All the three charts used WV method for univariate case (involve one quality characteristic) only. However, in this paper we will extend the univariate WV method to multivariate version by adjusting the variance-covariance matrix with WVs of each quality characteristic. Since the correlation matrix represents the dependent structure of quality characteristics, we should not tamper with it, and a multivariate control chart must reflect this dependency. In multivariate quality characteristics, the WV method uses the same approach as the WSD method, except that equation 3 will be modified by using square root, because the WV method decomposes the variance into two parts. Consider that the p-variate
X = ( X 1 ,L , X p ) is distributed as in T
random vector
(1), with the same mean and variance-covariance matrix.The modified variance-covariance matrix of 2 multivariate normal distribution for approximation, is
P
the
X ij is greater than µ j , the PDF related to X ij is
σj
Bai and Choi (1995) proposed the Weighted Variance
is
probability that X ij is less than or equal to its mean. If
variance-covariance matrix using
3. Weighted Variance (WV) Method
(5)
does not change even
4. The WSD-MEWMA Chart (Chang, 2007) developed the WSD-MEWMA chart to improve the performance of the standard MEWMA chart for skewed populations. The WSD-MEWMA chart’s statistic (Chang, 2007) is defined as
M iW = λ Z iW + ( I − λ )M iW−1 , for i =1,2,…,(6) where
M 0W = 0
and
λ = diag{λ 1 , λ 2 ,..., λ p } ,
0 < λ j ≤ 1 , for j = 1, 2, …, p. W
Since Z i follows a multivariate normal distribution with mean vector 0 and variance-covariance matrix ρ approximately, the asymptotic variance-covariance matrix of M i is Σ M = λ ( 2 − λ ) ρ , if we assume W
that there is no a priori reason to weight past observations differently for the p variables. Note that in W
equation 6, the Z i for the jth. element as defined by (Chang, 2007) is.
Int. Res. J. of Science & Engineering, 2014; Volume 2, No. 6, November –December, 2014.
193
Atta et al., 2014
1 2θ Zij , if Xij > µj X j − µj j ZijW = = …. (7) Wj σj n 1 Zij , otherwise 2 (1 − θj ) In Equation (7),
Zij =
Xij − µj σj
(8)
n
differently for the p variables, the asymptotic variancecovariance matrix of M i is Σ M = λ ( 2 − λ ) ρ . Q
Q
The Z i in equation 11 for the jth element is
1 Zij , if Xij > µj 2 θ j X − µj ZijQ = ij = (12) 1 Qj σj n Zij , otherwise 2 (1 − θj )
and such that
2θj , if Xij > µj Wj = 2 (1 − θj ) , otherwise
(9)
Zij =
Xij − µj σj
(13)
n
Where Xij represents the mean of quality characteristic j, in sample i, n is the sample size, I denotes the identity matrix and ρ the correlation matrix of X. An out-ofcontrol signal is detected when the chart’s statistic,
′ EiW = ( M iW ) Σ −M1 M iW
(10)
and
2θj , if Xij > µj Qj = 2 (1 − θj ) , otherwise In
exceeds the control limit,
hE . The value of hE is
determined based on a desired in-control ARL when the underlying process is assumed to follow a multivariate normal distribution. Therefore, the control limit of the MEWMA chart can be used approximately for the WSD−MEWMA chart. The WSD–MEWMA chart reduces to the MEWMA chart for symmetric distributions (Chang,2007).
Equation
(12), Xij is
the
(14)
mean
of
quality
characteristic j in sample i and n is the sample size, while
θ j = Pr ( X ij ≤ µ j ) , µj
and
σj are the target
values of the mean and standard deviation of quality characteristic j, while, I denotes the identity matrix and ρ the correlation matrix of X. An out-of-control signal is detected when the chart’s statistic,
′ EiQ = ( M iQ ) Σ −M1 M iQ
(15)
5. The Proposed Weighted Variance (WV) MEWMA Chart
exceeds the control limit,
(Khoo and Atta,2008) proposed the univariate WVEWMA chart to improve the performance of the univariate WSD-EWMA and standard EWMA charts for skewed populations. In this article we will use WV method to improve the performance of the WSDMEWMA and standard MEWMA charts for skewed populations. The chart statistic is defined as
based on a desired in-control ARL when the underlying process is assumed to follow a multivariate normal distribution. Therefore, the control limit of the MEWMA chart can be used approximately for the WV−MEWMA chart. As in WSD–MEWMA chart, the WV–MEWMA chart also reduces to the MEWMA chart for symmetric distributions (Chang, 2007).
M iQ = λ Z iQ + ( I − λ ) M i−Q1 , fori = 1, 2, …, where
M 0Q = 0
and
hE , where hE is determined
(11)
λ = diag{λ 1 , λ 2 ,..., λ p } ,
0 < λ j ≤ 1 , for j = 1, 2, …, p. As long as, Z iQ follows a
6. Performance of the Proposed WV-MEWMA control chart
In this section, we compare the performance of the proposed WV-MEWMA chart with that of Standard multivariate normal distribution with mean vector 0 MEWMA chart and WSD-MEWMA chart developed by and variance-covariance matrix ρ ,if we assume that (Chang, 2007). These charts are compared based on the there is no a priori reason to weight past observations in-control and out-of-control Average Run Length 194 www.irjse.in
A Multivariate EWMA Control Chart for Skewed Populations using Weighted Variance Method
(ARLs). The out-of-control (ARL) is computed under zero state mode, where a mean shift is assumed to occur immediately after inspecting an entire sample or at the beginning of a new sample. In this paper,the bivariate normal, bivariate lognormal and Cheriyan and Rambhadran’s bivariate gamma distribution (Cheriyan, 1941; Rambhadran, 1951) are considered in the computation of the in-control ARLs. As for the out-ofcontrol ARLs computation, only bivariate lognormal distribution is considered because of space constraint. Note that, the lognormal distribution can only represent various skewnesses and correlations, but the gamma distribution can only represent some positive correlations, see (Kotz et al., 2000) for more details about these distributions. Here, for the convenience location parameters of (0, 0) are chosen for lognormal distribution, since the skewness does not depend on it, while the scale parameters of (1, 1) are chosen for gamma distribution. It is also assumed that the nominal in-control ARL is equal to 370.4, the same as in the univariate 3- sigma Shewhart control chart. The limits of the Standard MEWMA, WSD-MEWMA and WVMEWMA control charts are designed to be optimal for a process mean shift of size optimal
d ( µ1 ) = 1 . Note that the
λ = diag {0.125, 0,125}
and
the
corresponding limit for bivariate case of these charts is
hE = 10.4 . These optimal parameters are determined using the method discussed by (Lee and Khoo,2006). The correlation coefficient ρ = 0.3, 0.5 and 0.8 are considered for the in-control ARLs computations, while for the out-of-control computations, ρ = 0.5 is considered. It should also be noted, the selected parameters of the quality characteristics
( X1, X 2 )
from the bivariate lognormal distribution are chosen to give the desired skewness (α1 , α 2 ) . For the bivariate gamma
distribution,
the
shape
parameters
of
( X 1 , X 2 ) are determined so that the desired skewness (α1 , α 2 ) are achieved. The in-control ARLs are computed for (α1 , α 2 ) ϵ {(1,1), (1,2), (1,3), (2,2), (2,3), (3,3)} with sample size , n ϵ {1,3,5,7}, while the out-ofcontrol ARLs are computed for
(α1 , α 2 ) ϵ {(1,1), (2,2),
(3,3)} with sample size ofn = 5. Six direction of the process
mean
shifts
µ1 = ( µ1 + δ1σ 1 , µ2 + δ 2σ 2 )′ are size
of
the
µ0 = ( µ1 , µ 2 )′
from
to
considered and the
mean
shift
is
1
2 d ( µ1 ) = ( µ1 − µ0 )′ Σ −1 ( µ1 − µ0 ) .
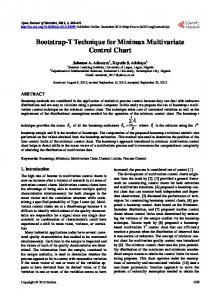
The six directions of mean shifts are similar to those considered by (Chang, 2007) (see Figure1). Note that, the process is in-control if out-of-control if at least
δ1 = δ 2 = 0 , and it will be
δj ≠0
for j =1 and 2. The in-
control and out-of-control ARLs are obtained from Monte Carlo simulations using SAS program version 9.3, where all the results are averages of 10000 replications. The in-control ARLs of the control charts are given in tables 1, 2 and 3. cells marked as (*) in tables 2 and 3 for Cheriyan and Rambhadran’s bivariate gamma distribution cannot be computed because the corresponding shape parameters of one of the gamma distributed components used in the transformation to compute variate
X2
X 2 have negative values.
X2
3
4
2 1
X1
X1
5 (a) Figure 1: Directions of a mean shift when (a) only
6 (b)
µ 1 is shifted (b) both µ 1 and µ 2 are shifted
Int. Res. J. of Science & Engineering, 2014; Volume 2, No. 6, November –December, 2014.
195
Atta et al., 2014 Atta et al., 2014
196 Table 1: In-Control ARL for bivariate distributions when ρ = 0.3. Distribution
Sample size, n
(γ , γ ) 1
www.irjse.in 196
1
2
3
WV− − MEWMA
WSD− − MEWMA
Standard MEWMA
WV− − MEWMA
WSD− − MEWMA
5 Standard MEWMA
7
WV− − MEWMA
WSD− − MEWMA
Standard MEWMA
WV− − MEWMA
WSD− − MEWMA
Standard MEWMA
370.40
370.40
370.40
370.40
357.14
357.14
Normal
(0, 0)
370.40
357.14
357.14
370.40
370.40
Log normal
(1, 1) (1, 2) (1, 3) (2, 2) (2, 3) (3, 3)
344.83 322.58 303.03 303.03 285.71 270.27
344.83 322.58 303.03 312.50 312.50 303.03
256.41 212.77 188.68 175.44 158.73 142.86
357.14 344.83 344.83 333.33 333.33 322.58
277.78 217.39 178.57 185.19 156.25 136.99
322.58 277.78 243.90 243.90 217.39 192.31
344.83 344.83 312.50 322.58 312.50 303.30
263.16 188.68 147.06 156.25 126.58 108.70
333.33 294.12 263.16 270.27 243.90 222.22
344.83 322.28 312.50 312.50 294.12 285.71
232.56 175.44 131.58 142.86 114.94 97.09
333.33 312.50 277.78 294.12 263.16 238.10
Gamma
(1, 1) (1, 2) (1, 3) (2, 2) (2, 3) (3, 3)
370.40 370.40 344.83 357.14 333.33 303.03
357.14 294.12 208.33 294.12 232.56 192.31
270.27 208.33 181.82 169.49 149.25 128.21
370.40 344.83 333.33 357.14 344.83 312.50
270.27 161.29 84.03 129.78 75.76 56.82
312.50 277.78 243.90 250.00 217.39 192.31
357.14 322.58 277.78 312.50 263.16 243.90
243.90 140.85 68.03 104.17 61.35 45.66
344.83 312.50 270.27 277.78 250.00 222.22
333.33 303.03 243.90 285.71 232.56 208.33
232.56 128.21 61.73 93.46 55.56 41.15
344.83 322.58 294.12 294.12 270.27 250.00
www.irjse.in
A Multivariate EWMA Control Chart for Skewed Populations using Weighted Variance Method
Distribution
(γ , γ ) 1
Sample size, n
2
1
3
5
7
WV− − MEWMA
WSD− − MEWMA
Standard MEWMA
WV− − MEWMA
WSD− − MEWMA
Standard MEWMA
WV− − MEWMA
WSD− − MEWMA
Standard MEWMA
WV− − MEWMA
WSD− − MEWMA
Standard MEWMA
Normal
(0, 0)
357.14
357.14
357.14
370.40
370.40
370.40
370.40
370.40
370.40
357.14
357.14
357.14
Lognormal
(1, 1)
344.83
357.14
256.41
370.40
294.12
312.50
357.14
270.27
322.58
344.83
256.41
333.33
(1, 2)
322.58
344.83
208.33
357.14
232.56
250.00
344.83
196.10
294.12
333.33
185.19
312.50
(1, 3)
303.03
322.58
185.19
344.83
188.68
238.10
322.58
151.52
263.16
312.50
136.99
277.78
(2, 2)
294.12
344.83
172.41
344.83
208.33
238.10
333.33
172.41
270.27
322.58
156.25
285.71
(2, 3)
277.78
344.83
156.25
344.83
178.57
204.10
322.58
142.86
238.10
303.03
128.21
256.41
(3, 3)
263.16
357.14
142.86
333.33
161.29
188.68
312.50
125.00
217.39
303.03
111.11
232.56
(1, 1)
357.14
344.83
253.81
357.14
270.27
319.18
370.40
256.41
339.56
357.14
357.14
321.96
(1, 2)
333.33
270.27
215.38
322.58
156.59
284.17
312.50
136.99
309.79
292.91
127.60
331.02
(1, 3)
*
*
*
*
*
*
*
*
*
*
*
*
(2, 2)
322.58
312.5
160.38
344.83
139.92
234.58
303.03
112.36
266.67
285.96
103.36
293.34
(2, 3)
285.71
243.90
140.86
322.58
81.21
212.36
264.41
64.72
248.94
232.56
58.98
266.31
(3, 3)
277.78
243.90
124.64
333.33
64.29
175.32
248.32
50.61
216.68
216.22
46.09
239.18
Gamma
197
Int. Res. J. of Science & Engineering, 2014; Volume 2, No. 6, November –December, 2014.
197
A Multivariate EWMA Control Chart for Skewed Populations using Weighted Variance Method
Int. Res. J. of Science & Engineering, 2014; Volume 2, No. 6, November –December, 2014.
Table 2: In-Control ARL for bivariate distributions when ρ = 0.5.
Atta et al., 2014 Atta et al., 2014
198
Table 3. In-Control ARL for bivariate distributions when ρ = 0.8 Distributio n
Sample size, n
(γ , γ ) 1
www.irjse.in 198
1
2
3
WV− − MEWMA
WSD− − MEWMA
Standard MEWMA
WV− − MEWMA
5
7
WSD− − MEWMA
Standard MEWMA
WV− − MEWMA
WSD− − MEWMA
Standard MEWMA
WV− − MEWMA
WSD− − MEWMA
Standard MEWMA
Normal
(0, 0)
357.14
357.14
357.14
370.40
370.40
370.40
370.40
370.40
370.40
357.14
357.14
357.14
Lognormal
(1, 1) (1, 2) (1, 3) (2, 2) (2, 3) (3, 3)
334.11 310.27 295.51 282.73 266.10 250.00
369.00 330.14 303.03 377.93 370.40 394.32
252.08 202.76 183.72 165.51 151.84 138.01
370.40 357.14 335.91 343.76 333.78 322.97
309.41 225.89 171.38 236.46 203.92 196.08
308.07 265.39 225.53 229.73 202.80 180.86
357.41 335.91 323.73 337.72 331.35 326.58
285.71 193.05 131.89 194.17 159.54 148.32
324.04 291.63 248.08 263.23 230.26 208.55
349.89 320.51 301.57 326.69 318.98 315.56
271.89 175.07 117.40 175.22 138.77 129.28
333.56 302.39 209.29 279.49 249.13 228.89
Gamma
(1, 1) (1, 2) (1, 3) (2, 2) (2, 3) (3, 3)
291.72 * * 226.45 * 196.77
303.67 * * 246.61 * 215.38
226.71 * * 140.02 * 111.52
344.83 * * 275.79 * 242.66
273.33 * * 142.86 * 69.61
310.08 * * 202.80 * 153.61
357.14 * * 273.97 * 214.18
261.71 * * 118.40 * 55.44
331.24 * * 243.78 * 185.51
330.69 * * 262.95 * 195.2
248.32 * * 109.66 * 49.93
344.83 * * 268.31 * 210.70
www.irjse.in
A Multivariate EWMA Control Chart for Skewed Populations using Weighted Variance Method
d ( µ1 )
Case
0.5
1
2
0.75
1
2
1
1
2
1.25
1
2
µ1 is shifted, ρ = 0.5 and n =5
WV− − MEWMA
WSD− − MEWMA
Standard MEWMA
d ( µ1 )
Case
(γ 1 , γ 2 )
WV− − MEWMA
WSD− − MEWMA
Standard MEWMA
(1, 1)
10.09
10.66
9.49
1.5
1
(1, 1)
2.73
2.85
2.60
(2, 2)
10.53
11.25
9.63
(2, 2)
2.82
3.03
2.61
(3, 3)
10.80
11.40
9.75
(3, 3)
2.87
3.14
2.61
(γ 1 , γ 2 )
(1, 1)
8.58
7.90
9.31
(2, 2)
7.91
6.79
9.26
2
(3, 3)
7.44
6.05
9.22
(1, 1)
5.80
6.08
5.53
(2, 2)
6.01
6.43
5.55
(2, 2)
2.42
2.62
2.24
(3, 3)
6.13
6.59
5.60
(3, 3)
2.48
2.73
2.25
(1, 1)
5.12
4.80
5.46
(1, 1)
2.16
2.10
2.25
1.75
1
2
(1, 1)
2.45
2.34
2.60
(2, 2)
2.34
2.19
2.58
(3, 3)
2.27
2.10
2.57
(1, 1)
2.35
2.46
2.25
(2, 2)
4.81
4.26
5.44
(2, 2)
2.11
1.98
2.24
(3, 3)
4.58
3.88
5.42
(3, 3)
2.08
1.85
2.23
(1, 1)
4.14
4.33
3.95
(1, 1)
2.09
2.17
2.03
(2, 2)
4.27
4.59
4.00
(2, 2)
2.13
2.29
2.01
(3, 3)
4.36
4.74
4.00
(3, 3)
2.15
2.39
2.00
(1, 1)
3.71
3.50
3.93
(2, 2)
3.51
3.14
3.92
(3, 3)
3.36
2.88
3.90
(1, 1)
3.26
3.41
3.12
(2, 2)
3.37
3.62
3.12
(3, 3)
3.43
3.75
3.12
(1, 1)
2.94
2.78
3.11
(2, 2)
2.78
2.52
(3, 3)
2.66
2.36
2
1
2
(1, 1)
2.01
1.93
2.07
(2, 2)
1.97
1.75
2.07
(3, 3)
1.93
1.55
2.07
(1, 1)
1.58
1.71
1.44
(2, 2)
1.70
1.86
1.46
(3, 3)
1.77
1.92
1.47
(1, 1)
1.25
1.16
1.39
3.11
(2, 2)
1.16
1.07
1.37
3.11
(3, 3)
1.11
1.04
1.35
199
Int. Res. J. of Science & Engineering, 2014; Volume 2, No. 6, November –December, 2014.
3
1
2
199
A Multivariate EWMA Control Chart for Skewed Populations using Weighted Variance Method
Int. Res. J. of Science & Engineering, 2014; Volume 2, No. 6, November –December, 2014.
Table 4: Out of control ARL for Cases1 and 2 when only
Atta et al., 2014 Table 5. Out Of Control ARL for Case 3,4,5 and 6 when
d ( µ1 ) 0.5
Case
3
4
5
6
0.75
3
4
5
6
1
3
4
5
6
1.25
3
4
5
6
200
(γ 1 , γ 2 )
µ1 and µ 2 are shifted,ρρ = 0.5 and n =5 d ( µ1 )
Case
6.50 9.63 10.00 9.41 9.45 9.49 9.31 9.25 9.19 9.40 9.44 9.48
1.5
3
6.50 7.35 8.00 5.33 5.01 4.71 4.60 4.00 3.60 5.33 5.01 4.71
5.53 5.57 5.62 5.50 5.50 5.49 5.45 5.42 5.39 5.50 5.49 5.50
1.75
4.22 4.44 4.59 3.90 3.82 3.74 3.64 3.41 3.24 3.90 3.82 3.74
4.53 5.00 5.35 3.85 3.66 3.48 3.39 3.00 2.72 3.85 3.66 3.48
4.00 4.00 3.98 3.94 3.94 3.93 3.92 3.91 3.89 3.94 3.94 3.93
2
3.31 3.46 3.56 3.09 3.03 2.98 2.89 2.71 2.58 3.09 3.03
3.53 3.85 4.10 3.05 2.92 2.80 2.71 2.43 2.27 3.05 2.92
3.12 3.13 3.13 3.12 3.12 3.12 3.11 3.10 3.10 3.12 3.12
3
WV− − MEWMA
WSD− − MEWMA
Standard MEWMA
(1, 1) (2, 2) (3, 3) (1, 1) (2, 2) (3, 3) (1, 1) (2, 2) (3, 3) (1, 1) (2, 2) (3, 3)
10.63 11.64 12.42 9.25 8.94 8.64 8.25 7.44 6.91 9.24 8.93 8.63
12.00 14.52 16.59 9.00 8.26 7.59 7.37 6.15 5.42 9.00 8.25 7.58
(1, 1) (2, 2) (3, 3) (1, 1) (2, 2) (3, 3) (1, 1) (2, 2) (3, 3) (1, 1) (2, 2) (3, 3)
5.99 6.37 6.64 5.43 5.29 5.15 4.99 4.62 4.36 5.42 5.28 5.15
(1, 1) (2, 2) (3, 3) (1, 1) (2, 2) (3, 3) (1, 1) (2, 2) (3, 3) (1, 1) (2, 2) (3, 3) (1, 1) (2, 2) (3, 3) (1, 1) (2, 2) (3, 3) (1, 1) (2, 2) (3, 3) (1, 1) (2, 2)
www.irjse.in
4
5
6
3
4
5
6
3
4
5
6
3
4
5
6
(γ 1 , γ 2 )
WV− − MEWMA
WSD− − MEWMA
Standard MEWMA
(1, 1) (2, 2) (3, 3) (1, 1) (2, 2) (3, 3) (1, 1) (2, 2) (3, 3) (1, 1) (2, 2) (3, 3)
2.76 2.88 2.95 2.58 2.53 2.48 2.42 2.30 2.22 2.58 2.53 2.48
2.93 3.17 3.35 2.55 2.50 2.40 2.30 2.13 2.04 2.56 2.50 2.37
2.61 2.61 2.62 2.60 2.60 2.60 2.58 2.57 2.55 2.60 2.60 2.60
(1, 1) (2, 2) (3, 3) (1, 1) (2, 2) (3, 3) (1, 1) (2, 2) (3, 3) (1, 1) (2, 2) (3, 3)
2.37 2.48 2.55 2.24 2.21 2.18 2.14 2.09 2.06 2.24 2.21 2.18
2.52 2.73 2.87 2.23 2.20 2.14 2.10 1.94 1.78 2.22 2.20 2.14
2.25 2.25 2.25 2.25 2.23 2.22 2.24 2.23 2.22 2.25 2.24 2.22
(1, 1) (2, 2) (3, 3) (1, 1) (2, 2) (3, 3) (1, 1) (2, 2) (3, 3) (1, 1) (2, 2) (3, 3)
2.21 2.16 2.21 2.05 2.04 2.03 2.00 1.95 1.90 2.04 2.04 2.03
2.55 2.39 2.54 2.04 2.02 2.00 1.92 1.70 1.50 2.04 2.02 2.00
2.00 2.02 2.00 2.05 2.04 2.04 2.06 2.07 2.07 2.05 2.04 2.04
(1, 1) (2, 2) (3, 3) (1, 1) (2, 2) (3, 3) (1, 1) (2, 2) (3, 3) (1, 1) (2, 2)
1.60 1.72 1.78 1.39 1.33 1.29 1.24 1.14 1.09 1.38 1.34
1.74 1.88 1.93 1.36 1.30 1.21 1.14 1.05 1.03 1.36 1.30
1.44 1.47 1.48 1.41 1.41 1.41 1.39 1.36 1.35 1.41 1.41
A Multivariate EWMA Control Chart for Skewed Populations using Weighted Variance Method
Additionally, when
ρ = 0.8, table 3 presents that the
WV-MEWMA chart outperforms the WSD-MEWMA and standard MEWMA charts in terms of in-control ARLs for all of the skewnesses levels and sample sizes, except for the case when the sample size of lognormal distribution equals 1, where WSD-MEWMA chart has large in-control ARLs. In general, the proposed WVMEWMA chart has the largest in-control ARLs than the WSD-MEWMA and standard MEWMA charts for all levels of skewnesses
(α1 , α 2 ) and sample sizes, n,
and
also all of the correlations, ρ = 0.3, 0.5 and 0.8. Tables 4 and 5 show the out-of-control ARLs of the control charts. As could be observed, the proposed WVMEWMA chart outperforms the WSD-MEWMA chart in cases 1 and 3, and it has lower out-of-control ARLs than the standard MEWMA chart in cases 2 ,4,5and 6 when
d ( µ1 ) ò( 0.5, 0.75, 1, 1.25, 1.5, 1.75, 2 and 3) . The tables also show that the WV-MEWMA chart has about the same out-of-control ARLs as compared to WSD-MEWMA chart in cases 2,4,5 and 6. Overall, the proposed WV-MEWMA chart is found to have the most favourable performance among the charts considered in this study. The proposed WV-MEWMA chart gives large in-control ARLs compared to the other charts for skewed distributions. The proposed WV-MEWMA chart also provides the comparable performance in terms of out-of-control ARLs, for positive and negative directions of shifts (cases 1,2,3,5 and 6).
CONCULSION This article proposed a simple heuristic WV-MEWMA chart for skewed populations to overcome the problem of low in-control ARLs due to the violation of normality assumptions. The proposed method adjusts the variance-covariance matrix to reflect the skewness. This chart reduces to the standard MEWMA chart when the underlying distribution is symmetric. This study showed how the standard MEWMA and WSD-MEWMA control charts performance can significantly enhanced by using the WV approach in the construction of WVMEWMA chart. The simulation study showed that the WV-MEWMA chart has larger in-control ARLs as compared to WSD-MEWMA and standard MEWMA charts for almost all levels of skewnesses
(α1 , α 2 ) and
sample sizes, n =1,3,5 and 7 under lognormal and gamma distributions. The simulation study also showed that the proposed WV-MEWMA chart has good out-ofcontrol ARLs regardless of the levels of skewnesses
(α 1 , α 2 ) shifts,
and
magnitude
of
d ( µ1 ) ò( 0.5, 0.75, 1, 1.25, 1.5, 1.75, 2 and 3) . From the findings, we can assure that this chart (WVMEWMA) can be a good alternative to the WSDMEWMA and standard MEWMA charts for skewed populations.
REFERENCES 1. Bai DS and Choi IS. X and R control charts for skewed populations, Journal of Quality Technology, 1995;27: 120 – 131. 2
2. Chang YS and Bai DS. A multivariate T control chart for skewed populations using weighted standard deviations, Quality and Reliability Engineering International, 2004;20: 31 – 46. 3. Chang YS. Multivariate CUSUM and EWMA control charts for skewed populations using weighted standard deviations, Communications in Statistics − Simulation and Computation, 2007;36: 921 – 936. 4. Cheriyan KC. A bivariate correlated gamma – type distribution function, Journal of the Indian Mathematical Society, 1941;5: 133 – 144. 5. Hawkins DM, Choi S and Lee S. A general multivariate exponentially weighted moving average control chart, Journal of Quality Technology, 2007;39:118 –125. 6. Khoo MBC, Atta AMA and Zhang Wu. A Multivariate Synthetic control chart for monitoring the process mean vector of skewed populations using weighted standard deviations, Communications in Statistics – Simulation and Computation, 2009; 38: 1493 – 1518. 7. Khoo MBC, Atta AMA. and Chen C-H. Proposed X and S control charts forskewed distributions, Proceedings of the International Conference on Industrial Engineering and Engineering Management (IEEM 2009), Dec. 2009 pp. 389-393, Hong Kong. 8. Khoo MBC. and Atta AMA. An EWMA control chart for monitoring the mean of skewed populations using weighted variance, Proceedings of the International Conference on Industrial Engineering and Engineering Management (IEEM 2008), Dec. 2008 pp. 218-223, Singapore. 9. Kim K and Reynolds Jr M R. Multivariate monitoring using an MEWMA control chart with unequal sample sizes, Journal of Quality Technology, 2005;37: 267 – 281. 10. Kotz S, Balakrishnan N and Johnson NL.Continuous multivariate distributions, Vol. 1 (2nd edition). John Wiley and Sons, Inc., New York 2000. 11. Lee MH and Khoo MBC. Optimal statistical design of a multivariate EWMA chart based on ARL and MRL, Communications in Statistics – Simulation and Computation, 2006;35 : 831 – 847.
Int. Res. J. of Science & Engineering, 2014; Volume 2, No. 6, November –December, 2014.
201
Atta et al., 2014 12. Lucas JM and Saccucci MS. Exponentially weighted moving average control schemes: properties and enhancements, Technometrics, 1990;32:1 – 12. 13. Pan X. An alternative approach to multivariate EWMA control chart, Journal of Applied Statistics, 2005;32: 695 – 705. 14. Prabhu SS and Runger GC. Designing a multivariate EWMA control chart, Journal of Quality Technology, 1997;29:8 – 15. 15. Rambhadran VR. A multivariate gamma – type distributions, Sankhya, 1951;11:45 –46. 16. Reynolds MR. and Kim K. Multivariate monitoring of the process mean vector with sequential sampling, Journal of Quality Technology, 2005;37:149 –162. 17. Runger GC, Keats B, Montgomery DC and Scanton RD.Improving the performance of the multivariate exponentially weighted moving average control chart, Quality and Reliability Engineering International, 1999;15:161 – 166. 18. Stoumbos ZG and Sullivan JH. Robustness to nonnormality of the multivariate EWMA control chart, Journal of Quality Technology, 2002;34:260 – 276. 19. Sullivan JH and Woodall WH. A control chart for preliminary analysis of individual observations, Journal of Quality Technology, 1996;28:265-278. 20. Yeh AB, Huwang Land Wu CW.A multivariate EWMA control chart for monitoring process variability with individual observations, IIE Transactions, 2005;37:1023-1035. 21. Yumin L. An improvement for MEWMA in multivariate process control, Computers and Industrial Engineering, 1996;31:779 – 781.
© 2014| Published by IRJSE
202
www.irjse.in