A neural circuit transforming temporal periodicity information into a rate-based representation in the mammalian auditory system Ulrike Dicke and Stephan D. Ewert Carl von Ossietzky Universität Oldenburg, Medizinische Physik, D-26111 Oldenburg, Germany
Torsten Daua兲 Centre for Applied Hearing Research, Ørsted•DTU, Technical University of Denmark, DK-2800 Kgs. Lyngby, Denmark
Birger Kollmeier Carl von Ossietzky Universität Oldenburg, Medizinische Physik, D-26111 Oldenburg, Germany
共Received 26 May 2006; revised 24 October 2006; accepted 26 October 2006兲 Periodic amplitude modulations 共AMs兲 of an acoustic stimulus are presumed to be encoded in temporal activity patterns of neurons in the cochlear nucleus. Physiological recordings indicate that this temporal AM code is transformed into a rate-based periodicity code along the ascending auditory pathway. The present study suggests a neural circuit for the transformation from the temporal to the rate-based code. Due to the neural connectivity of the circuit, bandpass shaped rate modulation transfer functions are obtained that correspond to recorded functions of inferior colliculus 共IC兲 neurons. In contrast to previous modeling studies, the present circuit does not employ a continuously changing temporal parameter to obtain different best modulation frequencies 共BMFs兲 of the IC bandpass units. Instead, different BMFs are yielded from varying the number of input units projecting onto different bandpass units. In order to investigate the compatibility of the neural circuit with a linear modulation filterbank analysis as proposed in psychophysical studies, complex stimuli such as tones modulated by the sum of two sinusoids, narrowband noise, and iterated rippled noise were processed by the model. The model accounts for the encoding of AM depth over a large dynamic range and for modulation frequency selective processing of complex sounds. © 2007 Acoustical Society of America. 关DOI: 10.1121/1.2400670兴 PACS number共s兲: 43.64.Bt, 43.64.Qh 关BLM兴
I. INTRODUCTION
Amplitude modulations 共AMs兲 are a common physical feature produced by many natural sound sources such as vocal cords, strings, pipes and tubes. Amplitude modulation information is utilized by the auditory system in a variety of complex auditory tasks, including speech perception 共e.g., Rosen, 1992兲, pitch perception 共e.g., Schouten et al., 1962; De Boer, 1976兲 and auditory scene analysis 共e.g., Bregman, 1990兲. However, the mechanisms by which the auditory system extracts, encodes and processes AM information are not yet fully understood 共for a review, see Joris et al., 2004兲. While AM information is encoded in temporal activity patterns of neurons at the early stages of the auditory system, it is generally believed that this temporal periodicity code is transformed into a rate-based code at some higher stage of auditory processing 共Rees and Møller, 1983; Schreiner and Langner, 1988; Lorenzi et al., 1995; Schulze and Langner, 1997兲. Such a rate-based periodicity code also corresponds to the psychophysical concept of amplitude modulation filters that have been suggested to account for the modulation frequency selectivity observed in psychophysical masking ex-
a兲
Author to whom correspondence should be addressed. Electronic mail:
[email protected]
310
J. Acoust. Soc. Am. 121 共1兲, January 2007
Pages: 310–326
periments 共Bacon and Grantham, 1989; Houtgast, 1989; Dau et al., 1997a, b; Ewert and Dau, 2000兲. However, while the psychophysically derived modulation filters may provide a way of effectively describing perceptual masking data, it remains unclear how such filters might be realized neurally in the auditory system. Likewise, having a nonlinear neural circuit at hand that produces the above transformation using simple stimuli such as sinusoidally modulated tones, it is not clear to what extent the properties of the circuit are compatible with a 共linear兲 modulation filter bank concept motivated by the psychophysical data. Both aspects are addressed in the current study. Physiological experiments have revealed that the average spike rates of auditory-nerve 共AN兲 fibers are largely independent of stimulus modulation frequency 共Rose and Capranica, 1985; Joris and Yin, 1992; Rhode and Greenberg, 1994兲, indicating that AN fibers are not selective to certain modulation frequencies in terms of their spike rate. The temporal modulation transfer functions 共tMTFs兲 of AN fibers, where modulation gain is computed in response to different modulation frequencies, have a low-pass shape with cutoff frequencies below 1 kHz 共Javel, 1980; Palmer, 1982; Kim et al., 1990; Joris and Yin, 1992; Rhode and Greenberg, 1994兲. Moreover, AM information is inherent in the interspike intervals 共ISI兲 of AN fibers 共Rose, 1970; Evans, 1978兲, indi-
0001-4966/2007/121共1兲/310/17/$23.00
© 2007 Acoustical Society of America
cating that AMs are encoded in the temporal activity patterns of AN fibers. The majority of neurons in the cochlear nucleus 共CN兲 have been found to display flat or low-pass rate modulation transfer functions 共rMTFs兲, where spike rate is computed in response to different stimuli 共Kim et al., 1990; Rhode, 1994; Backoff et al., 1999兲. Since the temporal synchronization of CN neurons to AM stimuli exceeds that of AN fibers, temporal AM information present in the activity patterns of AN fibers seems to be enhanced by CN neurons 共Frisina et al., 1990; Kim et al., 1990; Rhode, 1994; Rhode and Greenberg, 1994; Joris et al., 2004; Palmer, 1995兲. Thus, since CN neurons are not selective to a certain modulation frequency in terms of their spike rate, AM information can be assumed to be encoded in their temporal activity patterns. While AN fibers and CN neurons have been found to synchronize to modulation frequencies as high as 1 kHz 共Javel, 1980; Frisina et al., 1990; Rhode and Smith, 1986; Backoff et al., 1999兲, the highest modulation frequency for which temporal synchronization has been observed in the auditory midbrain differs from below 120– 150 Hz 共Rees and Møller, 1983; Krishna and Semple, 2000兲 up to 1000 Hz 共Langner, 1981兲. Despite this diversity, there is general agreement among authors that the ability of neurons to synchronize to fast amplitude modulations decreases along the ascending auditory pathway 共Rees and Møller, 1983; Langner and Schreiner, 1988兲. Moreover, at the level of the inferior colliculus 共IC兲, neurons have been found that exhibit bandpass shaped rMTFs 共Rees and Møller, 1983; Langner and Schreiner, 1988; Rees and Palmer, 1989; Krishna and Semple, 2000兲. In contrast to CN neurons, these neurons are selective to a certain modulation frequency and respond with a maximum spike rate when stimulated with their so-called best modulation frequency 共BMF兲. Furthermore, rate BMFs have been found to be topographically organized in the central nucleus of the IC covering a BMF range of 10– 1000 Hz 共Schreiner and Langner, 1988, 1997兲. Three biologically motivated models have been presented previously, suggesting different mechanisms of how temporal AM information can be transformed into a ratebased representation between the CN and IC. The neural circuit suggested by Langner 共1981兲 共see also Langner and Schreiner, 1988; Langner, 1997a, b兲 consists of three functional units at the model CN stage, a trigger unit, a buildup circuit, and an oscillator circuit, with each of these units being associated with a specific neural response type in the CN. At the model IC stage, a coincidence detector unit is located that represents the model output unit. According to Langner 共1981兲, the response types and the neural connectivity of his model units result in a bandpass shaped rMTF of the IC coincidence detector unit. In order to yield a number of bandpass rMTFs with different BMFs, a number of such neural circuits are needed that differ in the integration time constant of the CN buildup circuit. Based on the specific assumptions in his model, Langner 共1997a, b兲 predicts that IC bandpass units can only reveal BMFs that are integer multiples of the stimulus carrier frequency. However, such a relationship between the BMFs of IC neurons and the stimulus carrier frequency could not be confirmed in electrophysiological recordings 共Krishna and Semple, 2000兲. Since the J. Acoust. Soc. Am., Vol. 121, No. 1, January 2007
model has not been tested extensively, it is difficult to predict whether a physiologically plausible range of integration time constants used within the buildup circuit of the CN model stage can account for the large range of BMFs observed in the data 共Schreiner and Langner, 1988, 1997兲. The second biologically motivated model describing the transformation of temporal periodicity information into a rate-based representation was suggested by Hewitt and Meddis 共1994兲. The CN stage of their model employs populations of simulated chopper units 共Hewitt et al., 1992兲 that are morphologically associated with stellate cells in the ventral cochlear nucleus 共VCN兲 共Rhode et al., 1983; Smith and Rhode, 1989兲. While the chopping frequencies of units within one population are identical, the chopping frequencies among different populations of chopper units differ. Coincidence detector units are located at the model IC stage, with each coincidence detector receiving convergent input from one population of chopper units. If an amplitude modulated stimulus is presented to the model, the chopper units whose chopping frequencies resemble the modulation frequency of the stimulus synchronize best to the stimulus modulation. Thus, this population of chopper units provides a highly synchronized input to its subsequent IC coincidence detector. In contrast, the activity within populations of units whose chopping frequencies differ from the stimulus modulation is less synchronized. The IC coincidence detectors that are driven by these populations receive less synchronized input and respond with a lower spike rate. The model by Hewitt and Meddis 共1994兲 therefore transforms the bandpass shaped tMTFs observed in VCN chopper units into bandpass shaped rMTFs. The different BMFs of different IC coincidence detector units hereby result from different chopping frequencies among the populations of chopper units. The different BMFs are thus obtained from changing a temporal parameter of the simulated chopper units. However, it is not clear whether the range of BMFs 共150– 700 Hz兲 found in the tMTFs of VCN chopper units 共e.g., Frisina et al., 1990; Rhode and Greenberg, 1994兲 matches the range of BMFs observed in IC recordings 共Schreiner and Langner, 1988, 1997兲. The most recent biologically motivated model describing the formation of bandpass shaped rMTFs in IC neurons was suggested by Nelson and Carney 共2004兲. The CN stage of their model employs a VCN bushy cell that receives undelayed excitatory AN input and delayed inhibitory AN input. The model bushy cell projects onto the model IC neuron in the same manner, i.e., it provides undelayed excitatory input and delayed inhibitory input. The interaction of excitatory and inhibitory synaptic inputs results in a bandpass shaped rMTF at the model IC neuron if the excitatory synapses are assumed to be faster and weaker than the inhibitory synapses. Different BMFs within different IC model neurons are obtained by varying the time courses of the synaptic inputs. Thus, similar to the models by Langner 共1981兲 and by Hewitt and Meddis 共1994兲, different BMFs are gained from systematic changes in the temporal model parameters. The IC stage of the model by Nelson and Carney 共2004兲 does not seem to be critical for the generation of bandpass shaped rMTFs since these would already result at the CN model unit Dicke et al.: A neural circuit for periodicity coding
311
if the same parameters were used for its excitatory and inhibitory synaptic inputs as for the IC model unit. In contrast to the existing models where temporal model parameters are systematically changed in order to obtain different BMFs within different model units, the modeling approach presented here employs a nontemporal mechanism and therefore differs conceptually from the previous approaches. As in the previous modeling studies, the present model reflects a biologically motivated circuit based on simulated unit responses that can be associated with neural response types. For example, simulated responses of ideal onset 共OI兲 units, a response type observed in the posteroventral cochlear nucleus 共PVCN兲, are chosen to provide the temporal information in the present model. This is due to the so-called “entrainment” property, i.e., the generation of exactly one spike per stimulus period, as found in OI units in response to AM stimuli with modulation frequencies below about 800 Hz 共e.g., Rhode and Smith, 1986; Rhode, 1994兲. Another focus of this study is related to the nonlinear processing inherent in the spike processes of a neural model. In contrast to models that deal with the simulation of continuous, average 共population兲 spike rates or spike probabilities 共like, e.g., Nelson and Carney, 2004兲, the process of spike generation and the simulation of neural responses on a spike level involves strong nonlinearities. The continuous fluctuations in the stimulus waveform or envelope are thereby transformed into a binary pulse or spike code, subjected to a neural circuit and are transformed back to a spike rate reflecting again a continuous quantity. Since the process that establishes the bandpass shaped rMTFs in the present model is realized by a simulation of spikes, it is not clear in advance to what extent the bandpass rMTFs behave like bandpass filters in complex stimulus conditions. A bandpass filtering operation in the envelope domain, as suggested in psychoacoustical studies in humans 共e.g., Dau et al., 1997a; Ewert and Dau, 2000兲 would imply properties of a limited resolution spectral decomposition of the stimulus’ envelope. In the first part of the study, the model is presented and the simulated responses of the individual stages are described and explained, whereby simple stimuli are used, such as high-frequency tone bursts and sinusoidally amplitudemodulated 共SAM兲 tones. It will be shown that the model can account for several key observations in the experimental response properties of the different units, as described in the literature. Specifically, the model accounts for the transformation of temporal AM information into a rate-based respresentation of stimulus periodicity. The model is tested with SAM tones of different stimulation levels and modulation depths. In the second part of the study, the model is tested with complex stimuli, such as pure tones modulated by the sum of two sinusoids, narrowband noises, and iterated rippled noise 共IRN兲. The simulated responses to complex envelope waveforms might reveal important information in two ways. First, since the neural circuit is highly nonlinear, it is not clear if the model is able to separate different components in the envelope spectrum as it would be expected from a linear modulation filterbank analysis. Second, complex envelope waveforms have not yet been systematically investi312
J. Acoust. Soc. Am., Vol. 121, No. 1, January 2007
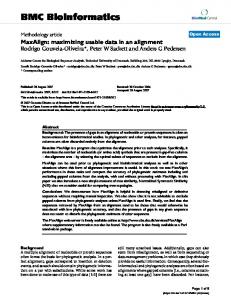
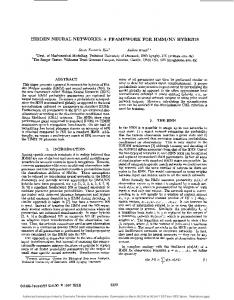
FIG. 1. The architecture of the present model. The model is a cascade of three stages: 共i兲 the peripheral processing stages 共bottom兲, 共ii兲 the CN stage that includes an entrainment 共EN兲 unit and a number of constant-rate 共CR兲 units 共middle兲 and 共iii兲 the IC stage of the model 共top兲 that includes low-pass 共LP兲 and bandpass 共BP兲 units. Excitatory synaptic connections between model units are represented by arrows and inhibitory synapses by filled circles.
gated in physiological studies. The model thus might be useful to validate hypotheses about the processing of these complex sounds in units that exhibit a bandpass rMTF. II. MODEL A. General model structure
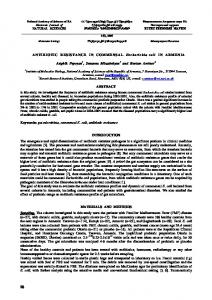
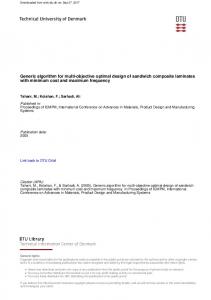
Here, an overview of the model structure and a description of the function of the circuit are provided. More detailed information about the individual stages of the model are given in Sec. II B. Figure 1 shows a schematic representation of the model of the present study. The model is a cascade of three stages: 共i兲 peripheral processing 共bottom兲, 共ii兲 CN processing 共middle兲, and 共iii兲 IC processing 共top兲. Excitatory synaptic connections are represented by arrows while inhibitory synaptic connections are represented by filled circles. The peripheral processing stage includes basilar-membrane filtering, inner hair-cell transduction and a simulation of AN activity. The CN stage of the schematic model circuit contains three neurons, each of which receives excitatory input from the ascending AN fibers: an entrainment 共EN兲 neuron and two constant-rate 共CR兲 neurons. All model CN units project onto the IC stage of the model that consists of three different neurons, two low-pass 共LP兲 units and one bandpass 共BP兲 unit. Each LP unit of the model IC stage receives inhibitory input from the EN unit and excitatory input provided by a different number of CR units of the CN stage. Hereby, the first LP unit receives input from one CR unit and the second LP unit receives input from both CR units. In order to illustrate the basic function of the circuit, Fig. 2 shows the expected idealized rMTFs of each model unit in response to 100% SAM tones at a carrier frequency equal to the characteristic frequency of the neural circuit. The idealized rMTF of the EN model unit is shown in the lower left panel of Fig. 2. Here, the spike rate of the EN unit corresponds to the stimulus modulation rate up to 800 Hz. Thus, in response to modulations of rates below 800 Hz, the EN unit entrains to the stimulus modulation, emitting exactly one spike per stimulus period. If the modulation frequency exceeds 800 Hz, the EN unit can no longer follow the fast Dicke et al.: A neural circuit for periodicity coding
FIG. 2. Schematic rMTFs of the different model units: CN entrainment 共EN兲 unit 共lower left panel兲, CN constant-rate 共CR兲 units 共lower right panel兲, IC lowpass 共LP兲 units 共upper left panel兲 and IC bandpass 共BP兲 unit 共upper right panel兲.
stimulus modulation. In this case, the unit generates only one spike at stimulus onset. The lower right panel of Fig. 2 shows the idealized rMTFs of the two CR units in the CN stage. The two lines in the figure are shown at slightly different levels for visualization purposes. Both CR units exhibit a flat rMTF, i.e., their spike rate 共of about 100 Hz in this example兲 does not depend on the stimulus modulation frequency. The upper left panel of Fig. 2 illustrates the resulting rMTFs of the two LP units. Within a certain range of modulation frequencies, the activity of both LP units is suppressed, due to the inhibitory contribution provided by the EN unit of the CN stage. As the spike rate of the EN unit reflects the stimulus modulation frequency, it provides little inhibition at low modulation frequencies, and the spike rate of the LP units reflects the excitatory contribution from their CR input units. With increasing modulation rate, the inhibition provided by the EN model unit increases until it exceeds the excitatory contribution from the CR units and suppresses the activity of the LP unit. The activity of the LP unit remains suppressed until the modulation frequency exceeds 800 Hz when the EN unit fails to entrain and instead exhibits an onset response. At such high modulation frequencies, the activity of the LP unit again reflects the excitatory input of its CR input units. The activity of the first LP unit 共dashed line兲, receiving excitatory input from only one CR neuron, becomes suppressed if the stimulus modulation exceeds 100 Hz. In contrast, the second LP unit 共solid line兲, that receives excitatory input from both CR neurons, is not suppressed below a stimulus modulation frequency of 200 Hz. The model output unit is the BP unit of the IC stage, which receives inhibitory input from the first LP unit 共dashed line兲 and excitatory input from the second LP unit 共solid line兲. Within the model, the inhibitory LP unit input is specified to have a greater synaptic efficiency than the excitatory LP unit input. This results in a bandpass shaped rMTF of the model BP units as shown in the upper right panel of Fig. 2. Since the modulation frequency at which an individual LP unit becomes suppressed depends on how many CR units project onto that unit, different BMFs of the model BP units J. Acoust. Soc. Am., Vol. 121, No. 1, January 2007
are obtained from varying the number of CR input units in the present neural circuit. Thus, a rate-based representation of AM is obtained by varying the number of CR units providing input to the different LP model units. B. Processing stages of the model 1. Auditory periphery
Basilar-membrane filtering is simulated using a bank of fourth-order gammatone filters 共Patterson et al., 1988兲 with center frequencies spaced according to the equivalent rectangular bandwidth scale. A more sophisticated, nonlinear filterbank was not used in the current study since the effect of peripheral nonlinearity on amplitude modulation processing was assumed to be not critical for the functioning of the neural circuit proposed here. The output of each gammatone filter serves as input to Meddis’ model of the mechanical-toneural transduction at the hair-cell-auditory nerve synapse 共Meddis, 1986, 1988; Meddis et al., 1990兲. The output is the instantaneous AN discharge rate function in response to arbitrary stimuli. The discharge rate at a particular point in time can be considered as being proportional to the probability that a spike is generated. Since the frequency range and the number of AN fibers projecting onto the two types of CN model units differ largely, the AN input of these units is computed separately, as described below. 2. General neuron model dynamics
All model units are simulated by a point neuron model with an integrate-to-threshold dynamic 共Tuckwell, 1988兲 using a modified version of the MacGregor point neuron model 共MacGregor, 1987; Arle and Kim, 1991兲. In order to simulate the distinct temporal response properties of the model EN unit, this unit has some specific additional properties which are described in Sec. II B 3. Specific details about the CR unit are given in Sec. II B 5. In the point neuron model, each presynaptic spike arriving at a model unit causes a postsynaptic current I共t兲 that contributes to the membrane potential Vm共t兲 of the cell. For Dicke et al.: A neural circuit for periodicity coding
313
TABLE I. Simulation parameters of the CR, LP, and BP model units. Parameter Vrest m k G b ⌰act 共ex兲 共in兲 g0 共ex兲 g0 共in兲
Description
CR
LP
BP
Membrane equilibrium potential Membrane time constant Potassium time constant Total resting conductance Potassium conductance change Spike threshold EPSC time constant IPSC time constant Conductance of an excitatory synapse Conductance of an inhibitory synapse
−60 mV 3 ms 1.5 ms 50 nS 0.1 mS −50 mV 0.5 ms
−60 mV 10 ms 1.5 ms 50 nS 50 S −40 mV 0.5 ms 1 ms 0.06 nS 0.9 nS
−60 mV 5 ms 1.5 ms 50 nS 50 S −40 mV 0.5 ms 3 ms 0.06 nS 1.2 nS
the CR, LP, and BP units, the shape of the postsynaptic current in response to a presynaptic spike is described by an “alpha function”
冦
t t g0 e共− 兲 for t ⬎ 0 k h␣共t兲 = 0 otherwise.
冣
共1兲
A spike arriving at the unit causes an excitatory postsynaptic current if the synaptic conductance g0 ⬎ 0, or an inhibitory postsynaptic current if g0 ⬍ 0. The time constant determines the duration of the postsynaptic current, and k = 0.02 ms represents a normalizing factor. The postsynaptic current I共t兲 is calculated by a convolution of h␣共t兲 and a 共summed兲 presynaptic spike activity pattern in units of volts. The voltage change dVm共t兲 / dt of the leakyintegrator neuron caused by the flow of synaptic current through the membrane is modeled by a parallel resistorcapacitor electrical circuit with a membrane time constant m:
m
dVm共t兲 = − Vm共t兲 + Vk共t兲 + RI共t兲 dt
for t ⬎ 0.
共2兲
Here, m equals RC, with R representing the resistance and C the capacitance of the circuit. Vk共t兲 simulates a dynamically changing potassium conductance, gk, reflecting the unit’s refractoriness, with
k
dgk共t兲 = − gk共t兲 + bs dt
共3兲
and Vk共t兲 = −
gk共t兲 Vm共t兲. G
共4兲
Following each spike of the unit represented by its state variable s, the potassium conductance is increased by a constant amount b and decays with the potassium time constant k. G = 1 / R is the total resting conductance. The unit’s state variable s follows the relation s=
再
0 for V共t兲 艋 ⌰act 1 for V共t兲 ⬎ ⌰act ,
共5兲
with V共t兲 = Vrest + Vm共t兲, where Vrest represents the resting potential of the unit. As long as the cell’s membrane po314
J. Acoust. Soc. Am., Vol. 121, No. 1, January 2007
0.01 nS
tential, V共t兲, is below its spike threshold ⌰act, the unit’s state variable s is set to zero. Besides the relative refractory period of the model units, represented by the spike-induced increase in potassium conductance, the unit also incorporates an absolute refractory period of 1.5 ms, during which no further spikes can be emitted by the unit. The specific parameters of the CR, LP and BP units are summarized in Table I.
3. Entrainment units in the CN
The EN unit of the model CN stage provides the temporal periodicity information which is transformed into a ratebased periodicity representation by the present neural circuit. Thus, the quality of the overall model depends crucially on the reliability and temporal precision of the simulated EN unit responses. The EN unit is simulated using a functional point-neuron model similar to the one suggested by Dicke and Dau 共2005兲. In contrast to the other model units described above, this functional model disregards changes in the potassium conductances following a spike. The model describes ideal onset responses as observed in octopus cells in the ventral cochlear nucleus 共VCN兲. Octopus cells have been found to entrain to the stimulus modulation 共Rhode and Smith, 1986; Rhode, 1994兲, when stimulated with SAM pure tones with modulation frequencies ⬍800 Hz. Due to their precisely timed action potentials these cells have been assumed to be the best temporal encoders of AM stimuli among all major cell types in the cochlear nucleus 共Frisina et al., 1990; Rhode, 1994; Winter and Palmer, 1995兲. In the model, it is assumed that a large number of AN fibers converge on a CN model unit 共Dicke and Dau, 2005兲. Therefore, the deterministic discharge rate function is used as the time-dependent AN input to the EN unit, i.e., no individual spike trains for each AN fiber are computed. In order to account for the wide across-frequency input that octopus cells receive 共Oertel et al., 2000兲, the simulated AN activity is summed across a range of cochlear filters, such that each model unit receives equally weighted input from 11 cochlear filters spanning a frequency range of approximately one octave centered at the unit’s CF. In contrast to the dynamics of the other model units described earlier, the EN unit has a biphasic postsynaptic current instead of the monophasic “alpha function,” Dicke et al.: A neural circuit for periodicity coding
TABLE II. Simulation parameters of the EN model unit. Parameter Vrest m ⌰act a b c ⌰rel
冦
Description
EN
Membrane equilibrium potential Membrance time constant Spike threshold Effective PSC time constant Effective PSC time constant Constant PSC factor Spike blocking release threshold
−60 mV 1 ms −45 mV 0.1 ms 0.2 ms 0.25 −59 mV
关冉 冊
t −t e a − ce k hb共t兲 = 0 otherwise. g0
冉− t 冊兴 b
for t ⬎ 0
冣
共6兲
As described in Dicke and Dau 共2005兲, the biphasic membrane impulse response realizes a high-pass filtering of the synaptic input, i.e., stimulus transients and fast changes are enhanced relative to sustained stimulus portions. With this feature, the EN model unit effectively acts as a change detector on its synaptic input. The model also uses a spikeblocking mechanism 共e.g., Romand, 1978; Dicke and Dau, 2005兲 that prevents the unit from emitting multiple spikes within one period of a periodic stimulus. Following each spike, the EN unit enters a spike-blocked state during which it cannot exhibit further action potentials. This spike-blocked state lasts until its potential falls below a so-called spikeblocking release threshold ⌰rel that releases the cell from spike blocking. Additionally, the EN unit possesses an absolute refractory period of 0.8 ms during which it cannot emit further action potentials. The combination of the biphasic membrane impulse response and the spikeblocking mechanism has been shown to account for the simulation of entrainment to periodic stimuli 共Dicke and Dau, 2005兲. The values of the EN unit parameters are given in Table II.
TABLE III. Parameter variation of the EN model unit. Pairs of the spike threshold, ⌰act, and the spike blocking release threshold, ⌰rel, are given. All other parameters were as in Table II. EN unit 1 2 3 4 5 6 7 8 9 10
⌰act共mV兲
⌰rel共mV兲
−58.5 −57.2 −54.1 −51.0 −48.5 −43.0 −37.0 −31.0 −21.5 −9.5
−63.5 −65.0 −67.5 −69.5 −71.0 −74.2 −76.5 −81.5 −87.0 −93.0
BP units with identical BMFs along the newly introduced “modulation-depth,” or EN, layer. This summed activity is finally normalized in order to obtain the model output henceforth referred to as the relative spike rate of the filters. In principle, the same summation could also be considered for the LP units but is not explicitly addressed here. The introduction of the modulation-depth layer to the model can be viewed as a simplified realization of a population of adaptive EN units that change their parameters in response to the stimulus modulation depth. The rate response of the population would increase monotonically as the modulation depth increases. The simplification of ten EN units with specific choice of parameters reflects a discrete approximation to a neural population. It does not imply that an ordered array of EN units with different thresholds exists. In accordance to the adaptive EN units which provide an increasing population rate response as a function of modulation depth, one would need to assume an increasing number of CR units that are activated with increasing modulation depth of the stimulus.
4. Variation of entrainment unit parameters
With the choice of the EN unit parameters as given in Table II, the units show a step transition from no encoding of modulation depths below 30% to undistinguishly encoding modulation depths above 40%. In order to allow for the encoding of a large dynamic range of modulation depths in the present model, a set of ten different EN units were used that differ in their sensitivity to different modulation depths. This was achieved by varying their spike threshold ⌰act and their spike-blocking release threshold ⌰rel. While the spike threshold ⌰act determines the membrane potential at which the unit is sufficiently depolarized to generate an action potential, the release threshold ⌰rel determines the hyperpolarized potential at which the unit is released from spiked blocking 共see Fig. 1 in Dicke and Dau, 2005兲. The threshold potentials chosen for the ten EN units of the present model are given in Table III. The ten EN units introduce an additional 共hidden兲 layer in the model topology, shown in Fig. 1: The circuit can be considered as being repeated for each of the ten EN units and the final model output is obtained by summing the activity of J. Acoust. Soc. Am., Vol. 121, No. 1, January 2007
5. Constant-rate units in the CN
While the EN unit provides the model with the temporal AM information, the CR units provide the mechanism by which the modulation frequency selectivity of the IC units is shaped. The CR units of the present model are simulated using a point-neuron model as described in Sec. II B 2, adjusted to mimic a sustained chopping response as observed in VCN stellate cells. Each CR model unit receives input from 50 AN fibers, all originating from the same peripheral filter channel. The individual spike train of each AN fiber is obtained by comparing the instantaneous hair-cell discharge probability with a random number equally distributed in the range 关0 . . . 1兴. If the instantaneous spike probability exceeds the random number, a spike is generated and the AN fiber enters a refractory period of 1 ms. In the following, predictions obtained with the model circuit will be presented using pure-tone and amplitude modulated stimuli. Dicke et al.: A neural circuit for periodicity coding
315
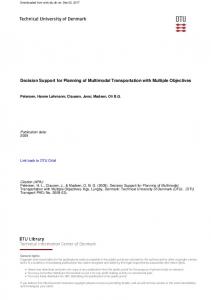
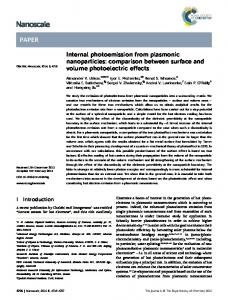
FIG. 3. Left: PSTHs of the different model units in response to a 10 kHz tone burst presented at 60 dB SPL. Right: rMTF and synchronization coefficient 共upper two panels兲 of the different model units 共indicated by the abbreviations in the left panels兲 in response to 100% SAM 10 kHz tones with varying modulation frequencies presented at 60 dB SPL. The upper row shows responses for the EN model unit. The MTFs of the EN unit indicate a nearly perfect entrainment of the unit to the stimulus modulation. The second row shows the CR model unit response. The spike rate of the unit is independent of the modulation frequency of the stimulus. The third row shows the response of the LP model unit receiving input from four CR units. The LP unit reflects the chopping of its input units 共left兲. On the right the rMTF of the LP unit receiving input from eight CR units 共circles兲 and the rMTF of the LP unit receiving input from four CR units 共triangles兲 is shown. The region of suppression occurs at different modulation frequencies in the two units. The bottom row shows the responses of the BP model unit receiving excitatory input from the LP unit with eight CR inputs and inhibitory input from the LP unit with four CR inputs. The unit reveals an onset response 共left兲. However, compared to the EN unit, the BP unit responds with a larger first-spike latency and less temporal precision. The rMTF on the right reveals a BMF of 100 Hz.
III. SIMULATIONS
All simulations were performed within the neural circuit that receives input from the peripheral channel centered at 10 kHz. For the analysis of the different unit types, the neural circuit was tested using sinusoidally amplitude modulated 共SAM兲 10 kHz tones. The degree of synchronization of the model response to a SAM tone was analyzed using the synchronization coefficient 共SC; Goldberg and Brown, 1967兲, computed as the vector strength of the distribution of spikes. A SC value of 1 indicates perfect synchronization to the stimulus modulation, while SC= 0 represents no synchronization at all. Additionally, the rMTF where the spike rate is plotted as a function of the modulation frequency was computed in response to SAM stimuli. SAM stimuli were presented for 1.05 s with the initial 50 ms of a unit’s response being excluded from the analysis in order to avoid onset effects. The response types of the different model units are characterized by their peristimulus time histograms 共PSTHs兲 yielded in response to 100 ms duration, 10 kHz tone bursts presented at 60 dB sound pressure level 共SPL兲. PSTHs were gained from 100 stimulus representations of the highfrequency tone burst and analyzed in 0.5 ms bins. All simulations of the present study were performed using discrete 316
J. Acoust. Soc. Am., Vol. 121, No. 1, January 2007
time signal processing at a sampling rate of 50 kHz. For the analysis of the BP units, the response to complex sounds 共such as two-component AMs, narrowband noise, and iterated rippled noise兲 as well as different modulation depths were considered. If not stated otherwise, the stimuli were presented at a level of 60 dB SPL. A. Response characteristics of the different units
First, the output of the different unit types is shown exemplarily for the EN layer with the parameters given in Table II. The upper right panel of Fig. 3 displays the modulation transfer functions of the EN unit in response to a 100% SAM 10 kHz tone. The spike rate 共triangles, right scale兲 of the EN unit reflects the stimulus modulation rate up to 600 Hz. Above 600 Hz, the EN unit cannot follow the fast fluctuations of the modulated stimulus anymore and exhibits purely an onset response to the stimulus. The figure also shows the synchronization coefficient 共circles, left scale兲 of the EN unit that lies between 0.99 and 1 for modulation frequencies below 600 Hz. The high synchronization coefficient, together with a spike rate that reflects the stimulus modulation rate, indicates a nearly perfect entrainment of the unit to the stimulus modulation. Dicke et al.: A neural circuit for periodicity coding
The upper left panel of Fig. 3 displays the PSTH of the EN model unit. The unit exhibits one spike at stimulus onset that is followed by no further activity during the sustained portion of the stimulus due to the spike-blocking mechanism of the model 共Dicke and Dau, 2005兲. The PSTH of the EN model unit can be associated with a cochlear nucleus ideal onset 共OI兲 unit. These units have been found to respond to pure-tone stimuli 共f ⬎ 2 kHz兲 revealing one sharply timed action potential at stimulus onset followed by little or no 共⬍10 spikes/ s兲 subsequent activity during the sustained portion of the tone 共Godfrey et al., 1975; Rhode and Smith, 1986兲. Thus, in terms of its onset PSTH and its entrainment to SAM stimuli, the response properties of the model EN unit correspond well to the responses observed in PVCN octopus cells. The right panel in the second row of Fig. 3 shows the modulation transfer functions of a model CR unit in response to a 100% SAM 10-kHz tone. Despite small fluctuations in the spike rate 共triangles, right scale兲, resulting from stochastical fluctuations in the simulated AN activity, the rMTF reveals that the spike rate of the CR neuron 共85– 95 Hz兲 does not depend on the modulation frequency of the stimulus. The figure also shows the corresponding synchronization coefficient 共circles, left scale兲. According to its tMTF, the CR unit synchronizes best to a modulation frequency close to 100 Hz, while its synchronization to most other modulation frequencies is poor. The increased synchronization at a modulation frequency of about 100 Hz can be explained from the chopping property of the unit that leads to maximum synchronization when stimulus frequency and intrinsic chopping frequency correspond to each other, while synchronization is strongly decreased if the frequencies do not match. The corresponding left panel displays the simulated pure-tone PSTH of the CR model unit. It shows that the unit responds with a preferred interspike interval of approximately 10 ms 共reflecting the inverse of the chopping rate兲, which is not related to the periodicity of the 10-kHz tone. The CR unit thus displays a so-called sustained chopping response. The simulated PSTH can be associated with stellate cells in the VCN that have been found to reveal a chopping response when stimulated by a pure tone with an individual chopping frequency that is not related to the stimulus frequency 共Rhode et al., 1983; Smith and Rhode, 1989兲. Moreover, recorded rMTFs of stellate cells have been found to be flat, while their tMTFs are low-pass shaped at low stimulus levels and become increasingly more bandpass-like as the stimulus level increases 共Frisina et al., 1990; Kim et al., 1990; Rhode, 1994兲. Thus, the output of the CR model unit appears to correspond to VCN stellate cell responses in terms of its pure-tone PSTH and its MTFs. Each LP unit of the model IC stage receives excitatory synaptic input from a different number of CR model units and inhibitory synaptic input from the EN model unit 共see Fig. 1兲. Apart from the different number of CR unit inputs, all LP units of the present model are identical. The right panel in the third row of Fig. 3 shows the rMTFs of a model LP unit that receives 8 CR inputs 共circles兲 in response to 100% SAM 10-kHz tones. This rMTF reveals that the activJ. Acoust. Soc. Am., Vol. 121, No. 1, January 2007
ity of the LP unit is suppressed at modulation frequencies ⬎200 Hz. This is due to the inhibition provided by the EN model unit that increases with increasing modulation frequency 共Fig. 3兲 until it exceeds the excitatory input from the CR units. At modulation frequencies exceeding 800 Hz, where the EN unit exhibits a purely onset response, the activity of the LP unit is no longer suppressed, and it responds with a spike rate that reflects its CR inputs. The rMTF of the model LP unit receiving input from only four CR units 共triangles兲 is also shown for comparison. The activity of this LP unit already becomes suppressed at modulation frequencies between 70 and 100 Hz, due to the smaller number of CR units providing input to this unit. The corresponding left panel displays the pure-tone PSTH of the LP unit receiving four CR inputs as an example. The LP model unit reveals a sustained PSTH that reflects the chopping found in its CR input, while the EN unit only provides input at the tone onset due to its ideal onset response to high-frequency tones. Electrophysiological recordings from IC neurons using 100% SAM tones have revealed IC rMTFs that partly resemble the simulated LP rMTFs in their distinct shape 共Krishna and Semple, 2000兲. Krishna and Semple 共2000兲 investigated the modulation depth dependency of such IC rMTFs and defined the “region of suppression” as a range of modulation frequencies where the spike rate of a neuron is decreased. IC neurons that show a region of suppression in their rMTFs were found to exhibit sustained pure-tone PSTHs 共Krishna and Semple, 2000兲. The simulations of the pure-tone responses resulting from the model LP unit are consistent with their finding. Each BP unit of the model IC stage receives weak excitatory synaptic input from one model LP unit and strong inhibitory input from an adjacent model LP unit 共see Fig. 1兲. Compared to the LP unit that provides the excitatory BP input, the LP unit providing the inhibitory BP input receives a smaller number of CR inputs. The bottom right panel of Fig. 3 displays the rMTFs of the model BP unit that receives input from the two LP units shown before, in response to a 100% SAM 10-kHz tone. Weak excitatory input is provided by the LP unit receiving input from eight CR units 共third row, circles兲, while strong inhibitory input is provided by the LP unit receiving input from four CR units 共third row, triangles兲. While the inhibitory LP unit suppresses the activity of the BP unit at low modulation frequencies, it provides no inhibitory contribution at modulation frequencies 艌100 Hz. However, the contribution of the excitatory LP unit is not suppressed until the modulation frequency reaches 200 Hz, resulting in a bandpass shaped rMTF of the BP unit. At modulation frequencies ⬎800 Hz, where both LP units are exclusively driven by the CR input, the contribution of the inhibitory LP unit compensates for the excitatory LP unit input such that the BP unit reveals no response. The bottom left panel of Fig. 3 shows the pure-tone PSTH of the model BP unit. In contrast to the sustained PSTH found in the model LP units 共third row, left panel兲, the model BP unit reveals an onset PSTH. This agrees with data recorded by Krishna and Semple 共2000兲 who found that IC neurons that reveal bandpass shaped rMTFs often possess an onset PSTH. Dicke et al.: A neural circuit for periodicity coding
317
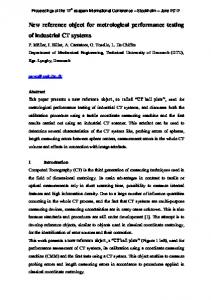
FIG. 4. Left: Simulated rMTFs of the five model BP units in response to 100% SAM 10-kHz tones with varying modulation frequencies. Each rMTF is normalized by its BMF spike rate 共given above the rMTFs兲 that corresponds to the spike rate at the peak of the unit’s rMTF. The BMF rate used to gain the relative spike rate from the summed activity of all ten model BP units with identical BMFs is shown above each filter. Right: Recorded IC rMTFs in response to 100% SAM tones with carrier frequencies that correspond to the individual CF of the recorded unit. Stimuli were presented 30– 60 dB above the individual response threshold of a unit. Each rMTF is normalized by its BMF spike rate that is given above each rMTF. Replot with permission from Langner and Schreiner 共1988兲.
B. Characteristics of modulation bandpass filters
In order to obtain bandpass shaped rMTFs with BMFs that cover a range of modulation frequencies, 2n = 32 CR units 共n = 5兲 were simulated within the same peripheral filter 共CF= 10 kHz兲. The 2n CR units project onto n + 1 different LP units, each of which receives input from a different number of CR units, ranging from 20 to 2n. In this way, n model BP units can be obtained that reveal bandpass shaped rMTFs with n different BMFs. The BP units analyzed in the following are the result of summation across the EN layer described in Sec. II B 4. The left panel of Fig. 4 displays the simulated bandpass rMTFs of the five BP units in response to 100% SAM 10 kHz tones. Each rMTF is normalized by its individual maximum response rate 共i.e., its BMF spike rate兲. The value of the corresponding BMF spike rate is shown above each rMTF. The right panel of Fig. 4 displays data obtained in IC recordings replotted from Langner and Schreiner 共1988兲. The recorded data were obtained from 100% SAM tones with carrier frequencies that corresponded to the individual CF of the recorded unit, presented between 30 and 60 dB above the unit’s individual response threshold. The quality factor of a bandpass rMTF can be expressed as the BMF divided by the bandwidth of the rMTF 6 dB below its peak 共Q6 dB兲. The average Q6 dB value of 0.8± 0.3 reported by Langner and Schreiner 共1988兲 differs from the simulated average Q6 dB values given in Table IV. However, the simulated Q6 dB values are in the range of the Q6 dB values derived from psychophysical modulation masking experiments 共Dau et al., 1997a, b; Ewert and Dau, 2000兲. Due to a lack of recorded data, no average Q3 dB value 共BMF divided by the bandwidth of the rMTF 3 dB below its peak兲 can be given for the recorded bandpass MTFs. However, TABLE IV. Q6 BMF 共Hz兲 20 50 100 200 350
318
dB
values of the model filters. Q6
dB
0.6 2.0 1.4 1.4 1.4
J. Acoust. Soc. Am., Vol. 121, No. 1, January 2007
simulated and recorded Q3 dB values can be compared using the rMTF with a BMF of 100 Hz as an example. The Q3 dB value of about 1.8 of the recorded 100 Hz bandpass lies in the region of the Q3 dB value of 2.4 of the simulated 100 Hz bandpass.
C. Encoding of modulation depth and stimulus level
The upper left panel of Fig. 5 displays the relative spike rates of the four 100-Hz BP units that receive input from the EN model units corresponding to the threshold combinations 1, 2, 5, and 10 共see Table III兲 as a function of AM modulation depth. The relative spike rates are obtained from a 10 kHz tone modulated at a rate of 100 Hz with different modulation depths. Each of the BP units is shown to encode only a limited dynamic range of modulation depths. Within the corresponding 100 Hz filter of the model, the large dynamic range of modulation depths results from the summed activity of all ten BP units. The upper right panel of Fig. 5 displays the relative spike rate of the 100 Hz filter as a function of the modulation depth of a 10 kHz tone, modulated at a rate of 100 Hz. The relative spike rate is essentially a linear function of the stimulus modulation depth. The lower left panel of Fig. 5 displays the 100 Hz filter transfer function for a 10 kHz tone amplitude modulated with depths of 20% 共circles兲, 50% 共triangles兲, and 100% 共squares兲. The simulated filter functions reveal that neither the BMF nor the overall bandpass shape of the 100 Hz filter are affected by the modulation depth of the stimulus. Estimated Q6 dB values are 1.4 for 100%, 1.6 for 50%, and 1.7 for 20% modulation depth. The lower right panel of Fig. 5 displays the simulated relative spike rate of the 100 Hz filter as a function of the modulation frequency of a 100% amplitude modulated 10 kHz tone, presented at different stimulus levels. Increasing the stimulus level from 40 to 80 dB yields only small changes in the relative spike rate of the 100 Hz filter indicating that the simulated bandpass filters are independent of stimulus presentation level in the tested range. This differs from most of the recorded responses that depend on the stimulation level, as will be further discussed in Sec. IV B. Dicke et al.: A neural circuit for periodicity coding
FIG. 5. Upper left panel: Responses of the 100 Hz BP units receiving indirect input from the four EN units with the threshold combinations 1, 2, 5, and 10 共see Table III兲 as a function of the modulation depth of a 10 kHz tone modulated at a rate of 100 Hz 共stimulus presentation level: 60 dB SPL兲. The simulated spike rate of each BP unit is divided by the BMF rate of the 100 Hz filter. Upper right panel: The relative spike rate of the 100 Hz filter as a function of the modulation depth of the same AM stimulus. Lower left panel: The relative spike rate of the 100 Hz filter in response to amplitude modulated 10 kHz tones with different modulation frequencies and modulation depths 共20%, 50%, and 100%兲. Lower right panel: The relative spike rate of the 100 Hz filter as a function of the modulation frequency of a 100% amplitude modulated 10 kHz tone presented at 40, 60, and 80 dB SPL.
D. Processing of complex envelope waveforms
In the following, it is evaluated to what extent the five modulation filters simulated by the present neural model act like a bank of 共linear兲 filters when applied to complex envelope waveforms that consist of more than a single modulation frequency. Considering the highly nonlinear neural circuit that gives rise to the formation of the bandpass rMTF shape, it cannot be assumed in advance that the model BP units exhibit the frequency resolving properties of a linear bandpass filter when presented with a mixture of amplitude modulation frequencies. However, such a property is commonly associated with modulation filters or the concept of a modulation filter bank. In order to evaluate to which extent the five modulation filters simulated in the present model can be associated with linear amplitude modulation filters, the simulated relative spike rates obtained in response to complex stimuli were compared to the calculated integrated envelope power at the output of each model filter. This approach is based on the psychophysically motivated envelope-power spectrum model 共EPSM, Dau et al., 1999; Ewert and Dau, 2000兲, which is conceptually similar to the classical power-spectrum model of masking 共e.g., Fletcher, 1940; Zwicker et al., 1957兲 where the signal power at the output of an auditory filter centered at the signal frequency is used to estimate its detectability. In the present study, the amount of the integrated envelope power at the output of a linear filter is calculated 共and indicated as “EPSM”兲 and compared to the simulations 共indicated as “Sim”兲 obtained with the suggested nonlinear neural circuit.1 Deviations between the simulations and the EPSM predictions indicate nonlinear effects in the neural circuit.
1. Processing of two-component AM
The amplitude modulated stimuli s共t兲 used in the simulations consist of a pure-tone carrier with frequency f c = 10 kHz that is modulated by the sum of two sinusoids, f m1 , f m2, with modulation depths m1 = m2 = 0.5: J. Acoust. Soc. Am., Vol. 121, No. 1, January 2007
s共t兲 = sin共2 f ct兲关1 + m1sin共2 f m1t兲 + m2sin共2 f m2t兲兴. Figure 6 displays the temporal envelopes of two complex AM stimuli with f m1 = 55 Hz and f m2 = 200 Hz 共upper left panel兲 and f m1 = 18 Hz and f m2 = 200 Hz 共upper right panel兲. The corresponding envelope spectra, shown in the respective middle panels of the figure, both reveal three spectral components, the dc component 共peak at 0 Hz兲 and two components that correspond to the two imposed modulation frequencies. The amplitudes of the spectral components are given in dB with respect to the dc peak which was chosen to correspond to 0 dB. The two lower panels of Fig. 6 display the simulated neural activity of the five model filters 共circles兲 in response to the AM stimuli. The output of the EPSM is also shown, represented by the crosses. The simulation results from the neural model largely agree with the EPSM results. Only the result for the 20 Hz filter in response to the AM stimulus with f m1 = 55 Hz and f m2 = 200 Hz 共lower left panel兲 clearly deviates from the EPSM output which will be further addressed in the discussion. 2. Processing of narrowband noise
Narrowband Gaussian noise and low-noise noise of the same bandwidth were used to further characterize the present model. The narrowband Gaussian noise was generated by setting the magnitude of the Fourier components of a broadband Gaussian noise to zero outside the desired passband of 100 Hz. The noise band was centered at 10 kHz. The lownoise noise was generated from a 100-Hz-wide Gaussian noise, centered at 10 kHz, by ten iterations of the following steps: The temporal waveform of the noise was divided by its temporal envelope on a sample-by-sample basis, and the Fourier spectrum of the resulting waveform was restricted to its original bandwidth of 100 Hz. The resulting waveform exhibits a smooth temporal envelope. A more detailed description of this procedure can be found in Kohlrausch et al. 共1997兲. The upper row of Fig. 7 displays the temporal envelope of the narrowband Gaussian noise 共left兲 and the correDicke et al.: A neural circuit for periodicity coding
319
FIG. 6. The upper row shows the temporal waveform of the envelope of a 10 kHz tone modulated by the sum of two sinusoids with modulation frequencies f m1 = 55 Hz and f m2 = 200 Hz 共left兲 and f m1 = 18 Hz and f m2 = 200 Hz 共right兲. The middle row shows the corresponding envelope spectra of the two-component AM stimuli normalized such that the dc peak corresponds to 0 dB. In the bottom row the simulated relative spike rates of the five model filters 共circles兲 and EPSM output 共crosses兲 in response to the stimuli at a presentation level of 60 dB SPL.
sponding low-noise noise 共right兲. The middle row shows the respective envelope spectra, normalized to a dc peak of 0 dB. Except for the dc peak, the Gaussian noise 共left兲 exhibits a triangular continuous envelope spectrum, if plotted on a linear scale, which decreases rapidly for spectral components exceeding the bandwidth of the noise. Despite the identical bandwidths, the envelope spectrum of low-noise noise 共right兲 exhibits a completely different shape. The envelope spectrum of low-noise noise contains much less energy than the envelope spectrum of Gaussian noise 共see also Dau et al., 1999兲. The bottom row of Fig. 7 shows the simulated neural activity of the five model filters 共circles兲 in response to the Gaussian noise 共left兲 and low-noise noise 共right兲 together with the EPSM results 共crosses兲. In both cases, the simulated activity of the neural model is similar to the output obtained with the EPSM. While the activity at the output of filters with BMFs below the stimulus bandwidth reflects the triangular shape of the envelope spectrum of the Gaussian noise, filters with BMFs that exceed the bandwidth of the stimulus reveal essentially no activity 共lower left panel兲. As expected from comparing the overall amount of energy in the envelope spectra of narrowband Gaussian noise and low-noise noise, in case of the low-noise noise 共right bottom panel兲, the activity of filters with BMFs below the bandwidth of the low-noise noise is generally smaller than those obtained in 320
J. Acoust. Soc. Am., Vol. 121, No. 1, January 2007
response to Gaussian noise of the same bandwidth 共compare to lower left panel兲. Filters with BMFs that exceed the bandwidth of the low-noise noise reveal no response, as is also expected from the envelope spectrum of the stimulus.
3. Processing of iterated rippled noise
The iterated rippled noise 共IRN兲 stimulus was generated from a broadband Gaussian noise. The noise was iteratively attenuated and delayed before being added to the original version of the noise. During the iteration process that results in a quasi-periodicity of the stimulus, the output of one iteration stage served as input to the next iteration stage. The process used here followed the “add same” configuration described in Yost 共1996兲. The IRN stimulus was obtained from N = 16 iterations using a delay ⌬ = 20 ms and a gain g = 1. While the narrowband stimuli used in the previous sections were not affected by the peripheral filter transfer function at 10 kHz, the broadband IRN stimulus had to be filtered before computing the EPSM output. The temporal envelope of the filtered IRN stimulus is shown in the upper panel of Fig. 8 and the corresponding envelope spectrum is shown in the middle panel. The amplitudes of the spectral envelope components are given in dB with the dc peak corresponding to 0 dB. The magnitude spectrum 共not shown兲 as well as the Dicke et al.: A neural circuit for periodicity coding
FIG. 7. The upper row shows the temporal envelope of a narrowband Gaussian noise 共left兲 and a low-noise noise 共right兲 centered at 10 kHz with a bandwidth of 100 Hz. The middle row shows the corresponding envelope spectra normalized to a dc peak of 0 dB. In the bottom row, simulated relative spike rates of the five model filters 共circles兲 in response to the respective stimuli presented at a level of 60 dB SPL are shown. The corresponding EPSM output is represented by the crosses.
envelope spectrum of the IRN reveal a rippled structure with peaks at integer multiples of 50 Hz, the reciprocal of the IRN delay ⌬ = 20 ms. The bottom panel of Fig. 8 displays the simulated relative spike rates of the five model filters 共circles兲 in response to the IRN stimulus presented at 60 dB SPL. Additionally, the EPSM results are represented by crosses. Although they are in qualitative agreement, the model output activity and the EPSM results differ from one another. For example, the EPSM output for the 20 Hz filter is clearly larger than the simulated spike rate obtained for this filter. The opposite is observed for the 350 Hz filter, where the simulated spike rate exceeds the EPSM output. Possible reasons for this difference between the two models will be addressed below. IV. DISCUSSION A. Biological plausibility of the present model
The pure-tone PSTH and the rMTF of each model unit have been compared to data from electrophysiological recordings, such that each unit could be associated with a physiological response type. The simulated responses of the model EN unit, for example, correspond to responses found in PVCN octopus cells. These cells were found to project to the superior paraolivary nucleus 共SPN兲 and the ventral nucleus of the lateral lemniscus 共VNLL兲. The influence of J. Acoust. Soc. Am., Vol. 121, No. 1, January 2007
octopus cells on the IC is indirect and inhibitory as neurons in the SPN are GABAergic 共Kulesza and Berrebi, 1999兲, and neurons in the VNLL that are innervated by octopus cells are glycinergic 共Saint Marie et al., 1997兲. An explicit simulation of VNLL cells was not included in the model. It was assumed here that VNLL units show similar response properties as the EN units of the present model. Generally, a large diversity of temporal response types has been observed in the VNLL including a reasonable percentage of onset responses 共e.g., Batra and Fitzpatrick, 1999兲. Recently, Zhang and Kelly 共2006兲 have shown in the rat that VNLL units with onset responses and high precision in timing exist. It has been suggested that the neurons in the VNLL are particularly well suited for preserving and processing temporal information in the auditory system 共Oertel and Wickesberg, 2002兲. The inhibitory influence of octopus cells on IC neurons therefore seems to agree with the neural connectivity assumed in the present model. Moreover, the ability of octopus cells to entrain to periodic stimuli 共Rhode and Smith, 1986; Rhode, 1994; Oertel et al., 2000兲 has led to the assumption that these cells might play an important role in the processing of amplitude modulation and pitch information 共Frisina et al., 1990; Golding et al., 1995; Evans and Zhao, 1997; Cai et al., 2001兲. The present study specifically assumes that the unit that generates OI responses in the neural circuit is very Dicke et al.: A neural circuit for periodicity coding
321
ditory midbrain appears to be extensively interconnected 共Oliver and Huerta, 1991兲 does at least not seem to argue against the choice of lateral connections in the present model. The EN units were derived in such a way that they systematically differ in their two threshold potentials, namely the spike and release thresholds. The specific choice of the EN threshold potentials 共see Table III兲 results in a linear relation between the simulated spike rate of a modulation filter and the modulation depth of a SAM stimulus 共see upper right panel of Fig. 5兲. The required differences in the sensitivity of different EN model units to fluctuations in the stimulus envelope might also be obtained by a number of alternative implementations. This could be done, for example, by exclusively varying the spike thresholds of the different EN units, or by exclusively varying their release thresholds or their membrane time constants. Thus, although the way in which the different EN units of the present model are implemented is somewhat arbitrary, the general mechanism assumed here to account for the processing of different modulation depths in SAM stimuli and complex envelope waveforms is not affected by the implementation details of the EN units.
B. Rate normalization of BP units and level dependency
FIG. 8. The upper panel shows the temporal envelope of the IRN stimulus with ⌬ = 20 ms, g = 1 and N = 16. The middle panel shows the corresponding envelope spectrum normalized to a dc peak of 0 dB. In the bottom panel, the simulated relative spike rate of the five model filters 共circles兲 in response to the IRN stimulus presented at a level of 60 dB SPL is shown. The corresponding EPSM output is represented by the crosses.
critical for the formation of bandpass shaped rMTFs, and for the processing of complex periodic waveforms. The CR units of the model circuit can be associated with VCN stellate cells. These units have been found to project to the IC via synaptic terminals that are indicative of an excitatory neural connection 共Smith and Rhode, 1989兲. The excitatory projections of stellate cells onto IC neurons agree with the assumed model connectivity. Compared to the CN, little is known about cell types and neural connectivity in the IC. However, Krishna and Semple 共2000兲 reported that IC neurons having rMTFs with a region of suppression exhibit a sustained pure-tone PSTH. In contrast, IC neurons that reveal a bandpass shaped rMTF show an onset-type pure-tone PSTH. These findings can be simulated qualitatively by the IC model units. Although it is not known what causes the region of suppression observed in recorded IC rMTFs, the connectivity of the present model might provide a possible mechanism by which the regions of suppression could be shaped. Little is known about lateral connections between neurons in the IC. It is unclear whether the ordered lateral inhibition among neighboring cells, as assumed in the circuit, is biologically plausible or not. However, the fact that the au322
J. Acoust. Soc. Am., Vol. 121, No. 1, January 2007
The current model topology directly results in a maximum discharge rate of the BP rMTFs proportional to the BMF of the unit 共left panel of Fig. 4兲. This is not observed in the physiology as seen in the right panel of Fig. 4 which shows data replotted from Langner and Schreiner 共1988兲. A constant maximum discharge rate would be achieved if an increasing number of parallel circuits inversely proportional to the BMF of the respective units was assumed. This solution is comparable to the decreasing number of chopper units as input to the coincidence cells with increasing BMF in the model of Hewitt and Meddis 共1994兲. A higher number of parallel circuits at low BMFs would also increase the fidelity of the coding of these modulation frequencies, an aspect that seems particularly important with respect to the role of low amplitude modulations in speech perception. Another property of the current model is that the rMTFs of the BP units are essentially level independent between 40 and 80 dB 共lower right panel of Fig. 5兲. The main reason for this behavior is the “cycle count” property of the model EN units that was designed to be level independent over a large range. While psychophysics suggests level independency of AM coding over large level ranges, this appears to be inconsistent with results from physiological studies in detail. However, a diversity of level dependent response functions have been found in the IC. For example, Krishna and Semple 共2000兲 showed responses with either enhancement or with suppression which all showed different amounts of level dependency. The model of Hewitt and Meddis 共1994兲 shows a decrease of the rMTF at BMF with level at levels 20– 30 dB above threshold which is caused by the decreasing synchronization of the chopper response to the positive half cycle of Dicke et al.: A neural circuit for periodicity coding
the modulation. Also the Nelson and Carney 共2004兲 model shows some level dependence, with increasing rate up to 30 dB and decreasing rates at 50 and 70 dB. C. Possible alternative mechanisms
Some of the features of the present model framework might also be realized by alternative units or mechanisms. Especially, the mechanism by which different BMFs are shaped could be realized in several ways within the model framework, as long as two main features are taken into account: First, the spike rates of the CR model units need to be independent of the stimulus modulation frequency, i.e., the CR model units need to produce flat rMTFs. The CR units of the present model exhibit chopper pure-tone PSTHs and thus can be associated with VCN stellate cells. However, as 90% of the CN neurons are found to display flat or low-pass rMTFs in response to AM signals 共Backoff et al., 1999兲, the constant-rate responses of the CR units could be represented by a number of different CN cell types. Second, the mechanism by which the different BMFs of the model BP units are shaped, namely the variation in the number of CR inputs, can be exchanged by other mechanisms that result in varying input rates for different LP units. Such different input rates can, for example, be gained by varying the spike rates among the CR units. Differences in the effectiveness of synapses connecting CR units and LP units are another possible mechanism by which different BMFs could be yielded. Finally, a combination of these three possible mechanisms, i.e., a different number of input units, a variation of spike rates, and different synaptic effectiveness could also produce the formation of different BMFs. It cannot be decided here which CN neuron type might represent the model CR units and which of the suggested mechanisms actually might be realized. However, the suggested mechanism describing the formation of bandpass shaped rMTFs with different BMFs provides a basic mechanism that can be realized in several ways. D. Nonlinearities in the present model
In order to evaluate the present neural model, simulation results obtained in response to complex stimulus conditions were compared to results of a linear modulation filter bank analysis. In contrast to linear processing of AM information, the simulated spike rates of the biologically motivated model were obtained from a highly nonlinear mechanism, inherently resulting from the nonlinear responses of auditory neurons. The linear modulation filterbank analysis, based on the concept of the envelope-power spectrum model 共EPSM兲, demonstrated that the neural mechanism suggested here actually performs a spectral decomposition of the complex envelope of the stimuli. To our knowledge, no other neural periodicity model has so far been tested with complex envelope waveforms. However, in some cases, the simulated relative spike rate was found to clearly differ from the EPSM output. Possible explanations for these differences are described in the following. The stochastic fluctuations in the AN activity that serves as input to the units of the model CN stage lead to J. Acoust. Soc. Am., Vol. 121, No. 1, January 2007
FIG. 9. Membrane potential of the EN model units in response to a 100% amplitude modulated 10 kHz tone modulated at 18 and 200 Hz. The dotted lines indicate the spike threshold 共⌰act = −58.5 mV兲 and the release threshold 共Qrel = −63.5 mV兲 of EN unit 1. The dashed lines indicate the spike threshold 共⌰act = −9.5 mV兲 and the release threshold 共⌰rel = −93 mV兲 of EN unit 10.
small deviations of the simulated spike rates and the deterministic EPSM predictions. In addition, small deviations might arise from the way the EN unit threshold potentials are varied: 共i兲 While an EN unit with a low spike threshold exhibits an action potential after only a short integration time, the generation of action potentials in EN units with high spike thresholds requires a longer integration time, and 共ii兲 model EN units with high spike thresholds cannot detect the slowly rising slopes of stimuli modulated at a low frequency. Thus, BP units that receive input from EN units with high spike thresholds do not exhibit the 20 Hz bandpass filter in their rMTFs. Both the increased delay in the EN unit activity and the reduced number of model subcircuits that take part in encoding low modulation frequencies might result in differences between the simulated spike rates and the results from the EPSM in filters with low BMFs. However, this problem could be avoided if the EN units were chosen to have the same low spike threshold and differed only in their release threshold. While the abovementioned EN unit only partly contributes to the deviations between simulated spike rates and the EPSM output, the main reason for the deviations arises from the model mechanism itself, by which temporal periodicity information is mapped onto different BP model units. The temporal periodicity information that is most crucial for the present model is provided by the temporal activity patterns of the EN model units. As has been described before, the membrane potentials of the EN model units integrate over a high-pass filtered version of the temporal stimulus waveform until the unit reaches its spike threshold and exhibits a spike. After a spike, the unit enters its spike-blocking mechanism and is prevented from emitting further spikes until it is released by its membrane potential falling below its release potential. Thus, while the EN model units differ in their spike and their release thresholds, their membrane potentials are identical. Figure 9 displays the membrane potential common to all EN model units in response to the two-component AM stimulus with modulation frequencies of f m1 = 18 Hz and f m2 = 200 Hz. The dotted horizontal lines indicate the spike threshold 共⌰act = −58.5 mV兲 and the release threshold 共⌰rel = −63.5 mV兲 of the EN unit with the smallest threshold potential difference, i.e., EN unit 1 in Table III. The dashed horizontal lines indicate the spike threshold Dicke et al.: A neural circuit for periodicity coding
323
共⌰act = −9.5 mV兲 and the release threshold 共⌰rel = −93 mV兲 of the EN unit with the largest threshold potential difference, i.e., EN unit 10 in Table III. While EN unit 1 共dotted lines兲 entrains to the fast modulation frequency of 200 Hz, EN unit 10 共dashed lines兲 entrains to the slow modulation frequency of 18 Hz. However, other EN units whose threshold potentials lie between the threshold potentials of EN unit 1 and EN unit 10 might respond with ISIs that do not correspond to one of the stimulus modulation frequencies. These units extract “erratic” periodicities that are not contained in the stimulus envelope waveform itself. The effects of this error are most prominent when two modulation frequencies are applied 共e.g, 55 and 200 Hz; lower right panel Fig. 6兲 where erratic periodicities corresponding to frequencies between the two imposed modulation frequencies occur. In the case of IRN, which has a broadband envelope spectrum with a large extent of short periods 共high frequencies兲, errors also occur increasingly at high frequencies 共see Fig. 8兲. It is difficult to decide whether these erratic periodicities represent a structural problem of the present model or whether they simply result from the way the EN model units are implemented. However, the recorded synchronization coefficient of an OI unit in response to 200% amplitude modulated pure tones with varying modulation frequencies, as shown in the left panel of Fig. 7 in Dicke and Dau 共2005兲, indicates that the latter might be the case. The recorded synchronization coefficient of the OI unit is close to 1 for all stimulus modulation frequencies. Although the simulated synchronization coefficient of the EN model unit, displayed in the right panel of the same figure, agrees with the recorded synchronization coefficient for high modulation frequencies, it deviates from the recorded data at low modulation frequencies 共e.g., 50 Hz兲 where the EN model unit also detects the small lobes of the 200% AM stimulus. Thus, the question arises, how OI units can selectively follow low modulation frequencies without detecting the small lobes of a 200% AM stimulus while still being sensitive to large stimulus modulation frequencies. If the different EN model units would be assumed to employ more complex, for example, adaptive mechanisms, they might also reveal such a selectivity to the modulation frequency of a 200% AM stimulus within the range of their overall sensitivity 共which is determined by their threshold potential difference兲. If the EN model units would be modeled such that they reproduced these findings, erratic periodicities that are not contained in the stimulus waveform itself could possibly be reduced or even avoided. E. Implications of the present model
The different BMFs obtained in the BP units of the present model result from varying the input spike rate of the different LP model units. Thus, the formation of different BMFs is yielded by a rate-based mechanism and not by varying a temporal model parameter. This is in contrast to other existing models describing the formation of bandpass shaped rMTFs in the IC based on varying temporal parameters among the model units in order to yield a representation of different BMFs at different IC neurons 共Langner, 1981; Langner and Schreiner, 1988; Langner, 1997a, b; Hewitt and 324
J. Acoust. Soc. Am., Vol. 121, No. 1, January 2007
Meddis, 1994; Nelson and Carney, 2004兲. In order to test the biological plausibility of these models, electrophysiological recordings have to reveal whether the range of temporal parameters needed to cover the wide range of modulation frequencies in these models really exists in biological neurons. The present neural circuit describes a fundamentally different mechanism, based on the connectivity of biologically plausible units. In order to further evaluate the present neural model, the simulated spike rates obtained in response to complex envelope waveforms should be compared to real responses recorded from IC neurons. Since such data are currently not available, it is not clear how IC neurons with bandpass rMTFs respond to complex stimuli such as those used in the present study. Thus, the stimulus driven responses or the nonlinear effects 共erratic periodicities兲 observed in the BP units of the present model could possibly also be observed in recorded responses from auditory neurons. Since the present model depends crucially on the temporal information it receives from the EN model units, it would be interesting to know whether the differences in modulation depth sensitivity suggested in the EN model units could be verified in electrophysiological recordings from onset units in the CN. Moreover, it would be valuable to investigate whether different CN onset units respond differently to complex stimuli such as those used in the present study. V. SUMMARY
A neural circuit was presented that transforms temporal AM information, as a code of stimulus periodicity at the level of the CN, into a rate-based representation of stimulus periodicity at the level of the IC. Such a rate-based code of stimulus periodicity is assumed to be represented by bandpass shaped rMTFs with different rate BMFs. At the model CN stage, two types of units were simulated: 共i兲 a unit that entrains to the stimulus modulation frequency and thus provides the temporal periodicity information, and 共ii兲 a number of units whose response rates are independent of the stimulus modulation depth and rate. All further response properties, including the bandpass shaped rMTFs at the model IC stage, result from these two CN model units and the model’s connectivity. Most of the response properties of each model unit as well as the synaptic connections used in the present model were found to agree with experimental findings. Moreover, the region of suppression observed in recorded IC rMTFs can be explained by the present model, at least qualitatively. Alternative models, describing the formation of bandpass shaped rMTFs between CN and IC, employ systematically varying temporal model parameters in order to cover a large range of BMFs. In contrast, the present model simply varies the number of input units projecting onto different IC model units in order to obtain different BMFs. The present model may provide a biologically plausible and simple mechanism that allows the simulation of the recorded bandpass rMTFs observed in IC recordings. Additionally, the present model allows for encoding a large range of modulation depths and accounts for a spectral decomposition of complex envelope waveforms, e.g., pure tones modulated by the sum of two Dicke et al.: A neural circuit for periodicity coding
sinusoids, narrowband Gaussian and low-noise noise, and iterated rippled noise 共IRN兲. Simulation results in response to these complex envelope waveforms were compared to results according to a linear modulation filter bank analysis. The comparison revealed that the simulated spike rates obtained in different modulation filters of the present nonlinear neural model are broadly consistent with a linear limitedresolution frequency decomposition of the stimulus envelope. The nonlinear neural circuit suggested in the present study might represent a possible neural correlate of a modulation filter bank. The circuit might therefore provide a reasonable network for the processing and encoding of periodicity information in complex stimuli. ACKNOWLEDGMENTS
We would like to thank our colleagues in the research groups “Medizinische Physik” at Oldenburg University and the “Centre for Applied Hearing Research” at the Technical University of Denmark for their input. We also thank Paul Nelson and two anonymous reviewers for very helpful and constructive remarks and suggestions. This work was supported by the Deutsche Forschungsgemeinschaft 共Research Project Nos. GRK 591 and SPP 1046兲 and the Danish Research Council. 1
The transfer functions of the modulation filters were obtained from a linear interpolation of the simulated filter data 共see left panel of Fig. 4兲. At low modulation frequencies 共⬍10 Hz兲, this interpolation was computed from the simulated relative spike rate in response to a 60 dB SPL 10 kHz tone. The EPSM results were obtained from extracting the envelope of the stimulus, computing the envelope power spectrum, and calculating the power of the spectral envelope components in the transfer range of each interpolated modulation filter. The envelope power spectrum, N, was computed from the Fourier transform of the Hilbert envelope of the temporal stimulus waveform. The envelope power spectra of all stimuli were scaled such that their dc peaks were identical. The envelope power, Penv 共BMF兲, at the output of a specific modulation filter centered at BMF was calculated by multiplying the envelope power spectrum of the stimulus, N, with the squared transfer function of the filter WBMF共f env兲 and integrating across envelope frequencies f env: Penv共BMF兲 =
冕
⬁
N共f env兲WBMF共f env兲df env .
f env=0
The squared transfer functions WBMF all model filters were assumed to be zero for f env ⬎ 1000 Hz. As has been shown in Fig. 5, the simulated relative spike rate of a filter in the neural model is essentially a linear function of the modulation depth of an AM pure tone. In order to account for this linear behavior, the square root of the integrated power Penv共BMF兲 at the output of each filter, which corresponds to the rms modulation depth for SAM tones, was compared to the simulated relative spike rates. All EPSM results were scaled by the same constant factor in order to make the two measures directly comparable. This constant was obtained by dividing the sum of simulated relative spike rates of all model filters in all simulations by the corresponding sum of all EPSM results. With the described processing, the EPSM results would perfectly match the predictions of neural circuit in the case of 100% SAM tone stimuli. Arle, J. E., and Kim, D. O. 共1991兲. “Neural modeling of intrinsic and spikedischarge properties of cochlear nucleus neurons,” Biol. Cybern. 64, 273– 283. Backoff, P. M., Palombi, P. S., and Caspary, D. M. 共1999兲. “␥-Aminobutyric acidergic and glycinergic inputs shape coding of amplitude modulation in the chinchilla cochlear nucleus,” Hear. Res. 134, 77–88. Bacon, S. P., and Grantham, D. W. 共1989兲. “Modulation masking: Effects of J. Acoust. Soc. Am., Vol. 121, No. 1, January 2007
modulation frequency, depth, and phase,” J. Acoust. Soc. Am. 85, 2575– 2580. Batra, R., and Fitzpatrick, D. C. 共1999兲. “Discharge patterns of neurons in the ventral nucleus of the lateral lemniscus of the unanesthetized rabbit,” J. Neurophysiol. 82, 1097–1113. Bregman, A. S. 共1990兲. Auditory Scene Analysis: The Perceptual Organization of Sound 共MIT Press, Cambridge兲. Cai, Y., McGee, J., and Walsh, E. J. 共2001兲. Computational Models of Auditory Function, edited by S. Greenberg and M. Slaney 共OS, Amsterdam兲. Dau, T., Kollmeier, B., and Kohlrausch, A. 共1997a兲. “Modeling auditory processing of amplitude modulation. I. Modulation detection and masking with narrowband carriers,” J. Acoust. Soc. Am. 102, 2892–2905. Dau, T., Kollmeier, B., and Kohlrausch, A. 共1997b兲. “Modeling auditory processing of amplitude modulation. II. Spectral and temporal integration in modulation detection,” J. Acoust. Soc. Am. 102, 2906–2919. Dau, T., Verhey, J. L., and Kohlrausch, A. 共1999兲. “Intrinsic envelope fluctuations and modulation-detection thresholds for narrowband noise carriers,” J. Acoust. Soc. Am. 106, 2752–2760. De Boer, E. 共1976兲. Handbook of Sensory Physiology, edited by W. D. Keidel and W. D. Neff 共Springer-Verlag, Berlin兲, Vol. 3. Dicke, U., and Dau, T. 共2005兲. “A functional point-neuron model simulating cochlear nucleus ideal onset responses,” J. Comput. Neurosci. 19, 239– 253. Evans, E. F., and Zhao, W. 共1997兲. “Onset units in guinea pig ventral cochlear nucleus: Neuropharmacological studies,” Assoc. Res. Otolaryngol. Abstr. 20, 116. Evans, E. F. 共1978兲. “Place and time coding of frequency in the peripheral auditory system: Some physiologial pros and cons,” Audiology 17, 369– 420. Ewert, S. D., and Dau, T. 共2000兲. “Characterizing frequency selectivity for envelope fluctuations,” J. Acoust. Soc. Am. 108, 1181–1196. Fletcher, H. 共1940兲. “Auditory patterns,” Rev. Mod. Phys. 12, 47–65. Frisina, R. D., Smith, R. L., and Chamberlain, S. C. 共1990兲. “Encoding of amplitude modulation in the gerbil cochlear nucleus: I. A hierarchy of enhancement,” Hear. Res. 44, 99–122. Godfrey, D. A., Kiang, N. Y. S., and Norris, B. E. 共1975兲. “Single unit activity in the posteroventral cochlear nucleus of the cat,” J. Comp. Neurol. 162, 247–268. Goldberg, J. M., and Brown, J. B. 共1969兲. “Responses of binaural neurons of dog superior olivary complex to dichotic stimuli: Some physiological mechanisms of sound localization,” J. Neurophysiol. 32, 613–636. Golding, N. L., Robertson, D., and Oertel, D. 共1995兲. “Recordings from slices indicate that octopus cells of the cochlear nucleus detect coincident firing of auditory nerve fibers with temporal precision,” J. Neurosci. 15, 3138–3153. Hewitt, M. J., and Meddis, R. 共1994兲. “A computer model of amplitudemodulation sensitivity of single units in the inferior colliculus,” J. Acoust. Soc. Am. 95, 2145–2159. Hewitt, M. J., Meddis, R., and Shackleton, T. M. 共1992兲. “A computer model of a cochlear-nucleus stellate cell: Responses to amplitudemodulated and pure-tone stimuli,” J. Acoust. Soc. Am. 91, 2096–2109. Houtgast, T. 共1989兲. “Frequency selectivity in amplitude-modulation detection,” J. Acoust. Soc. Am. 85, 1676–1680. Javel, E. 共1980兲. “Coding of AM tones in the chinchilla auditory nerve: Implications for the pitch of complex tones,” J. Acoust. Soc. Am. 68, 133–146. Joris, P. X., and Yin, T. C. T. 共1992兲. “Responses to amplitude-modulated tones in the auditory nerve of the cat,” J. Acoust. Soc. Am. 91, 215–232. Joris, P. X., Schreiner, C. E., and Rees, A. 共2004兲. “Neural processing of amplitude-modulated sounds,” Physiol. Rev. 84, 541–577. Kim, D. O., Sirianni, J. G., and Chang, S. O. 共1990兲. “Responses of DCNPVCN neurons and auditory nerve fibers in unanesthetized decerebrate cats to AM and pure tones: Analysis with autocorrelation/powerspectrum,” Hear. Res. 45, 95–113. Kohlrausch, A., Fassel, R., van der Heijden. M., Kortekaas, S. R., van der Par, S., Oxenham, A., and Püschel, D. 共1997兲. “Detection of tones in low-noise noise: Further evidence for the role of envelope fluctuations,” Acust. Acta Acust. 83, 659–669. Krishna, B. S., and Semple, M. N. 共2000兲. “Auditory temporal processing: Responses to sinusoidally amplitude-modulated tones in the inferior colliculus,” J. Neurophysiol. 84, 255–273. Kulesza, R. J., and Berrebi, A. S. 共1999兲. “Distribution of GAD isoforms in the superior paraolivary nucleus 共SPON兲 of the rat,” Assoc. Res. Otolaryngol Abstr. 22, 70–71. Dicke et al.: A neural circuit for periodicity coding
325
Langner, G., and Schreiner, C. E. 共1988兲. “Periodicity coding in the inferior colliculus of the cat. I. Neuronal mechanisms,” J. Neurophysiol. 60, 1799–1822. Langner, G. 共1981兲. “Neuronal mechanisms for pitch analysis in the time domain,” Exp. Brain Res. 44, 450–454. Langner, G. 共1997a兲. “Temporal processing of pitch in the auditory system,” J. New Music Res. 26, 116–132. Langner, G. 共1997b兲. “Neural processing and representation of periodicity pitch,” Acta Oto-Laryngol. 532, 68–76. Lorenzi, C., Soares, C., and Berthommier, F. 共1995兲. “Neuronal correlates of perceptual amplitude-modulation detection,” Hear. Res. 90, 219–227. MacGregor, R. J. 共1987兲. Neural and Brain Modeling 共Academic, San Diego兲. Meddis, R., Hewitt, M. J., and Shackleton, T. M. 共l990兲. “Implementation details of a computation model of the inner hair-cell/auditory-nerve synapse,” J. Acoust. Soc. Am. 87, 1813–1816. Meddis, R. 共1986兲. “Simulation of mechanical to neural transduction in the auditory receptor,” J. Acoust. Soc. Am. 79, 702–711. Meddis, R. 共1988兲. “Simulation of auditory-neural transduction: Further studies,” J. Acoust. Soc. Am. 83, 1056–1063. Nelson, P. C., and Carney, L. H. 共2004兲. “A phenomenological model of peripheral and central neural responses to amplitude-modulated tones,” J. Acoust. Soc. Am. 116, 2173–2186. Oertel, D., and Wickesberg, R. E. 共2002兲. Integrative Function in the Mammalian Auditor Pathway, edited by D. Oertel, R. R. Fay, and A. N. Popper 共Springer-Verlag, New York兲. Oertel, D., Bal, R., Gardner, S. M., Smith, P. H., and Joris, P. X. 共2000兲. “Detection of synchrony in the activity of auditory nerve fibers by octopus cells of the mammalian cochlear nucleus,” PNAS. National Academy of Sciences Colloquium on Auditory Neuroscience: Development, Transduction and Integration. Oliver, D. L., and Huerta, M. F. 共1991兲. The Mammalian Auditory Pathway: Neuroanatomy, edited by D. B. Webster, A. N. Popper, and R. R. Fay 共Springer-Verlag, New York兲. Palmer, A. R. 共1982兲. “Encoding of rapid amplitude fluctuations by cochlear-nerve fibers in the guinea pig,” Arch. Oto-Rhino-Laryngol. 236, 197–202. Palmer, A. R. 共1995兲. Hearing, edited by B. Moore 共Academic Press, San Diego兲. Patterson, R. D., Nimmo-Smith, I., Holdsworth, J., and Rice, P. 共1988兲. “An efficient auditory filterbank based on the gammatone function,” APU Report No. 2341, Applied Psychology Unit, Cambridge. Rees, A., and Møller, A. R. 共1983兲. “Responses of neurons in the inferior colliculus of the rat to AM and FM tones,” Hear. Res. 10, 301–330. Rees, A., and Palmer, A. R. 共1989兲. “Neuronal responses to amplitudemodulated pure-tone stimuli in the guinea pig inferior colliculus and their modification by broadband noise,” J. Acoust. Soc. Am. 85, 1978–1994. Rhode, W. S., and Greenberg, S. 共1994兲. “Encoding of amplitude modula-
326
J. Acoust. Soc. Am., Vol. 121, No. 1, January 2007
tion in the cochlear nucleus of the cat,” J. Neurophysiol. 71, 1797–1825. Rhode, W. S., and Smith, P. H. 共1986兲. “Encoding timing and intensity in the ventral cochlear nucleus of the cat,” J. Neurophysiol. 56, 261–286. Rhode, W. S., Oertel, D., and Smith, P. H. 共1983兲. “Physiological response properties of cells labeled intracellularly with horseradish perioxidase in the cat ventral cochlear nucleus,” J. Comp. Neurol. 213, 448–463. Rhode, W. S. 共1994兲. “Temporal coding of 200% amplitude modulated signals in the ventral cochlear nucleus of cat,” Hear. Res. 77, 43–68. Romand, R. 共1978兲. “Survey of intracellular recording in the cochlear nucleus of the cat,” Brain Res. 148, 43–65. Rose, G. J., and Capranica, R. R. 共1985兲. “Sensitivity to amplitude modulated sounds in the anuran auditory nervous system,” J. Neurophysiol. 53, 446–465. Rose, J. E. 共1970兲. Frequency Analysis and Periodicity Detection, edited by R. Plomp and G F. Smoorenburg 共A. W. Sijthoff, Leidon兲. Rosen, S. 共1992兲. “Temporal information in speech: Acoustic, auditory and linguistic aspects,” Philos. Trans. R. Soc. London, Ser. B 336, 367–373. Saint Marie, R. L., Shneiderman, A., and Stanforth, D. A. 共1997兲. “Patterns of gamma-aminobutyric acid and glycine immunoreactivities reflect structural and functional differences of the cat lateral lemniscal nuclei,” J. Comp. Neurol. 389, 264–276. Schouten, J. F., Ritsma, R. J., and Cardoza, B. L. 共1962兲. “Pitch of the residue,” J. Acoust. Soc. Am. 34, 1418–1424. Schreiner, C. E., and Langner, G. 共1988兲. “Periodicity coding in the inferior colliculus of the cat. II. Topographical organization,” J. Neurophysiol. 60, 1823–1840. Schreiner, C. E., and Langner, G. 共1997兲. “Laminar fine structure of frequency organization in auditory midbrain,” Nature 共London兲 388, 383– 386. Schulze, H., and Langner, G. 共1997兲. “Representation of periodicity pitch in the primary auditory cortex of the Mongolian gerbil,” Acta Oto-Laryngol., Suppl. 532, 89–95. Smith, P. H., and Rhode, W. S. 共1989兲. “Structural and functional properties distinguish two types of multipolar cells in the ventral cochlear nucleus,” J. Comp. Neurol. 282, 595–616. Tuckwell, H. C. 共1988兲. Introduction to Theoretical Neurobiology 共Cambridge University Press, Cambridge兲 Vol. 1. Winter, I. M., and Palmer, A. R. 共1995兲. “Level dependence of cochlear nucleus onset unit responses and facilitation by second tones or broadband noise,” J. Neurophysiol. 73, 141–159. Yost, W. M. 共1996兲. “The pitch of iterated rippled noise,” J. Acoust. Soc. Am. 100, 511–518. Zhang, H., and Kelly, J. B. 共2006兲. “Responses of neurons in the rats ventral nucleus of the lateral lemniscus to monaural and binaural tone bursts,” J. Neurophysiol. 95, 2501–2512. Zwicker, E., Flottorp, G., and Stevens, S. S. 共1957兲. “Critical bandwidth in loudness summation,” J. Acoust. Soc. Am. 29, 548–557.
Dicke et al.: A neural circuit for periodicity coding