2013 International Conference on Computing, Networking and Communications, Cognitive Computing and Networking Symposium
A Neural Network Approach to Category Validation of Android Applications Mo Ghorbanzadeh
Yang Chen
Bradley Dept. of Electrical and Computer Engineering Virginia Tech Blacksburg, USA mgh @vt.edu
Department of Computer Science Virginia Tech Blacksburg, USA
[email protected]
Zhongmin Ma, T. Charles Clancy, Robert McGwier Bradley Dept. of Electrical and Computer Engineering Virginia Tech Blacksburg, USA {zma0919, tcc, rwmcgwier}@vt.edu
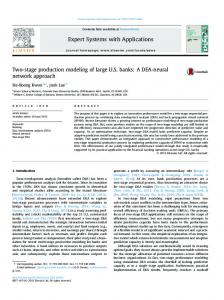
quantifying the identified smartphone malware is depicted in Figure 1 [7]. The red and green plots show the identified malware quantities from DAI-Labor in Berlin and F-secure in Helsinki, whose differentiated results imply existing malware with no public descriptions.
Abstract—Permission structure of Android applications introduces security vulnerabilities which can be readily exploited by third-party applications. We address certain exploitability aspects by means of neural networks, effective classification techniques capable of verifying the application categories. We devise a novel methodology to verify an application category by machine-learning the application permissions and estimating likelihoods of the extant categories. The performance of our classifier is optimized through the joint minimization of false positive and negative rates. Applying our modus operandi to 1,700 popular third-party Android applications and malwares, a major portion of the category declarations were judged truthfully. This manifests effectiveness of neural network decision engines in validating Android application categories.
TABLE I. SMARTPHONE OS MARKET SHARE. Operating System
Index Terms— Android Security, Permission Labels, Neural Networks.
2011 Market Share
2011 Market Share
Android
39.5%
45.4%
Blackberry OS
14.9%
13.7%
iOS
15.7%
15.3%
Windows Mobile 7
5.5%
20.9%
Others
3.5%
4.6%
I. INTRODUCTION Smartphones, combining the computational power of the personal computers (PCs) with the mobility of the cell phones, have become so popular that over 157.8 million smartphones were sold worldwide in Q4 2011 [1]. Popularity of smartphones has unleashed application (app) development drastically. Currently, Android platform holds the lion’s share of the market (c.f. Table 1), and this trend is also deemed to increase in the near future [2]. Android gained such a global popularity in view of its open-source nature which renders researchers conveniently to build idea prototypes. Moreover, as the only platform with flexible inter-app communications, Android enables implementing innovative functionality across several apps. However, the ongoing smartphomania shall provide a fertile ground for wide-spread smartphone attacks, in general, and for Android attacks, due to its market share, in particular. Since the rise of Cabir [3] in 2004 as a selfreplicating worm many smartphone viruses have appeared. For instance, Racic et al. [4] studied using the multimedia messaging service (MMS) to deplete phone batteries, Becher et al. [5] promised a mighty potential to create a worm for the Windows Mobile platform, and D’ Aguanno [6] provided a proof-of-concept attack to RIM Blackberry. Many other works have surveyed about smartphones attacks [7, 8]; even some introduced malware propagation models [9]. A diagram
978-1-4673-5288-8/13/$31.00 ©2013 IEEE
Fig. 1. Cellphone malware quantity vs. time In view of looming ubiquitous threats, an upsurge in Android security research is taking place. Majority Android security proposals are anomaly-based detections, commencing with a training proceeded by a detection phase. The training phase helps detectors learn the normal behavior, which grants a potential to detect formerly unknown attacks. Nonetheless, template-based detections, which model known malicious
740
behavior, have also been considered to feasibly detect attacks which have natures similar to PC attacks. In this paper, we propose a machine learning approach to the identification of Android app anomalies. Particularly, we employ feed-forward neural networks (NNs) [10] to categorize apps based on their permissions. Our results reveal that NNs can predict app categories efficiently and reliably. To the best of our knowledge, this is the first exhaustive work regarding category verification of Android apps. The rest of this paper is organized as follows: Section II presents major novel research on Android app security, section III explains our experimental dataset and the proposed methodology to validate app categories, section IV shows our experiments results, and section V concludes the paper.
Amidst the categories, Game’s and Applications’ Widgets requested the minimal (17) and maximal (75) distinctive permissions. Among the apps, Productivity category’s NQ Mobile Security and Antivirus app solicits 40 permissions, which alongside Productivity’s 71 unique permission requests indicate a high diversity of permission requests. Furthermore, Figure 2 shows the frequency of certain permission requests in the dataset. For example, 1,579 of the 1,700 apps (92.88%) requested the INTERNET permission. Moreover, Figure 3 demonstrates relative permission requests. Apps in our dataset requested 11,365 permissions total and 6.69 on the average. Mostly requested permissions, in a descending order, are INTERNET, ACCESS_NETWORK_STATE, WRITE_EXTERNAL_STORAGE, READ_PHONE_STATE, WAKE_LOCK, VIBRATE, ACCESS_COARSE_LOCATION, ACCESS_FINE_LOCATION and ACCESS_WIFI_STATE. While these constitute 68% of permissions requests, the remaining 115 permissions (“others” sector of the pie chart in Figure 3) only account for 32% of permission requests. Besides, INTERNET, WRITE_EXTERNAL_STORAGE, ACCESS_NETWORK_STATE, and READ_PHONE_STATE ranked respectively the mostly, second mostly, third mostly, and fourth mostly requested permissions.
II. RELATED WORK At a high level, previous Android security studies has concentrated on both platform hardening [11, 12] and app security. Amongst early efforts towards Android app security was Enck et al.’s install-time policy security system which considered risks associated with combinations of the app permissions [13]. Similar studies extended Enck et al.’s work by defining fine-grained policy rule sets [15, 16, 17, 18]. From another perspective, some works focused attention on the runtime analysis [11, 16, 19, 20], several aucurrant researches has tried a static analysis of apps. For instance, Chin et al. [21] used a 2-means clustering [22] of apps system call activities to detect Trojans. Fuchs et al. [23] used formal static analysis of apps bytecodes [24] to form data flow-permission consistency of apps as a constrained optimization problem. Another viewpoint of the static analysis of apps leverages machine learning techniques. Barrera et al. [25] used app permissions in self-organizing maps (SOMs) to visualize app permission usage as a U-matrix [14]. Besides, their SOM component plane analysis allowed identification of the frequently jointly requested permissions. However, they did not relate categories and permissions.
TABLE II. CATEGORIES UNIQUE PERMISSION REQUEST AND MOST PRIVILEGED APPS. Type
Game
III. METHODOLOGY NNs, having different applications [10], exert intelligence to learn underlying patterns of complex data. Here, we leverage NNs to detect Android apps that misrepresent their categories in their Manifest. A. Dataset Our dataset is extracted from the top 50 free apps of 34 different categories (26 and 8 in Applications and Games groups, respectively) of Google Play [26] in March 2012. The dataset includes Android Application Package (APK) files, decompiled to an .xml file via apktool [27]. APK’s Manifest .xml file describes an app’s name, version, access rights, and permission labels. For the time being, Android includes 124 permission labels, formulated as 124 dimensional binary vectors one per app. In the vectors, a “1” represents a requested permission and a “0” shows that the permission was not requested. To gain an insight into nuance of the dataset, a statistical analysis of requested permissions is performed as in Table II, which quantifies distinct requested permissions of each category and the highest number of permissions requested by apps in each category.
Apps
741
Category Arcade & Action Brain & Puzzle Cards & Casino Casual Live Wallpaper Racing Sports Games Widgets Books & Reference Business Comics Communication Education Entertainment Finance Health & Fitness Libraries & Demo Lifestyle Live Wallpaper Media & Video Medical Music & Audio News & Magazines Personalization Photography Productivity Shopping Social Sports Tools Transportation Travel and Local Weather Widgets
Unique Permissions 24 22 24 41 25 29 30 17 34 57 19 65 34 25 36 36 46 47 38 39 28 50 35 33 37 71 33 57 37 61 34 37 38 75
Most Permissions Per apps 15 9 15 15 13 13 17 12 13 29 8 36 11 12 15 18 34 25 21 14 16 19 14 18 15 40 18 19 16 32 16 21 18 39
Supplying category field to the data at the training phase produces a 34-neuron output layer. The 34 dimensional binary output vectors has a “1” component for the category included in the training data and zero otherwise. At the testing phase, the output layer generates 34 dimensional binary output vectors since it hold 34 neurons. Each of the 34 elements of the output vector for a test app reveals the probability of the app belonging to each of the 34 categories. We map the output vector into a binary vector such that the highest predicted likelihood in the output vector is mapped to “1”, while other likelihoods are zeroed. The unityvalued element of the binary output vector is the prediction of the NN about the category to which the app under test belongs. Once trained, the NN performs a permission-to-category clustering when being fed a testing dataset. The testing phase dataset contains apps from the 20% test dataset (we call these benign apps) as well as spurious apps, representing malware. To generate the malware, we permutated permissions of 50% of the test data (20% of the dataset) at random without tapering with the category fields (the 125th dimension). Therefore, a genuine app’s permission vector is changed, whilst its claimed category is pristine. The assumption is that the permission manipulated apps may misrepresent their categories declared in the Manifest. The test dataset is formed by merging the untouched and manipulated test data.
B. Neural Networks for Application Category Detection We suggest a NN-based method to detect an app’s category from its permissions by means of multilayer feedforward networks [28], chosen due to their simplicity which reduces the training time yet permits efficient feature learning. Sigmoid and linear activation functions were respectively deployed in hidden and output layers as the former tailors for pattern recognition and the latter is conducive to curve-fitting (clustering). Training, validation, and test data were respectively a typical 70%, 10%, and 20% portion of the dataset [10]. As for the structure, a feedforward two layer NN containing 10 neurons and a sigmoid transfer function in the hidden layer and the output linear transfer functions, was deployed and is depicted in Figure 4. The choice of 10 neurons is in line with recommendations for pattern recognition applications [28]. The two layer structure is chosen in view of its simplicity. Although a more sophisticated network may learn more features of the dataset, efficient learning requires much larger corpus in order for training to be meaningful. The declaration of app categories in the Manifest motivates a supervised learning [29]. Hence, NN’s inputs hold as many dimensions as the total 124 permissions plus one for the category to be incorporated into the training. Such inclusion shall remedy our experiments results by providing the NN with information, pointed to app categories, which helps the NN learn underlying relations with an eye on categories.
Fig. 4. Structure of our typical neural network. At the testing phase, to categorize apps, we stimulate the trained NN with the malware-included data. NN’s response forms 34 dimensional binary vectors, one per app from the malware-included data. The vector elements attribute categories to apps probabilistically based on the apps permissions in the light of information leaned during the training phase. Because we are cognizant of the actual categories in the pristine portion of the malware-included dataset, assuming a manipulated app may not precisely presents its claimed category; we compare the response component tantamount to the app’s claimed category - to a threshold. If NN’s prediction for an app’s category exceeds the threshold, the app is classified as belonging to that category; otherwise, the claim is refuted. Nonetheless, the verdict is prone to false positives and false negatives, jointly minimized through sweeping the threshold over a range of contiguous values (c.f. IV.B).
Fig. 2. Permission request distribution of the dataset.
C. Performance Measurement To evaluate the performance of the methodology, we choose the precision, recall, F-measure, and accuracy as the measures. These are defined by the true positive (TP), false positive (FP), false negative (FN), and true negative (TN) parameters. In our study, TPs (FNs) are benign apps predicted as being benign (malicious), whereas TNs (FPs) are malicious apps predicted as being malicious (benign).
Fig. 3. Relative permission requests of the dataset.
742
Accuracy represents the fraction desirable results which are in line with the user assessments, and precision is the fraction of desirable estimations. Recall is the fraction of user favorable items retrieved by the system and F-measure reveals a scorebased accuracy. For instance, a high precision algorithm returns more relevant results as opposed to irrelevant ones; a high recall indicates that most of relevant results were indeed returned; accuracy is the proportion of true results; and, Fmeasure is a weighted average of precision and recall.
for estimated categories of the malicious apps. As we can see, the plot reveals generally higher likelihoods for benign apps (red curves) vis-a-vis those of malicious apps (blue curves). Such a bifurcating trend promises a strong potential to distinguishing benign and malicious apps, as the malicious apps (apps misrepresenting their categories in their Manifest) will have much lower probabilities as opposed to benign apps for all possible categories. Inasmuch as miscellaneous thresholds stem out various classification results, we try to locate an optimal point as a threshold for the NN decision engine. To do so, in addition to category likelihood estimations explained above, we optimize the threshold through the joint maximization of TPs and minimization of FPs. In essence, this corresponds to minimizing FPs and FNs, c.f. Figure 6. As the threshold sweeps incrementally, the false negative rate (FNR), the blue curve, also increases. The higher the threshold, the lower value of the right app category, and the more the misclassification of benign apps as malicious ones. This is simply because malware predicted likelihoods are generally lower than the ones for benign apps (c.f. Figure 5). Similarly, increasing the threshold reduces the false positive rate (FPR). In order to locate the optimal threshold, we consider the intersection of the FPR and FNR curves, which indicates a threshold bifurcating the FP and FN apps. Such a strategy assures that the total FPs and FNs remain in a small range and that the threshold is not excessively biased. Our simulation indicated that the optimal threshold happens to be around 0.3304. We repeated the experiment ten times and the optimum mean threshold was 0.3303 with a standard deviation of 0.0005. In the simulations, we also measured the performance for 10 experiments, whose results are depicted in Table IV. As we can see the performance measures in repeated experiments have means and standard deviations of 0.652 (0.036), 0.651 (0.036), 0.652 (0.036), and 0.651 (0.036). The reason that accuracy is not very high, considering an automated approach, can be attributed to the simple structure of the neural network we used. Leveraging a more sophisticated neural network with more layers can improve the pattern recognition performance of our proposed methodology; however, this would require a much larger dataset as well.
IV. EXPERIMENTS Here, we illustrate results of implementing our methodology and evaluate the performance of the suggested method. Before presenting simulation results, it is worth mentioning that, in order to fine-tune our classifier, we investigated the deployment of various training algorithms [30] which are listed in Table III. The first column of the table is the symbolic name used for the algorithm, mentioned in the second column. The last column represents the accuracy of our tests associated with each corresponding training methodology. As we can see from Table III, Bayesian regularization boasts the highest accuracy (0.606), which indicates that it can return more TPs and TNs. Furthermore, Bayesian regularization was expedient in terms of the training time. TABLE III. ACCURACY OF DISTINCT TRAINING ALGORITHM. Function trainbfg trainbr traincgb traincgp traingda traingdm traingdx trainscg trainlm trainoss
Training Algorithm BFGS Quasi-Newton Back-propagation Bayesian Regularization Powell-Beale Polak-Ribiere Adaptive Learning Momentum Back-propagation Adaptive Learning & Momentum Scaled Gradient Descent Levenberg-Marquardt Secant Back-propagation
Accuracy 0.471 0.606 0.550 0.341 0.509 0.477 0.527 0.585 0.479 0.462
1
FPR FNR
0.8
0.6
0.4
0.2
Fig. 5. The distribution of benign and malicious apps. The red histogram shows the likelihood distribution of the benign apps. 0
Figure 5 presents the empirical distribution of the predicted category likelihoods which were estimated by the trained NN. The red plots are distributions for predicted categories of the benign apps, whereas the blue ones represent the distribution
0
0.1
0.2
0.3 Threshold
0.4
0.5
Fig. 6. The threshold vs. FPR and FNR. Cross-point is the optimal likelihood, separating benign and malicious apps.
743
0.6
TABLE IV. PERFORMANCE MEASURE 1 2 3 4 5 6 7 8 9 10 AVG
TP 116 115 106 109 116 105 114 102 105 121
FP 54 55 64 61 54 65 56 68 65 49
FN 55 55 64 61 54 66 57 69 65 49
TN 115 115 106 109 116 104 113 101 105 121
Recall 0.682 0.676 0.624 0.641 0.682 0.618 0.671 0.600 0.618 0.712 0.652
Precision 0.678 0.676 0.624 0.641 0.682 0.614 0.667 0.596 0.618 0.712 0.651
[7] F 0.680 0.676 0.624 0.641 0.681 0.616 0.667 0.598 0.618 0.712 0.652
Accuracy 0.679 0.676 0.624 0.641 0.682 0.615 0.668 0.597 0.618 0.712 0.651
[8] [9]
[10] [11]
[12]
V. CONCLUSIONS AND FUTURE WORK We have introduced a neural network supervised learning approach to validate Android applications categories mentioned in their Manifest using their permission requests by estimating the likelihoods of belonging to each existing category, and the maximum likelihood identifies the category to which the app belongs. Our experiments using various training algorithms indicate that Bayesian regularization training renders results more accurate. Furthermore, we leveraged a threshold sweeping approach to jointly minimize false positive and false negative rates in order to find the optimum threshold. Analyzing a representative dataset, 1,700 apps from 34 categories, reveals an increasing trend in permission request traits by applications. However, the frequency of permission requests suggests that they have long tail decay characteristics. Measuring the performance of the proposed methodology shows that leveraging the neural networks to detect whether applications are misrepresenting the categories in their Manifest is promising in that malicious apps have much lower likelihoods compared to benign apps when they are fed into the neural network. As a future improvement, works need be done for developing of a malware set, whose applications truly misrepresent their categories. Current study assumes that manipulating the applications permissions, without altering the categories, may be a categorical misrepresentation; which is not necessarily always true. Also devising more sophisticated neural networks including more layers can improve the results obtained in this study.
[13]
[14] [15]
[16]
[17]
[18]
[19]
[20]
[21]
[22]
[23]
REFERENCES [1] [2]
[3] [4]
[5]
[6]
Market Share, http://www.idc.com/getdoc.jsp?containerId=prUS23299912 Business Insider, http://articles.businessinsider.com/2011-0402/tech/30089528_1_android- phones-google- s-android-smartphonemarket (2011) Cabir, http://www.f-secure.com/v-descs/cabir.shtml R. Racic, D. Ma, H. Chen, “Exploiting MMS Vulnerabilities to Stealthily Exhaust Mobile Phone’s Battery”, in Proceedings of the Second IEEE Communications Society/International Conference on Security and Privacy in Communication Networks (SecureComm), 2006. M. Becher, F. Freiling, B. Leider, “On the Effort to Create Smartphone Worms in Windows Mobile”. in Information Assurance and Security Workshop, 2007, IAW’s 07. IEEE SMC, 199--206, 20-22 (2007) RIM Worm, http://www.praetoriang.net/presentations/blackjack.html
[24] [25]
[26] [27] [28] [29]
[30]
744
A. Schmidt, S. Albayrak, “Malicious software for smartphones”. Technical Report TUB-DAI 02/08-01. Technische Universit¨at Berlin, 2008 S. Toyssy, M. Helenius, “about Malicious Software in Smartphones”. Journal in Computer Virology, 2(2): pp.109-119, 2006. Y. Bulygin,”Epidemics of Mobile Worms”. in Proceedings of the 26th IEEE International Performance Computing and Communications Conference, IPCCC. IEEE Computer Society, pp. 475-478, 2007. S. Grossberg, “Neural Networks and Natural Intelligence”. MIT Press, 1988. M. Lange, S. Liebergeld, A. Lackorzynski, M. Peter, “L4Android: A Generic Operating System Framework for Secure Smartphones”. in: Proceedings of the ACM Workshop on Security and Privacy in Mobile Devices, SPSM, 2011. A. Shabtai, U. Kanonov, Y. Elovici, C. Glezer, Y. Weiss, “Andromaly: A Behavioral Malware Detection Framework for Android Devices”. Journal of Intelligent Information Systems, 2011. W. Enck, M. Ongtang, P. McDaniel, “On Lightweight Mobile Phone Application Certification”. in: Proceedings of the 16th ACM Conference on Computer and Communications Security, CSS, 2009. T. Kohonen, “Self-Organizing Networks”. In Proceedings of the IEEE, 1990. A. Beresford, A. Rice, N. Skehin, R. Sohan, “MockDroid: Trading Privacy for Application Functionality on Smartphones”. in: Proceedings of the 12th Workshop on Mobile Computing Systems and Applications. HotMobile, 2011. D. Foresee, M. Hagan, “Gauss-Newton Approximation to Bayesian Learning”. in Proceedings of International Joint Conference on Neural Networks, vol. 3, pp. 193-1935, 1997. M. Conti, V. Nguyen, B. Crispo, “CRePE: Context-Related Policy Enforcement for Android”. in Proceedings of the 13th Information Security Conference, ISC, 2010. M. Nauman, S. Khan, X. Zhang, ”Apex: Extending Android Permission Model and Enforcement with User-defined Runtime Constraints”, Proceedings of ASIACCS, 2010. W. Enck, P. Gilbert, B. Chun, L. Cox, J. Jung, P. McDaniel, A. Sheth, “TaintDroid: An Information-Flow Tracking System for Realtime Privacy Monitoring on Smartphones”. in Proceedings of the 9th USENIX Symposium on Operating Systems Design and Implementation, 2010. G. Portokalidis, P. Homburg, K. Anagnostakis, H. Bos, “Paranoid Android: Versatile Protection For Smartphones”. in Proceedings of the 26th Annual Computer Security Applications Conference, 2010. E. Chin, A. Felt, K. Greenwood, D. Wagner,”Analyzing InterApplication Communication in Android”. in Proceedings of the 9th Annual International Conference on Mobile Systems, Applications, and Services, MobiSys, 2011. J. MacQueen, “Some Methods for Classification and Analysis of Multivariate Observations”. in Proceedings of the 5th Berkeley Symposium on Mathematical Statistics and Probability, 1967. A. Fuchs, A. Chaudhuri, J. Foster, “ScanDroid: Automated Security Certification of AndroidApplications”, Technical report, University of Maryland, 2009. WALA: http://wala.sourceforge.net/wiki/index.php. D. Barrera, H. Kayacik, P. Oorshot, A. Somayaji, ”A Methodology for Empirical Analysis of Permission-Based Security Models and its Application to Android”. in Proceedings of the ACM Conference on Computer and Communications Security, 2010. Google Play, https://play.google.com/store/apps APktool, http://code.google.com/p/android-apktool/(2012). D. MacKay, “Bayesian Interpolation. Neural Computation”, vol. 4, 1992. S. Geman, E. Bienenstock, R. Doursat, “Neural Networks and the Bias/Variance Dilemma”, Journal of Neural Computation, Vol. 4, Issue 1, pp 1-58, 1992. M. Beale, M. Hagan, H. Demuth, “Neural Network ToolboxTM R2012b”, The MathWorkc Inc., 2012.