interpretation of traditional aerial photography as being too complex,. i.e., a science or ... Figure 1 Digitized National Aerial Photography Program (NAPP) image (1 x 1 m) of ..... Logic, Management Information, Inc., New York, NY, 408 p. Roli F.
A Neural Network Image Interpretation System to Extract Rural and Urban Land Use and Land Cover Information from Remote Sensor Data John R. Jensen Department of Geography University of South Carolina Columbia, SC 29208
Fang Qiu Program in Geographic Information Science School of Social Science University of Texas at Dallas Richardson, TX 75083-0688
Keith Patterson Geonex Corporation 8950 5th Street North St. Petersburg, FL 33702
Abstract This paper describes the characteristics of a neural network image interpretation system that is designed to extract both rural land cover and urban land use from high spatial resolution imagery (e.g., digitized aerial photography, IKONOS imagery) and/or from relatively coarse spatial and spectral resolution remote sensor data (e.g., Landsat Thematic Mapper). The system consists of modules that a) classify remote sensing imagery into different land use/land cover types, b) segment the rural land cover information into relatively homogeneous polygons in a standard GIS format, and/or c) digitize and interpret urban/suburban land use cover polygons based on their feature attribute information with the aid of a neural network.
Introduction There has been great interest in the extraction of land use/ land cover and biophysical information from satellite remotely sensed data using digital image processing techniques since the late 1960s (Estes and Jensen, 1998; Lulla and Dessinov, 2000). Significant strides have been made in the digital extraction of biophysical information (especially temperature, biomass, leaf-area-index, net primary productivity, terrain elevation) from digital remote sensing data (Jensen, 1996; 2000). However, less improvement has been seen in the extraction of Anderson Level II, III, and IV land use and land cover information, which often requires the digital processing of relatively high spatial resolution data. One of the major reasons for this lag in capability is that most digital image processing classification algorithms are based on traditional statistical methods that assume normally distributed data, and no collinearity among variables (Johnston, 1980). High spatial resolution remote sensor data are often composed of many heterogeneous patches of terrain Geocarto International, Vol. 16, No. 1, March 2001 Published by Geocarto International Centre, G.P.O. Box 4122, Hong Kong.
and complex nonlinear patterns. The normality and linearity assumptions of the statistical methods may be violated. In addition, most statistical digital image processing systems only utilize the spectral information presented in the remote sensing imagery on a pixel by pixel basis. They do not incorporate contextual information very well. Thus, the land use/land cover classification results obtained using traditional statistical image processing techniques are often crude when compared with those produced by a well-trained image interpreter (Philipson, 1997). Human image interpreters do not interpret an image as if it were composed of individual pixels. They employ the totality of information associated with an unknown object or area, including its tone, color, size, shape, shadow, texture, pattern, height, site, and contextual situation and association (Estes et al., 1983; Jensen, 2000). For these reasons, most statistically-based digital image analysis is restricted to extracting relatively simplistic Level I and some Level II land cover information. In fact, the scientific community has become rather accustomed to accepting approximately 7080 percent absolute accuracy as about the maximum 19
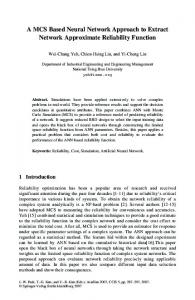
obtainable from satellite digital multispectral data using digital image processing techniques (Jensen, 1996). The extraction of Level II, III, and IV land use and land cover information have been almost exclusively obtained from the visual interpretation of high spatial resolution, relatively large scale (≥ 1:40,000) black and white (panchromatic), color, and/or color-infrared aerial photography. It requires great skill to visually interpret aerial photography correctly. It is a relatively slow and laborious process that is fraught with error because: • The data were acquired using a central perspective camera system that introduces several types of error that are difficult to remove, including: scale changes throughout the image due to relief displacement, vignetting (light fall-off) away from the principal point of the photograph, and at times, tonal changes due to photographic processing and emulsion differences; • an interpreter brings to the interpretation task all his or her knowledge (correct and incorrect), biases, anxieties, fatigue; and • the polygons identified on the aerial photography must usually be laboriously transferred to a planimetric basemap and then digitized to place them in a geographic information system (GIS). These characteristics have caused the public at large to dismiss the interpretation of traditional aerial photography as being too complex, i.e., a science or art best left to experts (Philipson, 1997; Jensen and Cowen, 1999). Only specialized companies and certain federal and state agencies with trained image analyst routinely extract accurate land use/land cover information from such data (Baker, 2000). For example, Figure 1 depicts the land use/land cover polygons for a portion of the Jacksonville Beach, FL 7.5-minute quadrangle extracted from digitized National Aerial Photography Program (NAPP) photography by personnel at the Geonex Corporation using visual image interpretation techniques and manual digitization. It takes approximately 11.5 person days for a specialized company like Geonex
Figure 1
20
Digitized National Aerial Photography Program (NAPP) image (1 x 1 m) of Jacksonville Beach, FL with vectors derived from “on-screen” visual image interpretation.
to extract land use/land cover information for each 7.5-minute quadrangle. The launch of Space Imaging’s IKONOS satellite in 1999 with its 1 x l m panchromatic band and four 4 x 4 m multispectral bands initiated a new era of Earth observation (Li, 1998; Dehqanzada and Florini, 2000). Other commercial data providers intend to provide high spatial resolution data in the near future such as EarthWatch Quickbird (l x l m pan; 4 x 4 m multispectral), and OrbImage Orb View-3 (1 x 1 m pan; 4 x 4 m multispectral). Such imagery will be a significant boon to obtaining accurate Level II, III, and IV land cover/land use information, if there are appropriate image analysis techniques available (Jensen and Cowen, 1999).
Analysis of High Spatial Resolution Imagery High spatial resolution (≤ 4 X 4 m) black and white, color and color-infrared digital imagery for all practical purposes looks like aerial photography when viewed on a CRT screen. This provides an opportunity to extract Level II, III and IV land use/cover information by “on-screen” (also referred to as “heads-up”) visual human interpretation and subsequent digitization of the polygons of interest. The problem is that photointerpretation has almost become a lost art, not having been taught systematically in colleges and universities for the past 20 years (Estes and Jensen, 1998). Remote sensing digital image processing courses simply do not cover the same manual, visual photo interpretation skills once so commonly taught in introductory airphoto interpretation or photogrammetry courses. Unfortunately, there will likely be a significant increase in “on-screen” photo interpretation of the high resolution digital remote sensor data performed by novices who do not have a clue as to what they are doing. Baker (2000) points out that the availability of the new very high resolution imagery may in fact be a double-edged sword. If we have the appropriate tools, excellent information may be extracted from the imagery. If we don’t have the right tools, serious image interpretation errors will result. Image interpretation errors will make their way into the public forum where it is possible that the public at large will then lose faith in the accuracy of information derived from remote sensor data (Baker, 2000). In order for the high spatial resolution digital imagery to be fully utilized for the extraction of Level II, III, and IV land use/cover information we need user-friendly digital image interpretation
systems that assist image analysts as they literally photointerpret the high spatial resolution imagery on the CRT screen. The improved image interpretation system should supply image and collateral information that the analyst uses to make the most accurate interpretation possible. It is also important that the digital image processing system generate polygonal boundaries for geographically extensive objectsof-interest, either automatically or semi-automatically, so that the time and labor involved in digitization can be greatly reduced. In addition, the system should automatically place the interpreted results in a planimetric map projection so that the information is available for modeling purposes (Jensen and Cowen, 1999). This paper summarizes the status of the development of an artificial neural network based image interpretation system for land use/land cover classification using high spatial resolution remote sensor data that accomplishes many of these goals.
Design of an Artificial Neural Network Image Interpretation System The image interpretation system must be able to extract accurate land use/land cover information from both rural and urban/suburban landscapes to be effective. The following sections describe some of the important considerations. Urban/Suburban Considerations Urban environments are composed of diverse natural (e.g., vegetation, soil, rock, water) and man-made materials (e.g., plastic, asphalt, concrete, metal) that man arranges in a variety of ways including asphalt rooftop shingles, asphalt pavement, concrete sidewalks and roads, grass lawns and golf course fairways. It is possible to have a computer program analyze an image and identify the homogeneous landscape ‘patches’ of biophysical material in a high spatial resolution image based on spectral information. The output from such a computer analysis is general a map depicting the relatively homogeneous patches of vegetation, asphalt, concrete, water, metal, etc. that represent biophysical information and not land use/cover information. Conversely, when a human being interprets a high resolution aerial image on a CRT screen, he or she is usually capable of automatically identifying some of the fundamental “primitive” land uses attributes such as sidewalks, roads, buildings, parking lots, water bodies, etc. The analyst then commonly draws a polygon around what they believe to be an unknown object-of-interest that contains many of these primitives (e.g., a shopping center, single-family tract of residential housing, apartment complex, open pit mine, mall, a fabrication industry). Unfortunately, the analyst is often unable to identify exactly what type of land use or land cover is found within the polygon. To do this, the analyst must often use not only spectral information, but also contextual information associated with nearby objects of interest and other elements of image interpretation previously discussed. This is precisely where the artificial neural network (ANN) image interpretation system described in this paper becomes
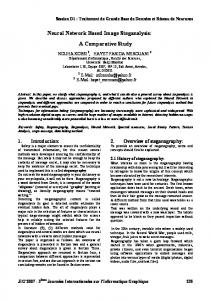
useful. The system allows the analyst to identify in common terms the “primitive” land use attributes found within the polygon he or she has drawn on the screen. The ANN then analyzes the input attributes with the expert knowledge stored in the ANN library of attributes, and suggests to the analyst the most logical label for the polygon. The polygon is then updated and the neural network evaluates the next polygon-of-interest. Eventually, the entire urban study area is mapped with all information stored in a vector-based GIS database for future spatial modeling purposes. Rural Considerations Rural land use/land cover consists of water, agriculture, forest, wetland, rangeland, grassland, desert, etc. Except for highly engineered agricultural areas, these rural landscapes are usually composed of many relatively homogeneous patches with curvilinear boundaries (i.e., humans tend to rectilinearize the landscape to make it mechanically efficient). Unlike the urban environment, it would be an unwise waste of time and talent for an image analyst to draw a polygon around each patch of homogeneous wetland, forest, or water. Rather, for rural areas it is logical to allow the computer to locate the homogeneous patches using an image classification and/or segmentation routine, generate the edges of the patch using an edge-detection algorithm, and covert the edge to a clean bounding polygon that can be stored in a GIS. It is possible to train a neural network system on the spectral and textural information associated with various rural land cover types, such as forested wetland, non-forest wetland, water, etc. so that it a) identifies homogenous polygons, and b) assigns each polygon to a unique land cover class. Final Design A neural network image interpretation system was designed that addressed many of these urban and rural considerations. It consists of the following integrated modules (Figure 2) 1) an Image Classification Module that is used to process high spatial resolution imagery based on spectral, contextual, and/or textural information using a backpropagation neural network algorithm; 2) a Rural Image Segmentation Module that removes the noise found in the classified regions and groups them into homogeneous image segments to extract and label smooth bounding polygons automatically for geographically extensive rural areas; and 3) an Urban/Suburban Image Digitization and Interpretation Module that allows analysts to draw bounding polygons around objects-of-interest in the extremely complex urban/suburban environment, identify “primitive” land use attributes within the objects-of-interest, and use a neural network to assist in the identification of the most logical land use or land cover type. A GIS is used to integrate these modules so that land use/ land cover information from both rural and urban/suburban 21
Figure 2
The Neural Network Image Interpretation System for extracting land use/land cover information from remote sensing data.
areas can be merged into a single spatial database. The GIS can also be used to smooth and edit polygon boundaries, if desired.
Methodology Neural networks simulate the thinking process of human beings whose brain uses interconnected elements called “neurons” to process incoming information (Jensen et al., 1999). A neural network reaches a solution not by using a step-by-step algorithm or a complex logical program, but in a non-algorithmic, unstructured fashion based on the adjustment of the weights connecting the neurons in the network (Rao and Rao, 1993). Neural networks have been 22
used to classify various types of remote sensor data and have in certain instances produced superior results when compared to that of traditional statistical methods (Benediktsson et al., 1990; Foody et al., 1995; Atkinson and Tatnall, 1997). This success can be attributed to two of the important advantages of neural networks: 1) freedom from normal distribution requirements, and 2) the ability to adaptively simulate complex and non-linear patterns given proper topological structures (Atkinson and Tatnall, 1997; Jensen et al., 1999). Therefore, a neural network was selected to implement the Image Classification Module, because high spatial resolution digital imagery consists of non-normally distributed data and nonlinear biophysical and land use/land cover characteristics.
To implement the Urban/suburban Digitization and Interpretation Module, one might consider using an expert system instead of a neural network. Neural networks are believed to be superior in simulating the interpretation process of an image analyst for a number of reasons. First, the knowledge in an expert system that must be extracted from knowledgeable experts of a domain area may be subjective and incomplete. This is because the experts may have a biased or even incorrect understanding of reality, and/or they may not be aware of underlying rules they have used or have difficulty articulating these rules (Neural Ware, 1996). Conversely, knowledge in a neural network is acquired through learning by empirical (real-world) examples. Although experts are essential in selecting and preparing example data, generally their personal biases are excluded from the knowledge acquisition process. Second, knowledge in an expert system is represented by logical rules made up of binary predicates. Numerical attributes such as the number of driveways and the size of a building have to be converted to binary true/false statements that may cause a large amount of information to be lost in the simplification process. On the other hand, a neural network can embrace data in nominal, ordinal, interval and/or ratio scales in its knowledge base (Roll et al., 1996). Third, most rule-based expert systems fail to generalize a predictable inference if an appropriate match with the perfect rules that must be articulated by experts cannot be obtained. Conversely, the knowledge in a neural network derived from real-world examples inevitably contains some noise no matter how careful these examples are selected. Therefore, neural networks are good at generalizing both discrete and continuous data and have a capability to interpolate or adapt to the patterns never seen in the training process. Thus, neural networks are tolerate of noise and missing data and always attempt to find the best fit for input patterns (Russell and Norvig, 1995; Kasabov, 1996). Finally, neural networks continuously adjust the weights as more training data are provided in a changing environment. Thus, they learn.
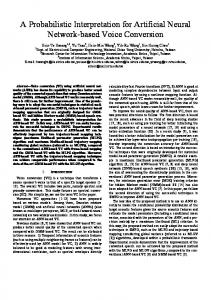
digital elevation information) can be incorporated into the classification module as additional features along with the original spectral bands of remote sensor data. Figure 3 depicts the topological structure of the backpropagation neural network used in the Neural Network Image Classification Module in which neurons are arranged into three layers, (i.e., input layer, hidden layer and output layer). The neurons in the input layer represent the spectral and/or textural information of the n x n pixels within the moving window. The use of hidden neurons in the hidden layer enables the simulation of nonlinear patterns found in the high-resolution imagery. Every neuron in the output layer represents one class of land use/land cover. The Image Classification Module process includes two phases: training and testing (classification). Training In the training phase, the analyst selects specific x, y locations in the input image with known attributes (e.g., forested wetland, water, upland pine) as training sites. The per pixel spectral information and contextual surrounding information for each of these training sites is then collected and passed to the input layer of the neural network. At the same time, the true target (class) value is sent to neurons of the output layer by assigning the neuron representing this class a membership value of 1, while all the other neurons are assigned a value of 0. Neural network training based on the examples obtained from an image acquired at a specific
The Neural Network Classification Module The process of classifying both urban and rural land use/ cover information using high resolution imagery may be initiated by first passing the data through the Neural Network Image Classification Module to generate relatively homogeneous regions of interest. This module uses a backpropagation neural network (Heermann and Khazenie, 1992; Civco, 1993; Benediktsson and Sveinsson, 1997) with two additional options (Figure 2): 1) It allows the classification to be performed not only on a single pixel, but also on a neighborhood of spectral information through the use of an n x n moving window. The employment of a moving window enables the neural network classifier to remove some noise by intentionally utilizing the spectral information of the surrounding pixels. 2) Image texture (variance) and other ancillary data (e.g.,
Figure 3
The topological structure of the back-propagation neural network used in the study. 23
time and location may only be of value to the imagery in the immediate geographic area and perhaps for only a given season. Learning is accomplished by adjusting the weights using backpropagation algorithm. For each training example, the output of the network is compared with the true target (class) value. The difference between the target and output value is regarded as an error and is passed back to previous layers in the network to update the connection weights. The magnitude of the adjustment is proportional to the absolute value of the error. After many iterations, the root mean square (RMS) error diminishes to a small value less than a predefined tolerance and further iterations will not improve the performance of the network (Jensen et al., 1999). At this time, the system achieves convergence and the training process is completed. The rules inherent in the examples are stored in the weights of the network for use in the testing (classification) phase. Testing (Classification) During the test or classification stage, the spectral and/or textural characteristics of every pixel in the scene irrespective of whether they are urban or rural are passed to input neurons of the neural network. The network evaluates each pixel using the weights stored in the network to produce a predicted value for every neuron of the output layers. The value obtained for every output neuron is a number between 0 and 1 that gives the fuzzy membership grade of the pixel belonging to the class represented by that neuron. The value of every output neuron for all the pixels in the study area comprises the fuzzy classification map of each class. Defuzzification of these maps using a local maximum function leads to a hard classification map where each pixel is assigned to a unique class that has the highest fuzzy membership grade (Jensen, 1996). Rural Image Segmentation Module After each pixel in the scene is classified into a unique class in the Neural Network Image Classification Module, the resultant map is usually still very noisy even though a 3 x 3 moving window was applied. It is then necessary to group the classified pixels in the scene into relatively homogeneous segments. This has been frequently dealt with using a local majority filter. Unfortunately, the size of neighborhood for the filter has to be very large for the noise to be sufficiently removed. A large size neighborhood may alter the boundaries between classes and creating zigzag bounding polygons. In this study, an alternative approach was proposed that preserved the detail of the boundary while noise in the scene was effectively removed. Each class output from the Image Classification Module was first disassembled into individual layers. Pixels that belonged to a class kept their original code, while pixels of all others classes were recorded as 0. The two types of noise exhibited in each class are shown in Figures 4a and 5a. “Exterior noise” consists of small groups of pixels that exist outside the major regions of a class. “Interior noise” consists of small groups of pixels unclassified within major regions of a class. Each separate layer is processed using two passes of a RegionGroup operation. After the first pass, all the regions that have an area less than a user-specific threshold (e.g., 10,000 pixels) are selected, which includes both “interior noise” and “exterior noise” regions. The selected regions are recoded to 0, which is the code for the background. As a result, the “exterior noise” region for the class is removed, but the “interior noise” regions are untouched because they were assigned a value of 0 before 24
Figure 4
Rural image segmentation for the water class.
to indicate other class types (Figure 4b and 5b). The second pass of the RegionGroup operation identifies the remaining “interior noise” regions that are less than the predefined threshold in area and have a value of 0. By recoding the selected
land cover, although in an urban environment it is still quite heterogeneous. Finally, the individually processed layers of the thematic classes are recombined into a single layer. The cleaned layer is then vectorized using an edge-generation program. The boundaries for the rural area can be smoothed or edited if desired, while the outlines for the urban area can be deleted if necessary. For example, the water and wetland classes in final polygon format are draped over the color infrared image in Figures 6ab to demonstrate the quality of the segmentation processing. A portion of the neural network classification and image segmentation derived map is compared with the original “on-screen” digitization derived map in Figure 6cd. Notice that human interpreters are usually reluctant to get into the complex details associated with the curved boundary of the wetland class as they perform “onscreen” digitization, whereas the neural network program can easily identify the intricate nature of the wetland. Different thresholds can be employed for different land use/land cover types. Unlike the case of the same-size threshold segmentation, a pixel may be assigned to more than one class before the combination of the layers. In order to solve this problem, the system can specify different priorities for each layer. When different layers of segmented classes arc combined, the value of the highest priority class may be assigned as the final class of the pixel. Urban/Suburban Image Digitization and Interpretation Module For the urban/suburban area, it is possible to utilize the existing polygon generated from the image classification-segmentation procedure described above. However, most of time, it is advisable to use the Urban/Suburban Image Digitization and Interpretation Module to capture the land use information in the complex urban/suburban environment. This module utilizes Arc View (the interface is shown in Figure 7) and three specialized components: a) criteria definition, b) attribute information collection, and c) neural network-assisted image interpretation.
Figure 5
Rural image segmentation for the upland forest class.
regions with the code representing the class, the “interior noise” regions are aggregated with the major regions of the class and are removed from the class layer (Figure 4c and 5c). These two operations result in relatively homogeneous segments of rural
Criteria Definition The first decision is to determine what primitive attributes will be used to classify an object-of-interest in the urban environment. These attributes are usually not spectral in nature, but rather contextual and spatial in nature, including the number of sidewalks, size of parking lots, and/or the number of stories in a building. These attributes are used by the back-propagation neural network as training criteria (Figure 8). The neural network has a three-layer topological structure similar to the one utilized in the image classification module. However, the number of neurons of the input layers is determined by the number of primitive attributes used rather than by the number of image bands. The number of neurons in the output layer is still specified by the number of land use classes. A graphical-user-interface was designed to facilitate the specification of these attributes. A file that accommodates the description of the attributes is created and contains the name, data type, storage length, brief description and data range of each attribute. The attributes can be nominal or numerical (Figure 9). Attribute Information Collection As discussed earlier, the boundary of an unknown object-ofinterest can be generated using the Neural Network Image 25
Neural Network Derived Water Class
a.
b.
On-screen Digitization Method
Neural Network Classification-Segmentation Method
c.
d.
Figure 6
Figure 7
26
Neural Network Derived Wetland Class
Results of the Neural Network Image Interpretation System compared with those of traditional “on-screen” digitization.
The graphical-user-interface of the Urban/suburban Image Digitization and Interpretation Module.
Classification Module. However, with high spatial resolution imagery it is more likely that the objectof-interest in the urban area will be identified using the “on-screen” digitization method. For example, Figure 7 depicts a polygon drawn around an object-of-interest based on “on-screen” digitization. In this case, it is clear to most experts that this is a multiple-family residential housing complex. However, this may not be clear to a novice image interpreter. The Urban/Suburban Image Digitization and Interpretation Module can be used to collect information about various attributes within the polygon-of-interest. The graphical-user-interface shown in Figure 9 helps the analyst obtain the attribute information about the feature under investigation. The user first checks the attribute presented and then assigns the value for the attribute through a slide-bar if the attribute is a quantitative variable, or a scrolllist if it has qualitative characteristic. Unchecked values are treated as missing data. If the information collected is for training purposes, the true target class is required. Otherwise, it is optional for the user to assign his or her best guess about the possible class of the feature. Once the attribute information of the object-of-interest is collected, it is saved as a record in the feature attribute file of the polygon and passed to the neural network interpretation component for subsequent training or testing (classification). Neural Network-Assisted Image Interpretation The Urban/Suburban Image Digitization and Interpretation Module makes use of quantitative attribute information directly. Qualitative attribute information are automatically converted to numerical values. Similar to the image classification module described, this module also consists of training and testing (classification) stages. In the training stage, the neural network learns the rules (weights) of image interpretation from all the input training examples. Training examples obtained from images acquired at different times and even different locations can be used to extract the image interpretation rules for urban/suburban areas. This makes it possible for the knowledge base extracted for one project to be extended across both space and time and used in other projects. Once the training process is complete and all the “rules” are saved as the weights of the neural network, these rules can be applied to classify unknown objects-of-interest. After the attribute information of the unknown object are retrieved and passed to the neural network, it outputs the calculated class membership grade of the object by recalling the “rules” stored in the weights of
Table 1
Potential Cost-Benefit of Implementing A Contextual NeuralNetwork Method of Extracting Rural and Urban Information for a Single 7.5-minute Quadrangle
Approximate Person-Effort to Extract Information per 7.5-minute Quadrangle Using Traditional Photointerpretation Techniques
Days
Combined on-screen digitization of Land Use/Land Cover 1 Total
11.5 11.5
Approximate Person-Effort to Extract Information per 7.5-minute Quadrangle Using Digitally Assisted Image Analysis Techniques Rural Land Cover (using Neural Network assisted classification and segmentation) Urban Land Cover (using both traditional visual image interpretation and neuralnetwork assisted methods of image classification and segmentation) 1 Total
1 4
5
Potential Time Saving Benefit per 7.5- minute Quadrangle 6.5/11.5=56.5% Figure 8
The graphical-user-interface for the criteria definition component.
l
These calculations do not include Arc-Info validation time.
miniute quadrangle was approximately 56.5 percent of the original 11.5 days.
Summary
Figure 9
The graphical-user-interface for the attribute information collection component.
neurons in the network. After confirmation, the class information is passed to the polygon attribute table to update the record for the object. Beginning image analysts also have the option to compare the labeling provided by the neural network to the their best guess. This helps them to gradually develop improved image interpretation skills. The Urban/Suburban Image Digitization and Interpretation Module is still under development. Not all the urban land use classes have been sufficiently included and/or trainedon using the system. In order for the module to be operational, additional classes of training examples such as those for industrial land use categories are needed. We are in the process of continuing the development of the training database so that the system will contain sufficient “rules” for the neural network to classify the urban land use consistently. Table 1 estimates the cost of performing image interpretation using traditional versus a neural network image interpretation system per 7.5-minute quadrangle (Patterson et al., 1998). The potential time saving benefit per 7.5-
A Neural Network Image Interpretation System for the extraction of urban and rural land use/land cover information from high spatial resolution digital imagery was designed and implemented. The system consists of modules that a) classify high spatial resolution imagery into different land use/land cover types, b) segment the rural land cover information into relatively homogeneous polygons in a standard GIS format, and c) digitize and interpret urban/ suburban land use polygons based on their feature attribute information. The Image Classification and Rural Image Segmentation Modules have value because they generate a relatively accurate classification of extensive rural land cover such as wetland, water, and upland forest in a digital polygon format. This removes an expensive step in the current process whereby the geographically extensive rural land cover are often laboriously visual photo-interpreted and then manually digitized into the GIS database. This methodology can be also extended to classify relatively coarse spatial and spectral resolution remote sensor data, such as Landsat Thematic Mapper image. The image Segmentation Module can also be applied to the post-classification processing of the results obtained from other digital image classification approaches, so that noise can be effectively removed while the boundaries between classes remain smooth. The Urban/Suburban Image Digitization and Interpretation Module demonstrates great potentials for interpreting urban land use. It requires more training examples to be fully operational. Examination of the initial results in the study suggests that the urban image interpretation prototype may 27
also be of values for training novice image interpreters. Unfortunately, a neural network based image processing system is a black box making it impossible to explain how a particular answer has been reached by the network. There exists an inherent inability to represent knowledge acquired by the network in an explicit form with simple “if-then” rules. The rules of image classification and interpretation learned by the neural network are buried in the weights of the hidden neurons of the hidden layers. A possible solution is to combine neural networks with fuzzy logic so that the knowledge residing in the hidden neurons of the network can be extracted in the form of fuzzy “if-then” rules (Qiu, 1999).
Acknowledgments This research was funded by NASA Commercial Remote Sensing Program (CRSP) at John C. Stennis Space Center.
Jensen, J. R., 1996. Introductory Digital Image Processing: A Remote Sensing Perspective, Prentice-Hall Inc., Upper Saddle River, NJ, 318 p. Jensen J. R. 2000. Remote Sensing of The Environment: An Earth Resource Perspective, Prentice-Hall, Inc., Upper Saddle River, NJ, 544 p. Jensen, J. R. and D. C. Cowen, 1999. Remote sensing of urban/ suburban infrastructure and socioeconomic attributes, Photogrammetric Engineering and Remote Sensing, 65(5): 611622. Jensen J. R., F. Qiu and M. Ji, 1999, Predictive modeling of coniferous forest age using statistical and artificial neural network approaches applied to remote sensing data, International Journal of Remote Sensing, 20(14): 2805-2822. Johnston, R. J., 1980. Multivariate Statistical Analysis in Geography: A Primer on the General Linear Model, Longman Scientific and Technical, New York, NY, 280 p.
References
Heermann P. D. and Khazenie N., 1992. Classification of multispectral remote sensing data using a back-propagation neural network, IEEE Transactions On Geosciences and Remote Sensing, 30(1): 81-88.
Atkinson P. M. and A. R. L. Tatnall, 1997. Neural network in remote sensing, International Journal of Remote Sensing, 18(4): 699-709.
Kasabov, K. N., 1996. Foundations of Neural Networks, Fuzzy Systems, and Knowledge Engineering, MIT Press, Cambridge, 550 p.
Baker J., 2000. New users and established experts: bridging the knowledge gap in interpreting commercial satellite imagery, Commercial Observation Satellites: At the Leading Edge of Global Transparency, RAND Corporation and American Society for Photogrammetry & Remote Sensing, Washington, in press.
Lulla, K. P. and L. V. Dessinov, 2000, Dynamic Earth Environments: Remote Sensing Observations from Shuttle-Mir Missions, New York: John Wiley & Sons, 268 p.
Benediktsson, J. A., Swan, P. H. and Ersoy O. K., 1990. Neural network approaches versus statistical methods in classification of multisource remote sensing data, I.E.E.E. Transactions on Geoscience and Remote Sensing, 28: 540-552. Benediktsson, J. A., and Sveinsson, J. R., 1997. Feature extraction for multisource data classification with artificial neural networks, International Journal of Remote Sensing, 18: 727-740. Civco, D. L., 1993. Artificial neural network for land cover classification and mapping, International Journal of Geographical Information System, 7: 173-186. Dehqanzada, Y. A. and A. M. Florini, 2000. Secrets for Sale: How Commercial Satellite Imagery Will Change the World, Carnegie Endowment for International Peace, Washington, 45 p.
Neural Ware, Inc., 1996. Using Neural Works, Neural Ware Inc., Pittsburgh, 157 p. Philipson, W. (1997). Manual of Photographic Interpretation. American Society for Photogrammetry & Remote Sensing, Bethesda, 830 p. Qiu F., 1999. Remote sensing image classification based on automatic fuzzy rule extraction by integrating fuzzy logic and neural network model’ Proceedings of ASPRS 1999 Annual Conference (CDROM), May 17-21, 1999, Portland, Oregon. Patterson, K., Jensen, J. R. and F. Qiu. 1998, Development of Improved Image Classification Algorithms to Extract Quantitative Urban/ Suburban Landuse/Land Cover Information from High Spatial Resolution Imagery, GEONEX, Inc., St. Petersburg, FL., 25 p. Rao, V. B. and H. V. Rao. 1993, C++Neural Network and Fuzzy Logic, Management Information, Inc., New York, NY, 408 p.
Estes, J. E. and J. R. Jensen, 1998. Chapter 10: Development of Remote Sensing Digital Image Processing and Raster GIS, The History of Geographic Information Systems: Perspectives from the Pioneers, Prentice-Hall, Inc., Saddle river, NJ, pp. 163-180.
Roli F., S. B. Serpico and Gianni Vernazza, 1996. Neural networks for classification of remotely sensed images, Fuzzy Logic and Neural Network Handbook, (C. H. Chen, editor), McGraw-Hill, Inc., New York, NY, pp. 15.1-15.28
Estes, J. E., Hajic, E. J. and L. R. Tinney, 1983. Chapter 24: Fundamentals of Image Analysis: Analysis of Visible and Thermal Infrared Data, Manual of Remote Sensing, American Society for Photogrammetry & Remote Sensing, Bethesda, pp. 987-1124.
Li, R., 1998. Potential of high-resolution satellite imagery for national mapping products, Photogrammetric Engineering & Remote Sensing, 64(12):1165-1169.
Foody, G. M., McCulloch, M. B., and Yates, W. B., 1995. Classification of remotely sensed data by an artificial neural network: issues related to training data characteristics, Photogrammetric Engineering and Remote Sensing, 61: 391-401.
28
Russell, S. and P. Norvig, 1995. Artificial Intelligence: A Modern Approach, Prentice-Hall, Inc., Upper Saddle River, 932 p.