Mar 19, 2002 - 2Department of Physics, Sri Venkateswara College, University of Delhi, New Delhi, India ... tion and control with potential medical applications.
A Neural Network Model for Apparent Deterministic Chaos in Spontaneously Bursting Hippocampal Slices B. Biswal1,2 and C. Dasgupta3,4 1
arXiv:cond-mat/0203384v1 [cond-mat.dis-nn] 19 Mar 2002
2
ICA1, University of Stuttgart, Pfaffenwaldring 27, D-70569 Stuttgart, Germany Department of Physics, Sri Venkateswara College, University of Delhi, New Delhi, India 3 Department of Physics, Indian Institute of Science, Bangalore - 560 012, India 4 Condensed Matter Theory Unit, JNCASR, Bangalore - 560 064, India (February 6, 2008)
A neural network model that exhibits stochastic population bursting is studied by simulation. First return maps of inter-burst intervals exhibit recurrent unstable periodic orbit (UPO)-like trajectories similar to those found in experiments on hippocampal slices. Applications of various control methods and surrogate analysis for UPO-detection also yield results similar to those of experiments. Our results question the interpretation of the experimental data as evidence for deterministic chaos and suggest caution in the use of UPO-based methods for detecting determinism in time-series data. 05.45.-a, 05.45.Gg, 05.45.Tp, 87.18.Sn
With recent advances in the theory of dynamical systems [1] and nonlinear time-series analysis [2], many recent studies have looked for signatures of deterministic chaos in brain dynamics [3]. This is expected to help in understanding brain functions in terms of the collective dynamics of neurons and in achieving short-term prediction and control with potential medical applications.
system and casts doubt on the interpretation of the experimental data as evidence for deterministic chaos. The neural network model we consider is based on one developed [10] for the process of “kindling” of epilepsy. The network consists of N excitatory neurons represented by the binary variables {Si }, i = 1, 2, ....., N , with Si = 0(1) corresponding to quiescent (firing) states. The inhibitory neurons are collectively modeled by a background inhibition assumed to be proportional to the instantaneous number of firing excitatory neurons. The “local field” hi (t) at the ith neuron at discrete time t is given by
An experiment [4] on spontaneously bursting rat hippocampal slices bathed in a high-potassium medium has elicited much interest [5–8] in this context. In this experiment, the occurrence of recurrent trajectories resembling unstable periodic orbits (UPOs) in the first return map of inter-burst intervals was interpreted as evidence for chaotic dynamics. Application of chaos control [9] was found to be more effective than periodic pacing in making the bursts regular. An anticontrol method designed to make the bursts more irregular was also tested with positive results. The apparent success of these control methods was interpreted as further evidence for the occurrence of deterministic chaos. However, in subsequent work [6], similar recurrent UPO-like trajectories were also observed in simulations of a stochastic singleneuron model and comparable success in chaos control and anticontrol was reported. Recent studies [7,8] in which surrogate methods are used to assess the statistical significance of UPOs claim to have re-established the original conclusion of deterministic chaos in hippocampal burst dynamics.
hi (t) =
N X
[{Jij Sj (t) − wSj (t)}
j=1
+λ{Kij Sj (t − τ ) − wSj (t − τ )}],
(1)
where w is the relative strength of inhibition, λ is the relative strength of the delayed signal, and τ is the time delay associated with the delayed signal. Starting from left, the four terms in Eq.(1) respectively represent fast recurrent excitation, fast global inhibition, slow recurrent excitation and slow global inhibition. These four ingredients are known [11] to be essential for modeling hippocampal dynamics. Time t is measured in units of “passes”, each pass corresponding to random sequential updating (RSU) of N neurons according to the rule: Si (t + 1) = 1 if hi (t) ≥ 0 and Si (t + 1) = 0 if hi (t) < 0. Initially a fixed number (q) of random low-activity patterns (“memories”) {ξiµ }, i = 1, 2, ....., N ; µ = 1, 2, ....., q, are stored in the synaptic matrices Jij and Kij through
We have developed and studied by simulations a simple but biologically plausible neural network model for hippocampal burst dynamics. While the variability of the inter-burst intervals in our model arises from stochastic transitions between two (quasi)attractors of the network dynamics, our simulations and surrogate analysis of the data yield results very similar to those reported [4,7,8] for the brain slice experiment. Our work, thus, suggests that our model is appropriate for describing the experimental
Ji6=j = Θ(
q X
µ=1
ξiµ ξjµ ), Ki6=j = Θ(
q X
ξiµ+1 ξjµ ),
(2)
µ=1
with ξiq+1 = ξi1 , Jii = Kii = 0, and Θ(m) = 1(0) for m > 0(m ≤ 0). The net activity of each mem1
20
(a)
Sup(t)
P(Tn)
(b)
P(Tn)
0 100 200
n
(c)
0.04
T7
10.0 0
1000
2000
3000
500 1000 1500 Tn (d)
0.2 0.15 0.1 0.05
0
500 1000 1500
0
0
500 1000 1500 Tn
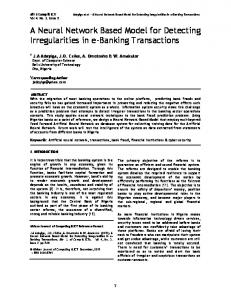
FIG. 2. (a) Autocorrelation of IBIs and sample IBI data in units of 102 passes (inset) for network 1 in the absence of control. (b)-(d) Probability distribution of IBIs from network (dotted line) and Poisson (dark triangle) simulations for no control (network 1, panel b), chaos control (network 6, panel c) and periodic pacing (network 6, panel d).
15.0 T5 T6
0
0.25
(c)
Tn
T4
0.1 0
0 5 10 15 20 25 30
0.06
0
T1 T2 T3
0.15 0.05
0.02
12.5
(b)
0.2
0.08
40 30 20 10 0
0.25
(a)
0.1
0
Ssm(t)
15 10 5 0
n
10
7.5
1 0.8 0.6 0.4 0.2 0 -0.2
Tn
C(Tn)
ever Ssm (t) remains continuously above the threshold for more than 20 passes. The variability of the IBIs in our simulation arises entirely from the stochasticity of the sequence in which the neurons are updated. If a “deterministic” scheme in which the neurons are always updated in a (randomly chosen) fixed sequence is used, then the network remains in the low-activity state for most choices of the sequence, and exhibits periodic transitions to the high activity attractor for certain rare sequences. Similar behavior is found for parallel updating where all the neurons are updated simultaneously. We note that the RSU scheme is the most appropriate one for modeling systems that do not have any “clock-like” mechanism.
P(Tn)
Sup(t)
P µ ory, i ξi , is set at a value p 1, the network evolution follows a limit cycle in which all the q memoriesP are visited sequentially with the net activity Sup (t) = N i=1 Si (t) showing a low-amplitude oscillation around the average value p [see Fig.1a]. To simulate the effects of the high-potassium medium, the network is “chemically kindled” through a Hebbian learning mechanism [10] switched on during 50 initial passes under reduced inhibition (w is reduced from 0.6 to 0.24). During this period, if Si = 1 and Sj = 1 more often than 6 times over 10 consecutive passes, then the fast synaptic connection Jij is permanently set to 1. Generation of these new excitatory synapses creates a new high-activity (“epileptic”) attractor of the network dynamics.
4000
t
We have studied 10 networks with different realizations of the memory states. As shown in the autocorrelation plot of Fig.2a, the IBIs are uncorrelated in time in all the networks. Further, the probability distribution of the IBIs follows a Poisson form, P (Tn ) ∝ exp(−aTn ), for Tn > 2tsm (this cutoff arises from our smoothening procedure) in all the networks [see Fig.2b]. These observations strongly suggest that the spontaneous transition of the network from the low-activity state to the highactivity one is a stochastic process that has a small probability p = 1 − exp(−a) of occuring at each time step. As shown in Fig.2b, the results of a Monte Carlo simulation of a Poisson process with probability p of occurrence at each time step are identical to those of network simulation. Results of our studies of the divergence of two trajectories starting from neighboring points in one- and two-dimensional delay embeddings of the IBI time-series
FIG. 1. (a) Network dynamics before kindling; (b) Kindled network dynamics with spontaneous bursting; (c) Smoothened network activity with spikes. Thresholds are denoted by dark circles and T1 , T2 , . . . are the IBIs.
The kindled network makes occasional, spontaneous, short-lived excursions to the high activity attractor [see Fig.1b], similar to the spontaneous population bursting observed in slice experiments. The net activity P is smoothened (“low-pass filtered”) to Ssm (t) = t 1 ′ t′ =t−tsm +1 Sup (t ), with tsm = 40. The bursts aptsm pear as “spikes” in the smoothened data and the interburst intervals (IBIs) are measured from positive threshold crossings [see Fig.1c]. To prevent very rare occurrences of persistent high activity, the network is reset to a randomly chosen low-activity memory state when2
duction of the inhibition strength w from 0.6 to 0.24 for 5 passes. Given a burst with IBI Tn−1 , the external stimulation is applied Tn = s1 (Tn−1 − T ∗ ) + T ∗ passes after the burst if no spontaneous burst occurs before its application. In periodic pacing (PP), the external stimulation is applied at fixed intervals of T ∗ irrespective of the occurrence of spontaneous bursts, and in demand pacing (DP), the external stimulation is applied T ∗ passes after a burst only if no spontaneous burst occurs prior to its application.
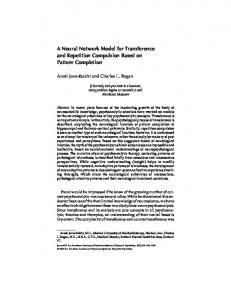
are consistent with the IBIs being independent random variables. Values of p for different networks exhibit a wide variation in the range 8 × 10⁻⁴ to 3 × 10⁻³ . Similar “sampleto-sample” variations and absence of correlations in the IBI time-series were reported in Ref. [12] for brain slices very similar to those of Ref. [4]. The variability in the raw IBI data of Ref. [12] is qualitatively similar to that in our simulation data [see inset of Fig.2a]. Although the bursting in our model is stochastic, first return maps of the IBIs show purely accidental occurrences [6] of UPO-like trajectories [4] that approach a fixed point (Tn = Tn−1 = T ∗ ) along a line, Tn − T ∗ = s1 (Tn−1 − T ∗ ) (the stable manifold) and then diverge away along another line, Tn − T ∗ = s2 (Tn−1 − T ∗ ) (the unstable manifold). In each of the 10 networks studied, many recurrent UPO-like trajectories that satisfy all the criteria adopted in [4] are found. Typical trajectories used to identify an apparent UPO and the associated manifolds are shown in Fig.3. . . . . . . .. . . . . . . . . . . . . . . . . . . .. . . . .. . .. . . . . .. . . . . .. . . .. . . .. . . . . . . . . . . . . . . .. . . . . .. . . . . . . . . . .. . . . . . .. . . . . . . . . . . . . .. . ... . . .. . .... . . . . . . . . .. . . . . . . . .. . .. .. . . . . .. . . . . . .. . . .. . ... . . . .. . . . . . .. . .. . . . . . . .. . .. .. .. . . . . . .. . . . . .. . . .. . . . . . . . .. . . . . . .. ... ... . .... . . . . . . . . .. . .. . .. . .. . . . . .. . ... . . . . . .. .. .. . . . .. .. . . .. .. . . . . . . ... . . . . . . . . .. .. .. .. . . . . . . . . . . .. . . . . . . . .. .. . . . . .... . . . .. . . . . . .. .. . . .. . .. ... ... .. ... . . ... .. . .. . . . . .. . . . .. . . . . . ... .. . . . .. . . .. . . . . . . . ..... . .... . .. . . . . . .. . . . .. . . . . . . .. . . . . . . . . . . . . ... . . .. . .. . .. .. .. . . . .. .. . .... .. ... . .. . . . . . . . .. . .. . . . . . .. . . . . . . . ..... ... ... .... . .... . ... ...... .. . . . . . ... . ... . . . .. .. . . . .. . . . . .... . .. ......... ........ .... . .. . .. . .... ... .. ... . . . . . . .. .. . . . .... ...... . .. .. .... .... . ........ .. . . .... . . .. . . . . .. . . .. .. . . . .. ... . . . . . . .. . . ........................... .. .......... .. ... ..... . . ... .. ..... .. .. ..... . .. . . . . . . . . . ... . . . . . .. .. . ... . .. . . . ........ ............ .............. .. ... .. ..... ....... .. . .... .. .. .. . . . .. .. . . . .. . . . . . .. . . . . . ....... .. . .. .... ...... .... ... . . ... ... ... . . . . .. . ... . .. . . . ... . . . .. . . .... .............. . .... .. . ... ...... .. ...... ... ....... ... ... . ..... .. . . .. . . . . . . . .. . . . . . . .
1000
Tn
800 600 400 200
1
0
0
200
1
400
600
800
1000
.
.
.. . .
.. . .
1. . . .
. .
..
1200
Tn-1
FIG. 3. Recurrent UPO-like trajectories in network 1. Three sequences (filled circles, squares and triangles, starting points denoted by 1) starting at different times around the same stable and unstable manifolds (dark lines) are shown.
1600
800 400 0
.
CC
.
PP
.
DP
. . . . . . . . . . . . . . .. . . . . . . . . .. . . . . .. . . . .. . . .. . . . . . . . .... . . .. . .. . .. . . . . .. . . . .. . . .. . ..... .... .... . .. .. . . ... . . ..... . . .. .. . .. . .. .. . . . ... .. .. ..... ... . . . . .. . . . . . . . . . . . . . . .. . ....... . . ..... ... ... . . ...... . . ... ... .. . . ... . . . . . .. .. . ... . . ...... .. . . .. . ... .................... .. . ....... . .... . . . ... .. . . ......... . ...................... . ... . .. .. ... .. ... ..................... .. . .... .... . . ... . .. .......... ...... ......... ........... ... .................. ... ......... ..... .................... ........... ..... ............ . ............ .. .... .......... .. .... ................. .............................. . .............. . ... ............. .. ........................... .. . . . . . .. .. . . .. ... . . . . ... ... . . . .. . . . . ... . . . . ..... .. . . .. .. . . . ... .... .. .. ... ... . . .. . .
0
(Tˆ )
Tn
1200
.
200 400 600 800 1000 1200 1400
n
5 4 3 2 1 0
(W)
1200
Typical results of the application of control, shown in Fig.4, are qualitatively similar to those reported in Ref. [4]. All three methods make the bursts more periodic by preventing the occurrence of large IBIs. While CC prevents the occurrence of natural IBIs above the stable manifold, PP and DP eliminate IBIs larger than T ∗ . This is why CC is effective when T ∗ is small and the slope s1 of the stable manifold is close to zero. In such cases, CC works better than PP because the occurrence of spontaneous bursts between two successive stimulations in PP increases the number of short IBIs. Since this does not happen in DP, this method yields the best results. For example, in network 1 for which the selected UPO, shown in Fig.3, has T ∗ = 225, s1 = −0.162, s2 = −4.8, the fraction of IBIs in the range T ∗ ± tsm , measured in 5000 IBI runs, is 0.17, 0.68, 0.52 and 0.69 for no control, CC, PP and DP respectively (the statistical error bars for these fractions are less than 0.01). Thus, CC and DP work better than PP (see Fig.4) in this case. The corresponding values for network 6, in which T ∗ = 937, s1 = −0.476, s2 = −1.68, are 0.03, 0.09, 0.21 and 0.4, indicating better performance of PP and DP over CC (see Figs.2c, 2d).
1.2 0.8 0.4 0
0 1 2 3 4 5 6
W 0
0.5
1.0
1.5
2.0
2.5
Tˆ
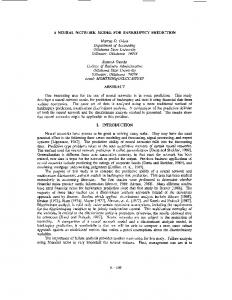
FIG. 5. The probability distributions ρ(Tˆ) (solid line) and ρ¯sur (Tˆ) (dots) for a 128-IBI dataset. Inset: the function Ξ(W ) used for estimating the statistical significance of UPOs. The arrow marks the maximum value of [ρ(Tˆ) − ρ¯sur (Tˆ)].
FIG. 4. Results of chaos control(CC), periodic pacing(PP), and demand pacing (DP) runs of 300 IBIs each in network 1. No control is applied during the intermediate periods of 150 IBIs. IBIs generated by external stimulation are denoted by stars.
Even when CC works well, 70-90% of the IBIs near T ∗ are actually generated by the stimulation (see Fig.4): the probability of occurrence of spontaneous IBIs near T ∗ is not significantly increased during control. A similar behavior in the experiment is suggested by the experimental observation [4] that intermittent applications of the external stimulation does not produce effective control. Increasing the strength of stimulation improves control in
Following Ref. [4], we have studied the effects of various control methods. In the Proportional Perturbative Feedback method of chaos control (CC) [13], the system point is repeatedly placed on the stable manifold of an UPO detected during a trial period withour control. This is done by generating bursts at appropriate times through external stimulation, modeled in our simulation by a re3
our simulations by preventing rare failures of the stimulation to generate the required burst. This is qualitatively similar to the results of double-pulse control in the experiment. The anticontrol method proposed in Ref. [4] fails if applied over long durations (∼ 1000 IBIs). In applications of smaller duration (∼ 100 IBIs), the variability of the IBIs increases in some cases due to statistical fluctuations. In the experiment, anticontrol was applied for short durations and failed in most cases. Our control results are similar to those reported in Ref. [6] for a stochastic single-neuron model. We have also simulated the effects of control on simple Poisson processes with p determined from the network data. The close agreement (see Figs.2c, 2d) between the network simulation results and those of our Poisson simulations firmly establishes the stochasticity of the bursting in our model. Recently, the statistical significance of UPOs in brain slice data has been examined [7,8] using surrogate analysis of windowed IBI datasets. These studies use a dynamical transformation [7] that maps the neighborhood of an UPO in the return map to the UPO itself. First, the IBI time-series {Tn } is transformed by Tn+1 − sn (k)Tn Tˆn = 1 − sn (k)
statistically significant UPO at 95% confidence level. In such analysis of many non-overlapping windows of small width from 10 networks (544, 272 and 136 windows of 32, 64 and 128 IBIs respectively), statistically significant (at the 95% confidence level) UPOs are found in 9 − 10% of the windows. The number of networks for which such statistically significant UPOs are present in at least one of the windows is 8, 10 and 5 for window size 32, 64 and 128, respectively. These numbers are very similar to those reported in Ref. [8]. Very similar results were found (e.g. 75 out of 1024 non-overlapping 32-IBI windows showing statisically significant UPOs for network 1) in a surrogate analysis using a two-dimensional delay embedding [7] and both overlapping and non-overlapping windows. Ref. [8] reports the detection of statistically significant UPOs of period higher than one in intracellular data which reflect a combination of collective and single-neuron dynamics. Our network with binary neurons is not appropriate for modeling such data. Nevertheless, a similar analysis of our IBI data is planned in future work. In conclusion, our neural network model with stochastic bursting dynamics successfully reproduces most of the findings of the brain slice experiment. This result casts doubt on the interpretation of the experimental data as evidence for deterministic chaos. Our work also shows that determinism and stochasticity need not be mutually exclusive: the evolution of our network in the lowand high-activity states is mostly deterministic, while the transitions between these two states are stochastic. We thank Dr. G. R. Ullal for useful discussions.
(3)
where sn (k) = [(Tn+2 − Tn+1 )/(Tn+1 − Tn )] + k(Tn+1 − Tn ). The probability distribution ρ(Tˆ) of the transformed time-series {Tˆn } is expected to show a sharp peak at an UPO, Tˆ = T ∗ . Spurious peaks are eliminated [7] by averaging over many random values of k. Using many realizations of Gaussian-scaled phase-shuffled surrogates [14] of the original time-series, the probability that the observed peaks in ρ(Tˆ) could be modeled by the surrogates is estimated in the following way. From the collection of {ρsur (Tˆ)}, the ensemble average ρ¯sur (Tˆ) is obtained. The deviation of ρsur (Tˆ) for a particular surrogate from the mean ρ¯sur (Tˆ) is measured by w(Tˆ) = ρsur (Tˆ) − ρ¯sur (Tˆ).
[1] D. Kaplan and L. Glass, Understanding Nonlinear Dynamics (Springer, Berlin, 1998) [2] H. Kantz and T. Schreiber, Nonlinear Time Series Analysis (Cambridge University Press, Cambridge, 1997) [3] Nonlinear Dynamics and Brain Functions, ed. P. E. Rapp, N. Pradhan and R. Sreenivasan (Nova Science Publishers, New york, 2000). [4] S. J. Schiff et. al., Nature 370, 615 (1994). [5] J. Glanz, Science 265, 1174 (1994); ibid 277, 1758 (1997). [6] D. J. Christini and J. J. Collins, Phys. Rev. Lett. 75, 2782 (1995); Chaos 7, 544(1997). [7] P. So et. al., Phys. Rev. E 55, 5398 (1997). [8] P. So et. al., Biophys. Journal 74 2776 (1998). [9] E. Ott, C. Grebogi and J. A. Yorke, Phys. Rev. Lett. 64, 1196 (1990). [10] M. R. Mehta, C. Dasgupta and G. R. Ullal, Biol. Cybern. 68, 335 (1993). [11] R. D. Traub, R. Miles and J. R. Jefferys, J. Physiology 461, 525 (1993). [12] S. J. Schiff et. al., Biophys. Journal 67, 684 (1994). [13] A. Garfinkel et. al., Science 257, 1230 (1992). [14] J. Theiler et. al., Physica D 58, 77 (1992).
(4)
For each of the surrogates, W = max(w(Tˆ)) is measured and the fraction Ξ(W ′ ) of surrogates with maximum deviation W > W ′ is found. The statistical significance of a candidate UPO at Tˆ ∗ is estimated from the value of Ξ(W ) at W = ρ(Tˆ ∗ ) − ρ¯sur (Tˆ∗ ). In our analysis, we used 100 surrogates, k = 5R where R is a random number in [1, −1], and 500 values of R. We find that this method successfully rejects the UPO-like trajectories found in the network IBIs (properly rescaled to match the analysis of Ref. [7]) only for long datasets (> 1024 IBIs), but not for shorter datasets (windows). Results for a typical 128-IBI window with a “statistically significant” UPO are shown in Fig.5. In this case, the probability of finding the peak of ρ(Tˆ) (near Tˆ = 0.5, with W = 3.437) in the surrogates is close to 4%, leading to the (false) identification of a 4