big data and cognitive computing
Article
A Neural Network Propagation Model for LoRaWAN and Critical Analysis with Real-World Measurements Salaheddin Hosseinzadeh 1 , Mahmood Almoathen 2 , Hadi Larijani 1, * 1 2
*
ID
and Krystyna Curtis 1
School of Engineering and Built Environment, Glasgow Caledonian University, Glasgow G4 0BA, UK;
[email protected] (S.H.);
[email protected] (K.C.) Computer Technology Department, Qatif College of Technology, Al Qatif 32636, Saudi Arabia;
[email protected] Correspondence:
[email protected]
Received: 8 October 2017; Accepted: 9 December 2017; Published: 14 December 2017
Abstract: Among the many technologies competing for the Internet of Things (IoT), one of the most promising and fast-growing technologies in this landscape is the Low-Power Wide-Area Network (LPWAN). Coverage of LoRa, one of the main IoT LPWAN technologies, has previously been studied for outdoor environments. However, this article focuses on end-to-end propagation in an outdoor–indoor scenario. This article will investigate how the reported and documented outdoor metrics are interpreted for an indoor environment. Furthermore, to facilitate network planning and coverage prediction, a novel hybrid propagation estimation method has been developed and examined. This hybrid model is comprised of an artificial neural network (ANN) and an optimized Multi-Wall Model (MWM). Subsequently, real-world measurements were collected and compared against different propagation models. For benchmarking, log-distance and COST231 models were used due to their simplicity. It was observed and concluded that: (a) the propagation of the LoRa Wide-Area Network (LoRaWAN) is limited to a much shorter range in this investigated environment compared with outdoor reports; (b) log-distance and COST231 models do not yield an accurate estimate of propagation characteristics for outdoor–indoor scenarios; (c) this lack of accuracy can be addressed by adjusting the COST231 model, to account for the outdoor propagation; (d) a feedforward neural network combined with a COST231 model improves the accuracy of the predictions. This work demonstrates practical results and provides an insight into the LoRaWAN’s propagation in similar scenarios. This could facilitate network planning for outdoor–indoor environments. Keywords: LoRaWAN; LPWAN; propagation analysis and modeling; feedforward neural networks; COST231 multi-wall model
1. Introduction The low-power wide-area network technology has several advantages, such as low price and low power consumption. LoRa and SigFox are two of the main Internet of Things (IoT) Low-Power Wide-Area Network (LPWAN) technologies [1]. LoRa has more advantages, in addition to having a low power consumption and long range of coverage. One of its features is a proprietary chirp spread spectrum (CSS) modulation, which is resistant to interference and the Doppler effect [2]. The CSS modulation also improves the sensitivity of the device and increases the overall available link budget [3]. It is also internet protocol version 6 (IPv6) compatible; hence, it is capable of providing better security, scalability, and end-to-end connectivity [2,4]. Unlike SigFox, the LoRa alliance is not an IoT network provider; therefore, no subscription is required, and there are no uplink or downlink restrictions regarding the number of messages per day [5–7]. The aforementioned advantages made LoRa favorable for the purpose of this research. Currently, Semtech is the main manufacturer of LoRa modules. LoRa commonly refers to a physical layer using the CSS, and LoRaWAN is an open standard Big Data Cogn. Comput. 2017, 1, 7; doi:10.3390/bdcc1010007
www.mdpi.com/journal/bdcc
Big Data Cogn. Comput. 2017, 1, 7
2 of 10
Media Access Control (MAC) layer protocol developed by the LoRa Alliance, which allows end devices to gateway communication. The outdoor propagation of LoRa and LoRaWAN has been studied in [8–14]. These studies were mainly focused on the: (a) coverage range of line of sight (LoS), (b) signal strength in central business districts, and (c) impact of modulation spreading factor on its propagation. The propagation ranges in these studies are therefore reported from two to 20 km, which is much lower than 50 km [15]. There have been a few studies where point-to-point LoRa communication has been investigated in indoor environments for the purpose of network sensor implementation [16,17]. In this study, an outdoor–indoor scenario is investigated with an end-to-end connection, to observe the structural penetration of LoraWAN and its gateway. Therefore, practical measurements were collected, analyzed, and compared against common propagation models. These models include a log-distance, COST231 Multi-Wall Model (MWM). In addition to these models, artificial neural network (ANN) models are used to estimate the propagation. Since hybrid models are based on an ANN, they are capable of learning the propagation. Learning is achieved through a training process, where the ANN is exposed to sets of input–output parameters. ANN models are more accurate and less computationally demanding compared with non-deterministic and deterministic models, respectively [18]. However, one disadvantage of the ANN models is that they require a considerable amount of data collection over a vast area for the purpose of training, validation, and testing. For instance, in [19], 600,000 indoor data samples were collected, and learning took several hours. Authors in [18–25] used ANNs to predict the propagation in indoor environments. In these studies, the main ANN inputs were the: distance between transceivers, number of walls, number of doors, number of windows, frequency of transmission, antenna gains, and even transmission power. However, two of the authors [20,22] used “free space path attenuation” as a single input. This is an intuitive preprocessing of two individual inputs of distance and frequency, by taking advantage of the free space path loss formula. This approach (a) reduces the number of inputs to the ANN, which should help the learning by reducing the number of parameters; (b) makes the network needless of learning the basic propagation principles, such as calculating space path loss. A similar approach can also be applied to unify all of the attenuating factors such as the number of walls, windows, and doors or transmission power and antenna gain, which can form the effective radiated power. In these studies, the ANN had the responsibility of inferring the relations between the propagation parameters. This in turns requires comprehensive training with several measurements. However, not only collecting several measurements in a relatively small indoor environment can be tedious, but it also defeats the purpose of estimation. To facilitate data collection and yet also be able to improve predictions, COST231 is utilized as the first stage of modeling, where its results were used to train the ANN toward acquiring better estimations. We therefore did not directly use these physical parameters to train the ANN. This article is arranged as follows: in Section 2, the measurement setup and data collection are explained; Section 3 explains the modeling and the optimization; Section 4 demonstrates the results; and Section 5 concludes the outcomes of this research. 2. Data Collection Setup The mobile device used during the measurement was comprised of a Multitech mDot module [26], which is controlled by a Raspberry pi single board computer. The Kerlink gateway was equipped with LoRa SX1301, a mobile network, and microprocessors [27]. The gateway was located on the rooftop of the George Moore Building at Glasgow Caledonian University (GCU), which is about 27 m high. The mobile device was configured to regularly transmit and receive a sequentially increasing message. This sequential increment also helped to identify any lost messages during the data analysis. Data was collected on the eighth and seventh floor of the Hamish Wood Building at GCU, which has a height of 27 m, length of 60 m, and width of 22.5 m. To cover the entire building, the mobile device
Big Data Cogn. Comput. 2017, 1, 7 Big Data Cogn. Comput. 2017, 1, 7
3 of 10 3 of 10
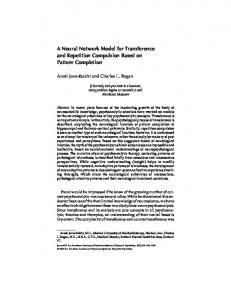
the mobile device was moved to several different locations inside the building. The equivalent isotropic radiation power and frequency of transmission were dBm and isotropic 867.1 MHz, respectively. was moved to several different locations inside the building. The14equivalent radiation power Other configurations were a spreading factorand of nine, bandwidth of 125 Other kHz, and antenna gains of and frequency of transmission were 14 dBm 867.1aMHz, respectively. configurations were Big Data Cogn. Comput. 2017, 1, 7 3 of 10 2 dBi. Nearly 10 received signal strength indicators (RSSI) were collected at each location. These RSSI a spreading factor of nine, a bandwidth of 125 kHz, and antenna gains of 2 dBi. Nearly 10 received values were on the server and locally onthethe mobile device. Figure signal strength indicators were collected at each location. These RSSI valuesThe were logged both1 the mobilelogged device both was(RSSI) moved to network several different locations inside building. equivalent demonstrates the test environment. isotropic radiation power and frequency of transmission were 141dBm and 867.1 MHz, respectively. on the network server and locally on the mobile device. Figure demonstrates the test environment. Other configurations were a spreading factor of nine, a bandwidth of 125 kHz, and antenna gains of 2 dBi. Nearly 10 received signal strength indicators (RSSI) were collected at each location. These RSSI values were logged both on the network server and locally on the mobile device. Figure 1 demonstrates the test environment.
Figure University (GCU). (GCU). Figure 1. 1. Studied Studied environment environment at at Glasgow Glasgow Caledonian Caledonian University
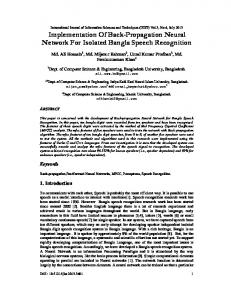
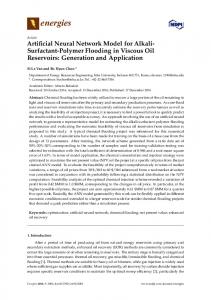
The internal structure of the eighth floor is presented in Figure 2. The mobile LoRaWAN Figure 1. Studied at Glasgow Caledonian The internal structure of theenvironment eighth floor is presented in University Figure 2.(GCU). The mobile LoRaWAN transceiver was moved to sampling locations marked from 1 to 27 to cover the entire area, and the transceiver was moved to sampling locations marked from 1 to 27 to cover the entire area, and averagedThe RSSI was calculated location. location numbers andmobile averaged RSSIs are internal structure ofattheeach eighth floor is The presented in Figure 2. The LoRaWAN the averaged RSSI was calculated at each location. The location numbers and averaged RSSIs are transceiver was 2, moved tothey sampling locations marked from 1There to 27 to cover entire and the indicated in Figure where are separated by a comma. are alsothe a total ofarea, 43 walls on each indicated in Figure 2, where they are separated by aThe comma. There are also a total of 43RSSIs walls are on each averaged RSSI was calculated at each location. location numbers and averaged floor; however, most of the walls along the width of the building were not blocking the LoS due to floor;indicated however, most of walls along the width the building were not blocking theon LoS due to in of Figure 2, the where theygateway. are separated aof comma. There are alsoon a total 43 walls each the positioning the LoRaWAN The by gateway was mounted the of rooftop of the George the positioning of the LoRaWAN gateway. The gateway was mounted onblocking the rooftop of the George floor; however, most of the walls along the width of the building were not the LoS due to Moore Building, which is 55 m away from the first obstructing wall, that is indicated by a theBuilding, positioning of theisLoRaWAN gateway was mounted on is theindicated rooftop ofby the Moore which 55 m awaygateway. from theThe first obstructing wall, that a George dashed-line dashed-line in Figure 2. Moore Building, which is 55 m away from the first obstructing wall, that is indicated by a in Figure 2. dashed-line in Figure 2.
Figure Indoor structural layout ofofeighth sampling locations, their corresponding Figure 2. Indoor structural layout eighth floor, sampling locations, andand their corresponding Figure 2.2.Indoor structural layout of eighth floor,floor, sampling locations, and their corresponding received received signal strength indicators (RSSI). received signal strength indicators (RSSI). signal strength indicators (RSSI).
3. Propagation Modeling 3. Propagation Modeling 3. Propagation Modeling All of the models were optimized by using the collected practical measurements. This was done All of the models were optimized by using the collected practical measurements. This was done All of the optimized by using of thethe collected practical measurements. This was done in order to models find the were propagation characteristics environment and benchmark the performance in order to find the propagation characteristics of the environment and benchmark the performance of the LoRaWAN. The models used in this were log-distance, the indoor COST231 in order to find the propagation characteristics of research the environment and benchmark the performance of of the LoRaWAN. The models variation used inofthis research and were log-distance, the indoor COST231 (multi-wall) model, a proposed the COST231, the hybrid is comprised the LoRaWAN. The models used in this research were log-distance, the model, indoorwhich COST231 (multi-wall) (multi-wall) model, aCOST231 proposed variation of the COST231, and thediscussed hybrid model, which is comprised of the alternated These models arehybrid briefly in this section. model, a proposed variationand of an theANN. COST231, and the model, which is comprised of the of the alternated COST231 and an ANN. These models are briefly discussed in this section. alternated COST231 and an ANN. These models are briefly discussed in this section.
Big Data Cogn. Comput. 2017, 1, 7
4 of 10
3.1. Log Distance Log distance is a commonly used model for both indoor and outdoor environments. It has a few parameters to characterize the propagation, and therefore, it is relatively easy to implement. Although it lacks the accuracy of sophisticated models, it is not computationally demanding [28]. The log-distance model is presented in Equation (1) [29]. PL = PLd0 + 10 n log (
d ) + Xg d0
(1)
where PL is the path loss (dB), d is the distance (meter) between the transceivers, n is the path loss exponent, Xg is the shadow fading with mean (µ) zero and standard deviation σ (dB), and PLd0 is the loss at a reference distance (usually 1 m) from the transmitter. 3.2. COST231 One of the frequently used propagation models for indoor environments is the COST231, which is formulated in Equation (2) [30]. Implementation of this model is presented in [31,32]. Unlike the log-distance model, the COST231 model requires site-specific information, such as the layout of the indoor environment; as a result, it offers better accuracy [33]. PL = L FS (d) + LC + ∑ α j k j
(2)
where LC is the constant loss (dB), L FS (d) is the free space path loss at distance d between transceivers, and α j and k j are the attenuation coefficient and the number of walls of type j between the LoS. 3.3. Adjusted COST231 The testing environment in this research consists of both indoor and outdoor propagation. Whereas the COST231 model is only intended for indoor modeling, as it has an optimistic space path loss prediction, it only accounts for the free space loss. Hence, we made an adjustment to the COST231 model to account for the outdoor propagation parameters. Since this adjustment is inspired by the log–distance model, we added a path loss exponent (n A231 ) to the free space path loss (L FS ). This adjusted model is presented in Equation (3). All of the other parameters in Equation (3) are defined similar to Equation (2). PL = n A231 × L FS (d) + LC + ∑ α j k j (3) 3.4. Optimization Since there are multiple locations on each floor at which the RSSI is measured, a multi-objective min–max optimization is used to find the optimum model parameters. For the log-distance model, the overall fading (Xgi ) at each location (i) is optimized as an independent variable. Constant loss (L E ) is also added to the optimization functions, which compensates for any possible additional losses in the system such as cable loss, antenna mismatch, or polarization mismatch. Therefore, L E and n/n A231 are not changing in any of the objective functions. The overall form of the objective functions and their constraints are formulated for the log-distance model in Equation (4). Where Mi is the summation of transmission power, antenna gains, and the measured RSSIi at location ith (Mi < 0). A similar optimization is also applied to COST231 and its adjusted variation, except Fi in the adjusted COST231 is a function n A231 , LC and α j .
1≤n≤8 min max Fi (n, Xgi , L E ) −20 ≤ L E ≤ 20 n,Xgi ,L E Fi −20 ≤ X ≤ 20 gi Fi (n, Xgi , L E ) = − PL0 − Mi − L E − 10n × log (d) − Xgi
(4)
Big Data Cogn. Comput. 2017, 1, 7
5 of 10
Big Data Cogn. Comput. 2017, 1, 7
5 of 10
3.5. Artificial Neural Network 3.5. Artificial Neural Network The feedforward neural network model consists of an input layer, two hidden layers, and an The feedforward neural network model consists of an input layer, two hidden layers, and an output layer. The five inputs of the network are: output layer. The five inputs of the network are:
•• •• •• ••
Total ∑ k j )) Totalnumber numberof ofwalls wallsblocking blockingthe theLoS LoS((∑ Total attenuation caused by the blocking ∑ α j k j )) Total attenuation caused by the blockingwalls walls((∑ Attenuation )) Attenuation caused caused by by distance distance and and loss loss exponents exponents(n ( A231 × × L FS((d)) Set Set of of (x ( i ,, yi )) coordinates coordinates to tospecify specifythe themeasurement measurementlocation locationinside insidethe thebuilding building
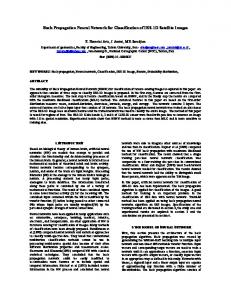
The first firstand andsecond second hidden layers consist of seven and neurons, three neurons, respectively. The The hidden layers consist of seven and three respectively. The number number of layers and the size of each layer were heuristically found to avoid overfitting, while of layers and the size of each layer were heuristically found to avoid overfitting, while generalizing generalizing The of only of the network is the error theoroptimized or best the problem. the Theproblem. only output theoutput network is the error between the between optimized best estimate of estimate of the adjusted COST231 ( measured ) and the measured RSSI. functions The transfer functions are the adjusted COST231 model (FA231model ) and the RSSI. The transfer are linear for the linear for thelayer, first hidden layer, and hyperbolic tangent [34] forand thethe second andlayer. the output first hidden and hyperbolic tangent sigmoid [34] sigmoid for the second output Also, layer. Also, the Levenberg–Marquardt backpropagation algorithm [34] is used for training. An the Levenberg–Marquardt backpropagation algorithm [34] is used for training. An overall schematic overall schematic of this implemented network in MATLAB R2016b is depicted in Figure 3, where of this implemented network in MATLAB R2016b is depicted in Figure 3, where “w” and “b” are “w” and “b” indicating the weights biases of each layer of neurons, respectively. indicating theare weights and biases of eachand layer of neurons, respectively.
Figure 3. 3. Schematic Schematic of of the the implemented implemented neural neural network network in in MATLAB. MATLAB. Figure
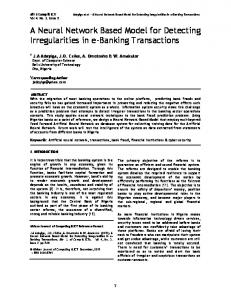
4. Data Data Analysis Analysis Result Result 4. The model model parameters parameters that that are are derived derived from from the the optimization optimization identify identify the the characteristics characteristics of of the the The LoRaWAN propagation. LoRaWAN propagation. 4.1. Log-Distance 4.1. For the the log-distance log-distance model parameters, the path loss exponent ((n)) derived as 3.9, and L E was was For found as 3.4 dB. The mean and standard deviation of shadow fading ( ) were found as = 0.25 found as 3.4 dB. The mean and standard deviation of shadow fading (Xg ) were found as µ = 0.25 and 6.8respectively. dB, respectively. These extracted parameters the propagation in with an “office σand = 6.8=dB, These extracted parameters resembleresemble the propagation in an “office hard with hard partitions” 1.5ItGHz [35]. It isto necessary to emphasize that were theseconducted tests were at conducted partitions” at 1.5 GHz at [35]. is necessary emphasize that these tests 867 MHz.at 867 MHz. 4.2. COST231 4.2. COST231 For COST231 models, 25 of the walls that are aligned parallel to the LoS (west to east orientation) are not in the optimization, as they notare blocking theparallel LoS. Thetoconstant is found as Forinvolved COST231 models, 25 of the wallsare that aligned the LoSloss (west to east Lorientation) attenuations of the walls in Figure Attenuations ranged areThe noteffective involved in the optimization, as (α they areplotted not blocking the4.LoS. The constant loss c = 17.32 dB. i ) are from 12.79asto 1 dB. ThesedB. attenuations were mainly in agreement with values reported in [36]. is found = 17.32 The effective attenuations of the walls ( the ) are plotted in Figure 4. However, k , which is the first penetrating external wall and has several large windows, has a relatively Attenuations 1 ranged from 12.79 to 1 dB. These attenuations were mainly in agreement with the much attenuation dB) compared other walls. Thisexternal is further investigated below. valueshigher reported in [36]. (12.79 However, , which with is thethe first penetrating wall and has several large windows, has a relatively much higher attenuation (12.79 dB) compared with the other walls. This is further investigated below.
Big Data Cogn. Comput. 2017, 1, 7
6 of 10
Big Data Cogn. Comput. 2017, 1, 7
6 of 10
Big Data Cogn. Comput. 2017, 1, 7
6 of 10
4. Comparison of wall attenuations for both the COST231 model and its adjusted variation. Figure 4.Figure Comparison of wall attenuations for both the COST231 model and its adjusted variation.
4.3. Adjusted COST231
4.3. Adjusted COST231
Since the measurement was conducted in an outdoor–indoor environment, a considerable part
of the propagation was was outdoors. Therefore, a both similar path lossmodel exponent ) was to the part 4. Comparison of wall attenuations the COST231 and its( adjusted variation. Since theFigure measurement conducted inforan outdoor–indoor environment, a added considerable COST231 indoor to account for the outdoor propagation For the(nadjusted model, the to the of the propagation wasmodel outdoors. Therefore, a similar path losslosses. exponent ) was added A231 4.3. Adjusted constant lossCOST231 was found as = 4.1 dB, and path loss exponent = 2.4. Attenuation of the COST231 indoor model to account for the outdoor propagation losses. For the adjusted model, the walls for both the COST231 was and conducted the adjusted are depicted and comparedainconsiderable Figure 4. Forpart the measurement inmodel anloss outdoor–indoor constant lossSince wasthe found as Lc = 4.1 dB, and path exponent nenvironment, A231 = 2.4. Attenuation of the walls adjusted model, these attenuations are range from 1 dB to 8 dB. the propagation was outdoors. Therefore, a similar path loss exponent ( ) was added to the for bothofthe COST231 and the adjusted model are depicted and compared in Figure 4. For the adjusted COST231 indoor model to account for the outdoor propagation losses. For the adjusted model, the 4.4. Hybrid Model model, these attenuations are range=from 1 dB to 8 dB. constant loss was found as 4.1 dB, and path loss exponent = 2.4. Attenuation of the walls Since for both COST231 and the model adjusted model are and compared in Figure 4. For the thethe adjusted COST231 produced a depicted more realistic and accurate estimation, its
4.4. Hybrid Model adjusted model, theseas attenuations arethe range from 1 dB toThe 8 dB. parameters are used the inputs of neural network. total number of the LoS-blocking walls
is extracted automatically during the execution of a themore COST231 model.and However, the estimation, total Since the adjusted COST231 model produced realistic accurate 4.4. Hybrid Model attenuation of these walls are identified after the optimization of the COST231 model, which serves its parameters are used as the inputs of the neural network. The total number of the LoS-blocking as the second input to the ANN. The thirdproduced input is also calculated afterand the accurate optimization of the path Since the adjusted COST231 model a more estimation, its walls is loss extracted automatically during the execution of therealistic COST231 model. However, the total exponent = 2.4, which is a fixed parameter, while ( ) is changing from one location parameters are used as the inputs of the neural network. The total number of the LoS-blocking walls attenuation of these walls arethe identified after the the COST231 which another. To consider spatial influence of optimization theofbuilding onofpropagation, suchmodel, as fixtures and serves isto extracted automatically during the execution the COST231 model. However, the total other clutter that is not included in the model, the fourth and fifth inputs are the position of the as the second input to the ANN. The third input is also calculated after the optimization of the path attenuation of these walls are identified after the optimization of the COST231 model, which serves measurement locations inside the building. This ( , ) pair is also extracted from the blueprint loss exponent n = 2.4, which is a fixed parameter, while L ( d ) is changing from one location to as the second A231 input to the ANN. The third input is also calculated FS after the optimization of the path image of the COST231 model automatically. The schematics of the hybrid model during and after = 2.4, which is a fixed parameter, while ( ) is changing from one location another.loss To exponent consider the spatial influence of the building on propagation, such as fixtures and other theanother. trainingTo areconsider depictedthe in Figure 5a,b, respectively. to of the on propagation, such asoffixtures and clutter that is not included in the spatial model,influence the fourth andbuilding fifth inputs are the position the measurement clutter that is not included in the model, the fourth and fifth inputs are the position of the locationsother inside the building. This (xi , yi ) pair is also extracted from the blueprint image of the COST231 measurement locations inside the building. This ( , ) pair is also extracted from the blueprint model automatically. The schematics of the hybrid model during and after the training are depicted in image of the COST231 model automatically. The schematics of the hybrid model during and after Figure 5a,b, respectively. the training are depicted in Figure 5a,b, respectively. (a)
(b)
Figure 5. Flowchart of the hybrid model, (a) depicting the model input/output during the training; (b) demonstrating the input/output after the artificial neural network (ANN) is trained.
(a) (b) The network is then trained using all of the collected data on the eighth floor. Implementing the ANN with the adjusted COST231 assistance drastically facilitated the training process and yet Figure 5. Flowchart the hybrid model, depicting the input/output during the training; Figure 5. Flowchart of theofhybrid model, (a)(a)depicting themodel model input/output during the training; increased the accuracy of the prediction. The desired output of the network was the difference (b) demonstrating the input/output after the artificial neural network (ANN) is trained. (b) demonstrating the input/output the artificial neural (ANN) trained. between the optimized adjusted after COST231 prediction ( network ) and the RSSI ismeasurement on the eighth floor; in other words, = − . Therefore, the only responsibility of the network The network is then trained using all of the collected data on the eighth floor. Implementing the was to discern the trained deficiencies ofassistance the adjusted COST231 model, rather than process learn whole TheANN network is then using all of the collected data onthe thetraining eighth floor.the Implementing with the adjusted COST231 drastically facilitated and yet increased theadjusted accuracy of the prediction. The desired outputfacilitated of the network was the process differenceand yet the ANN with the COST231 assistance drastically the training between the optimized adjusted COST231 prediction ( of) the andnetwork the RSSIwas measurement on thebetween increased the accuracy of the prediction. The desired output the difference eighth floor; in other words, = − . Therefore, the only responsibility of the network the optimized adjusted COST231 prediction (FA231 ) and the RSSI measurement on the eighth floor; in was to discern the deficiencies of the adjusted COST231 model, rather than learn the whole other words, E A231 = RSSI − FA231 . Therefore, the only responsibility of the network was to discern the deficiencies of the adjusted COST231 model, rather than learn the whole propagation mechanism. For the seventh floor, the ANN made an estimation (TENN ) of the adjusted COST231 error (E A231 ),
DataComput. Cogn. Comput. Big DataBig Cogn. 2017,2017, 1, 7 1, 7
7 of 10 7 of 10
propagation mechanism. For the seventh floor, the ANN made an estimation (
) of the adjusted
), which is depicted in Figureboth 6a. Figure 6b comparesestimations both of the optimized error which COST231 is depicted in (Figure 6a. Figure 6b compares of the optimized of the adjusted estimations theassisted adjustedANN COST231 ( (F) and+assisted ANNthe models ( + ) with the(RSSI). COST231 (FA231 ) of and models T ) with practical measurements ENN A231 (RSSI). This is further explained in the discussion. This ispractical further measurements explained in the discussion.
(a)
(b)
(a) Comparison between COSTerror error (E ( A231) )and ANN estimation of the error error FigureFigure 6. (a) 6. Comparison between thethe COST andthe the ANN estimation ofCOST the COST (b) Comparison between measurement of received the received signal strength indicators (RSSI), (TENN )(; (b) ); Comparison between measurement of the signal strength indicators (RSSI), COST’s ), and compensated COST by ANN. COST’s optimized(Festimation ( compensated optimized estimation ), and COST by ANN. A231
5. Discussion
5. Discussion
After optimization, the resulted mean square errors (MSE) for the log-distance, COST231, and
After optimization, resulted errors (MSE) the log-distance, COST231, the adjusted COST231the models were mean derivedsquare as 45, 20.47, and 21.83,for respectively. As expected, the log and –distance model did not have thederived accuracyas of 45, the 20.47, site-specific models. For the COST231 model and the adjusted COST231 models were and 21.83, respectively. As expected, the log its adjusted variants, the difference in the MSE was almost negligible, and they performed the same –distance model did not have the accuracy of the site-specific models. For the COST231 model and its in terms of propagation estimation. adjusted variants, the difference in the MSE was almost negligible, and they performed the same in It is observed that the major difference between the results of COST231 and its adjusted terms of propagation estimation. variation was the attenuation coefficient of the first penetrating wall ( ). The COST231 model did Itnot is observed that the major difference between the results of COST231 and its adjusted variation sufficiently account for the outdoor losses. However, this deficiency was compensated within was thethe attenuation coefficient of the penetrating wall diddB). notThis sufficiently 1 ). The COST231 optimization by increasing thefirst attenuation of the first(apenetrating wall ( model = 12.79 is account for the deficiencyobjective was compensated the optimization because theoutdoor was losses. present However, in all of thethis optimization functions. In within the adjusted model, however,the outdoor loss compensation handled bywall the (α1 ==12.79 2.4; therefore, resulting in a lower by increasing attenuation of the firstwas penetrating dB). This is because the α1 was value of of the = 5.10 dB compared with thefunctions. COST231 model. lower model, , whichhowever, was derived from loss present in all optimization objective In theThe adjusted outdoor the adjusted model, is a better and more reasonable estimate, because the wall had plenty compensation was handled by the n A231 = 2.4; therefore, resulting in a lower value of α1 = of 5.10 dB large windows that should have facilitated the penetration [37–41]. This effect is clear at compared with the COST231 model. The lower α1 , which was derived from the adjusted model, is a measurement location 13, which had the highest RSSI recorded (see Figure 2). Despite better and more reasonable estimate, because the wall k1 had plenty of large windows that should increasing the outdoor loss by a factor of 2.4, none of the other attenuations were altered to a great have facilitated penetration [37–41]. effect isthat clear measurement which had the extent to bethe noticeable, which further This emphasized it isatonly adjusting thelocation outdoor 13, propagation. highestInRSSI recorded (see Figure 2). Despite n increasing the outdoor loss by a factor of= 2.4, addition, according to the documented empirical coefficients [35], the path loss of 2.4 none A231 of the resembled other attenuations were at altered to aThis great extent tonot be only noticeable, which further emphasized the propagation 900 MHz. adjustment corrected the attenuation of the penetrating wall and the LoS,propagation. but has also identified the propagation This simple that it first is only adjusting the outdoor In addition, accordingcharacteristics. to the documented empirical adjustment in the COST231 more applicable to an outdoor–indoor scenario. coefficients [35], the path loss ofmodel n A231made = 2.4it resembled the propagation at 900 MHz. This adjustment The introduced coefficient ( in the adjusted COST231 model correctly represented the not only corrected the attenuation of the )first penetrating wall and the LoS, but has also identified the propagation characteristics of LoRaWAN in an outdoor LoS condition; however, the log-distance propagation characteristics. This simple adjustment in the COST231 model made it more applicable to path loss exponent ( = 3.6) and = 6.8 demonstrated a notable loss, as the LoRa encountered an outdoor–indoor scenario. obstacles on the propagation path into the building. This susceptibility of LoRa resulted in the The introduced coefficient (n A231 ) in the adjusted COST231however, model correctly represented parameters that indicated the propagation in indoor environments, at the frequency of 1.5 the propagation characteristics of LoRaWAN in an outdoor LoS condition; however, the log-distance GHz instead of 860 to 900 MHz. The = 4.1 dB is nearly in an agreement with the = 3.4 dB; path loss exponent (n = 3.6) and σ = 6.8 demonstrated a notable loss, as the LoRa encountered obstacles on the propagation path into the building. This susceptibility of LoRa resulted in the parameters that indicated the propagation in indoor environments, however, at the frequency of 1.5 GHz instead of 860 to 900 MHz. The Lc = 4.1 dB is nearly in an agreement with the L E = 3.4 dB; these parameters were added to the COST231 and log-distance models respectively to account for any potential losses in the system.
Big Data Cogn. Comput. 2017, 1, 7
8 of 10
Generally, the training of an ANN requires a large set of inputs–outputs. For propagation estimations, this translates to numerous measurements at different locations. For a relatively small indoor environment, this defeats the purpose of propagation estimation. Furthermore, due to the limited number of measurements, training the network so that it learns and generalizes the propagation mechanisms proved to be challenging, especially if the objective of the design is to achieve a better accuracy/precision. Therefore, to facilitate the training of the ANN with limited measurement samples, input data sets are preprocessed before being passed to the network. For instance, instead of providing the network with the LoS length (d); initially, L FS (d) is calculated, then scaled by the path loss exponent (n A231 ), and passed to the network. Similarly, in addition to providing the ANN with the number of walls blocking the LoS, the total optimized attenuation of these walls are extracted from the COST231 model and passed as an input to further assist the network’s learning process. Above all, rather than entirely training the ANN to predict the propagation, it was trained to correct the inaccuracies of the COST231 model and improve upon its performance. With this approach, training is carried out using 270 data samples from the eighth floor, and then tested for the collected measurements on the seventh floor. This approach made the training process easy, quick, and needless of an intensive data collection. Packet loss was observed at some of the locations during the data collection. This was compared against the fading standard deviation (σ) and RSSI; however, no particular correlation was found between them. This message loss might have been due to frequency interference, a destructive multi-path, or even the mobile data connection of LoRaWAN to the data server using a User Datagram Protocal (UDP). 6. Conclusions The propagation of LoRaWAN was analyzed in an outdoor–indoor scenario and compared with commonly used propagation models. The performances of these models were briefly compared, and their advantages and shortfalls were discussed. An adjustment was made to the COST231 model, which made it more applicable to outdoor–indoor scenarios. A hybrid model was proposed, comprising an ANN and an optimized Multi-Wall Model—in this case, the adjusted COST231 model. This combination made the training process faster and easier rather than relying on an ANN only. It also diminished the number of data samples required for training the ANN. By using the ANN, the propagation estimation accuracy was improved. This improvement was achieved by first optimizing the COST231 propagation (FA231 ). Second, the trained ANN was used to generate TENN , which is an estimate of the error in the optimized COST231, Figure 6a. Finally, the ˆ = TE + FA231 ), as shown in estimated error was added to the optimized propagation results (RSSI NN ˆ Figure 5, resulting in a more accurate prediction (RSSI) of the practical measurements, Figure 6b. This hybrid model reduced the initial MSE of the COST213 from 21 to 11.23. Acknowledgments: Authors would like to thank, A. Wixted, for his technical help. Glasgow Caledonian University, Stream Technologies, KTP (Innovate UK), and Qatif College of Technology for funding and facilitating this research. Author Contributions: Salaheddin Hosseinzadeh and Mahmood Almoathen conceived and designed the experiments; Mahmood Almoathen and Salaheddin Hosseinzadeh performed the experiments; Salaheddin Hosseinzadeh analyzed the data; Mahmood Almoathen, Hadi Larijani and Krystyna Curtis contributed materials/analysis tools; Salaheddin Hosseinzadeh, Krystyna Curtis and Hadi Larijani wrote the paper. Conflicts of Interest: The authors declare no conflict of interest.
References 1.
2.
Vejlgaard, B.; Lauridsen, M.; Nguyen, H.; Kovács, I.Z.; Mogensen, P.; Sorensen, M. Interference Impact on Coverage and Capacity for Low Power Wide Area IoT Networks. In Proceedings of the 2017 IEEE Wireless Communications and Networking Conference (WCNC), San Francisco, CA, USA, 19–22 March 2017. Thielemans, S.; Bezunartea, M.; Steenhaut, K. Establishing transparent IPv6 communication on LoRa based low power wide area networks (LPWANS). In Proceedings of the 2017 Wireless Telecommunications Symposium (WTS), Chicago, IL, USA, 26–28 April 2017.
Big Data Cogn. Comput. 2017, 1, 7
3. 4.
5.
6.
7. 8.
9. 10. 11.
12.
13.
14.
15. 16.
17.
18. 19. 20. 21.
22.
9 of 10
Petäjäjärvi, J.; Mikhaylov, K.; Yasmin, R.; Hämäläinen, M.; Iinatti, J. Evaluation of LoRa LPWAN technology for indoor remote health and wellbeing monitoring. Int. J. Wirel. Inform. Netw. 2017, 24, 153–165. [CrossRef] Weber, P.; Jäckle, D.; Rahusen, D.; Sikora, A. IPv6 over LoRaWANTM . In Proceedings of the 2016 3rd International Symposium on Wireless Systems within the Conferences on Intelligent Data Acquisition and Advanced Computing Systems (IDAACS-SWS), Offenburg, Germany, 26–27 September 2016. Nolan, K.E.; Guibene, W.; Kelly, M.Y. An evaluation of low power wide area network technologies for the Internet of Things. In Proceedings of the 2016 International Wireless Communications and Mobile Computing Conference (IWCMC), Cyprus, Paphos, 5–9 September 2016. Robert, J.; Heuberger, A. LPWAN downlink using broadcast transmitters. In Proceedings of the 2017 IEEE International Symposium on Broadband Multimedia Systems and Broadcasting (BMSB), Caligari, Italy, 7–9 June 2017. Adelantado, F.; Vilajosana, X.; Tuset-Peiro, P.; Martinez, B.; Melia-Segui, J.; Watteyne, T. Understanding the limits of LoRaWAN. IEEE Commun. Mag. 2017, 55, 34–40. [CrossRef] Wixted, A.J.; Kinnaird, P.; Larijani, H.; Tait, A.; Ahmadinia, A.; Strachan, N. Evaluation of LoRa and LoRaWAN for wireless sensor networks. In Proceedings of the 2016 IEEE SENSORS, Orlando, FL, USA, 30 October–3 November 2016. Wixted, A. Surveying the Operating Range of LoRa Wireless in Glasgow CBD. 2016. Available online: http://www.stream-technologies.com/whitepapers/lora-range-survey/ (accessed on 12 December 2017). Wixted, A. Stream Technologies LoRaWAN Networking Study. 2016. Available online: http://www.streamtechnologies.com/whitepapers/lorawan-networking-study/ (accessed on 12 December 2017). Petajajarvi, J.; Mikhaylov, K.; Roivainen, A.; Hanninen, T.; Pettissalo, M. On the coverage of LPWANs: Range evaluation and channel attenuation model for LoRa technology. In Proceedings of the 2015 14th International Conference on ITS Telecommunications (ITST), Copenhagen, Denmark, 2–4 December 2015. Lukas; Tanumihardja, W.A.; Gunawan, E. On the application of IoT: Monitoring of troughs water level using WSN. In Proceedings of the 2015 IEEE Conference on Wireless Sensors (ICWiSe), Melaka, Malaysia, 24–26 August 2015. Aref, M.; Sikora, A. Free space range measurements with Semtech LoRaTM technology. In Proceedings of the 2014 2nd International Symposium on Wireless Systems within the Conferences on Intelligent Data Acquisition and Advanced Computing Systems: Technology and Applications (IDAACS-SWS), Offenburg, Germany, 11–12 September 2014. Hosseinzadeh, S.; Larijani, H.; Wixted, A.; Curtis, K.; Amini, A. Empirical propagation performance evaluation of LoRa for indoor environment. In Proceedings of the 2017 15th International Conference on Industrial Informatics (INDIN), Emden, Germany, 24–26 July 2017. Semthec. Whats LoRa? 2017. Available online: http://www.semtech.com/wireless-rf/internet-of-things/ what-is-lora/ (accessed on 9 May 2017). Neumann, P.; Montavont, J.; Noël, T. Indoor deployment of low-power wide area networks (LPWAN): A LoRaWAN case study. In Proceedings of the 2016 IEEE 12th International Conference on Wireless and Mobile Computing, Networking and Communications (WiMob), New York, NY, USA, 17–19 October 2016. Mikhaylov, K.; Petaejaejaervi, J.; Haenninen, T. Analysis of capacity and scalability of the LoRa low power wide area network technology. In Proceedings of the 22rd European Wireless Conference on European Wireless, Oulu, Finland, 18–20 May 2016. Qiu, L.; Jiang, D.; Hanlen, L. Neural network prediction of radio propagation. In Proceedings of the 6th Australian Communications Theory Workshop, Brisbane, Australia, 2–4 February 2005. Neskovic, A.; Neskovic, N.; Paunovic, D. Indoor electric field level prediction model based on the artificial neural networks. IEEE Commun. Lett. 2000, 4, 190–192. [CrossRef] Wolfle, G.; Landstorfer, F.M. Field strength prediction in indoor environments with neural networks. In Proceedings of the 1997 IEEE 47th Vehicular Technology Conference, Phoenix, AZ, USA, 4–7 May 1997. Popescu, I.; Nafornita, I.; Gavriloaia, G.; Constantinou, P.; Gordan, C. Field strength prediction in indoor environment with a neural model. In Proceedings of the TELSIKS 2001 5th International Conference on Telecommunications in Modern Satellite, Cable and Broadcasting Service, Nis, Yugoslavia, 19–21 September 2001. Wolfle, G.; Landstorfer, F.M. Dominant paths for the field strength prediction. In Proceedings of the 1998 48th IEEE Vehicular Technology Conference, Ottawa, ON, Canada, 21 May 1998.
Big Data Cogn. Comput. 2017, 1, 7
23.
24.
25. 26. 27. 28. 29.
30. 31.
32. 33.
34. 35.
36. 37. 38.
39.
40. 41.
10 of 10
Popescu, I.; Nikitopoulos, D.; Nafornita, I.; Constantinou, P. ANN prediction models for indoor environment. In Proceedings of the 2006 IEEE International Conference on Wireless and Mobile Computing, Networking and Communications, Montreal, QC, Canada, 19–21 June 2006. Zhou, H.; Wang, F.; Yang, C. Application of artificial neural networks to the prediction of field strength in indoor environment for wireless LAN. In Proceedings of the 2005 International Conference on Wireless Communications, Networking and Mobile Computing, Wuhan, China, 23–26 September 2005. Neskovic, A.; Neskovic, N. Microcell electric field strength prediction model based upon artificial neural networks. AEU Int. J. Electron. Commun. 2010, 64, 733–738. [CrossRef] Multitech. MultiConnect mDot Long Range RF Modules (MTDOT Series). 2016. Available online: https: //www.multitech.com/brands/multiconnect-mdot (accessed on 12 December 2017). Kerlink. LoRa IoT Station. 2017. Available online: www.kerlink.fr/images/Kerlink/fiches_produit/LoRaIoT-Station.pdf (accessed on 12 December 2017). Rappaport, T.S. Wireless Communications: Principles and Practice; Prentice Hall PTR: Upper Saddle River, NJ, USA, 1996; Volume 2. Bose, A.; Foh, C.H. A practical path loss model for indoor WiFi positioning enhancement. In Proceedings of the 2007 6th International Conference on Information, Communications & Signal Processing, Singapore, 10–13 December 2007. Final Report for COST Action 231, Chapter 4. European Cooperation in Science and Technology. Available online: http://www.lx.it.pt/cost231/final_report.htm (accessed on 12 December 2017). Hosseinzadeh, S. Multi-wall Signal Propagation Model. 2016. Available online: http://www.mathworks. com/matlabcentral/fileexchange/61340-multi-wall--cost231----free-space-signal-propagation-models (accessed on 12 December 2017). Hosseinzadeh, S.; Larijani, H.; Curtis, K. An enhanced modified multi wall propagation model. In Proceedings of the 2017 Global Internet of Things Summit (GIoTS), Geneva, Switzerland, 6–9 June 2017. Alhamoud, A.; Kreger, M.; Afifi, H.; Gottron, C.; Burgstahler, D.; Englert, F.; Böhnstedt, D.; Steinmetz, R. Empirical investigation of the effect of the door´s state on received signal strength in indoor environments at 2.4 GHz. In Proceedings of the 39th Annual IEEE Conference on Local Computer Networks Workshops (LCN Workshops), Edmonton, AB, Canada, 8–11 September 2014. Hassoun, M.H. Fundamentals of Artificial Neural Networks; MIT Press: Cambridge, MA, USA, 1995. International Telecommunication Union. Effects of Building Materials and Structures on Radiowave Propagation above about 100 MHz; ITU Recommendation P.2040-1; International Telecommunication Union: Geneva, Switzerland, 2015. Rudd, R.; Craig, K.; Ganley, M.; Hartless, R. Building Material and Propagation Final Report; Ofcom: London, UK, 2014. Molkdar, D. Review on radio propagation into and within buildings. IEE Proc. H Microw. Antennas Propag. 1991, 138, 61–73. [CrossRef] Angskog, P.; Backstrom, M.; Vallhagen, B. Measurement of radio signal propagation through window panes and energy saving windows. In Proceedings of the 2015 IEEE International Symposium on Electromagnetic Compatibility (EMC), Dresden, Germany, 16–22 August 2015. Rodriguez, I.; Nguyen, H.C.; Jorgensen, N.T.K.; Sorensen, T.B.; Mogensen, P. Radio Propagation into Modern Buildings: Attenuation Measurements in the Range from 800 MHz to 18 GHz. In Proceedings of the 2014 IEEE 80th Vehicular Technology Conference (VTC Fall), Vancouver, BC, Canada, 14–17 September 2014. Gustafsson, M.; Karlsson, A.; Rebelo, A.P.P.; Widenberg, B. Design of frequency selective windows for improved indoor outdoor communication. IEEE Antennas Propag. Trans. 2006, 54, 1897–1900. [CrossRef] Okamoto, H.; Kitao, K.; Ichitsubo, S. Outdoor-to-Indoor Propagation Loss Prediction in 800-MHz to 8-GHz Band for an Urban Area. IEEE Trans. Veh. Technol. 2009, 58, 1059–1067. [CrossRef] © 2017 by the authors. Licensee MDPI, Basel, Switzerland. This article is an open access article distributed under the terms and conditions of the Creative Commons Attribution (CC BY) license (http://creativecommons.org/licenses/by/4.0/).