A Neural Oscillator Sound Separator for Missing Data Speech Recognition Guy J. Brown and Jon Barker Department of Computer Science University of Sheffield Regent Court, 211 Portobello Street, Sheffield S1 4DP, UK Email: {g.brown,j.barker}@dcs.shef.ac.uk Abstract In order to recognise speech in a background of other sounds, human listeners must solve two perceptual problems. First, the mixture of sounds reaching the ears must be parsed to recover a description of each acoustic source, a process termed ‘auditory scene analysis’. Second, recognition of speech must be robust even when the acoustic evidence is missing due to masking by other sounds. This paper describes an automatic speech recognition system that addresses both of these issues, by combining a neural oscillator model of auditory scene analysis with a framework for ‘missing data’ recognition of speech.
1. Introduction Recent advances in speech recognition technology have been impressive, but robust recognition of speech in noisy acoustic environments still remains a largely unsolved problem. This state of affairs stands in contrast to the speech perception performance of human listeners, which is robust in the presence of interfering sounds. It is likely, therefore, that the noise robustness of automatic speech recognition can be improved by an approach which is more firmly based on principles of human auditory function. Here, we describe an approach to speech separation and recognition that is strongly motivated by an auditory account. Our approach is motivated by two observations about the mechanisms of auditory function in general, and those of speech perception in particular. First, the auditory system is a sound separator par excellence; human listeners are able to parse a mixture of sounds in order to segregate a target source from the acoustic backgound. Bregman [2] has coined the term ‘auditory scene analysis’ for this process, and suggests that it proceeds in two stages. In the first stage (which we call segmentation), the acoustic mixture is decomposed into ‘sensory elements’. In the second stage (grouping), elements which are likely to have arisen from the same environmental event are combined to form a perceptual stream. Streams are
DeLiang Wang Department of Computer and Information Science and Centre for Cognitive Science The Ohio State University Columbus, OH 43210-1277, USA Email:
[email protected] subjected to higher-level processing, such as speech recognition and understanding. Over the last decade or so the field of computational auditory scene analysis (CASA) has emerged, which aims to develop computer systems that mimic the sound separation ability of human listeners [6], [4], [11], [9]. To date, however, the performance of these systems has been disappointing. In a previous article, we have proposed that performance could be improved by grounding CASA more firmly in the neurobiological mechanisms of hearing, rather than rulebased implementations of Bregman’s grouping heuristics [14]. Accordingly, we described a neural oscillator approach to CASA, which uses a neurobiologically plausibly network of neural oscillators to encode the grouping relationships between acoustic features (see also [18]). In such networks, oscillators that belong to the same stream are synchronized (phase locked with zero phase lag), and are desynchronized from oscillators that belong to different streams. Previously, we have shown that the neural oscillator approach to CASA is able to segregate speech from interfering sounds with some success [14], [17]. The second motivating factor in our work is the observation that speech is a remarkably robust communication signal. Psychophysical studies have shown that speech perception remains largely unaffected by distortion or severe bandlimiting of the acoustic signal (see [16] for a review). Cooke and his co-workers have interpreted this robustness as an ability of speech perception mechanisms to deal with ‘missing data’ [7], [8]. They propose an approach to automatic speech recognition in which a conventional hidden Markov model (HMM) classifier is adapted to deal with missing or unreliable acoustic evidence. The principal advantage of this approach is that it makes no strong assumptions about the characteristics of the noise background in which the target speech sounds are embedded. The neural oscillator approach to CASA is an ideal front-end for missing data speech recognition, since the state of a neural oscillator network may be directly interpreted as a
Correlogram Gammatone Filterbank
Firing Rate
Time
F re q uen cy
Speech and Noise
Harmonic Grouping
Missing Data Speech Recogniser Global Inhibitor
Spectral Subtraction
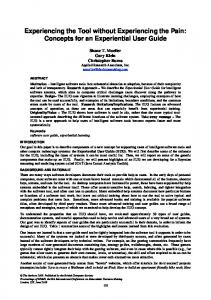
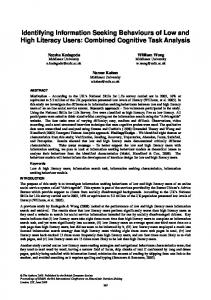
Oscillator Network Figure 1. Schematic diagram of the speech separation and recognition system.
The input to the model consists of a mixture of speech and an interfering sound source, sampled at a rate of 20 kHz with 16 bit resolution. This input signal is processed in four stages, which are described below and shown schematically in Figure 1. 2.1. Peripheral auditory processing Peripheral auditory frequency selectivity is modelled using a bank of 32 gammatone filters with center frequencies equally distributed on the equivalent rectangular bandwidth (ERB) scale between 50 Hz and 8 kHz [4]. Inner hair cell function is approximated by half-wave rectifying and compressing the output from each filter. The resulting simulated auditory nerve firing patterns are used to compute a correlogram (see below). In a second processing pathway, the instantaneous Hilbert envelope is computed from the output of each gammatone filter [6]. This is smoothed with a first-order lowpass filter with a time constant of 8 ms, and then sampled at intervals of 10 ms to give a map of auditory firing rate (figure 2A). 2.2. Mid-level auditory representations The second stage of the model extracts periodicity information from the simulated auditory nerve firing
∑
r ( i, j – k )r ( i, j – k – τ )w ( k )
(1)
k=0
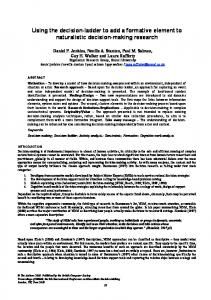
Here, r is the simulated auditory nerve activity, and w is a rectangular window of width M time steps. We use M=600, corresponding to a window duration of 30 ms. For efficiency, the fast Fourier transform is used to evaluate (1) in the frequency domain. The correlogram is computed at 10 ms intervals. For periodic sounds, a characteristic ‘spine’ appears in the correlogram which occurs at a lag corresponding to the A Frequency [Hz]
2. Model description
M–1
A ( i, j, τ ) =
8000 3207 1205 370 50 0
B Frequency [Hz]
Compared to our previous work [14], the current paper introduces a number of innovations. First, we demonstrate that a neural oscillator model of CASA can form an effective preprocessor for missing data recognition of speech. Second, we introduce a technique for performing spectral subtraction within a neural oscillator framework. Finally, our previous model is simplified to reduce its computational cost (albeit with the loss of some generality), thus leading to a system that can be effectively applied to large corpora of test data.
patterns. This is achieved by computing a running autocorrelation of the auditory nerve activity in each channel, forming a representation known as a correlogram. At time step j, the autocorrelation A(i,j,τ) for channel i with time lag τ is given by:
C
0.25
0.5
0.75
1
1.25
1.5
1.7
0.25
0.5
0.75
1
1.25
1.5
1.7
0.25
0.5
0.75
1
1.25
1.5
1.7
8000 3207 1205 370 50 0
Frequency [Hz]
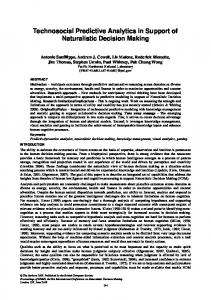
time-frequency ‘mask’; in other words, active oscillators represent acoustic components that are available for recognition, whereas inactive oscillators represent missing or unreliable acoustic evidence.
8000 3207 1205 370 50 0
Time [seconds]
Figure 2: A. Auditory firing rate for the utterance “1159” in a background of factory noise. The SNR was 10 dB. Lighter regions indicate higher firing rate. B. The stream in the oscillator network corresponding to unpitched acoustic events; active oscillators are shown in white. C. The stream corresponding to pitched acoustic events (voiced speech).
Here, Iij represents the external input to the oscillator and ε, γ and β are parameters. For Iij > 0, (3) has a periodic solution which alternates between silent and active phases of near steady-state behaviour. In contrast, if Iij < 0 then the solution has a stable fixed point and no oscillation is produced. Hence, oscillations in (3) are stimulus dependent. The system may be regarded as model for the spiking behaviour of a single neuron, or as a mean field approximation to a network of reciprocally connected excitatory and inhibitory neurons.
Channel Center Frequency [Hz]
8000
3207
1205
In the general form of LEGION, S denotes coupling from other oscillators in the network, including a global inhibitor which serves to desynchronize different oscillator populations. Here, we use a simplified network in which there are no excitatory connections between oscillators, and therefore S represents an input from the global inhibitor only:
370
Amplitude
50
S = – W z S ∞ ( z, θ z )
(4)
1 S ∞ ( x, θ ) = -----------------------------------------------1 + exp [ – K ( x – θ ) ]
(5)
where 0
5
10
15
Autocorrelation Delay [ms]
Figure 3: Correlogram (upper panel) and pooled correlogram (lower panel) for time frame 60 of the mixture of speech and noise shown in Figure 2. The fundamental period of the speech source is marked with an arrow. stimulus period (upper panel of figure 3). This pitch-related structure can be emphasized by forming a ‘pooled’ correlogram s(j,τ): 32
s ( j, τ ) =
∑ A ( i, j , τ )
(2)
i=1
The pooled correlogram exhibits a clear peak at the fundamental period of a harmonic sound (lower panel of figure 3), and the height of this peak can be interpreted as a measure of pitch strength [12]. 2.3. Neural oscillator network Our model employs a simplified version of the locally excitatory globally inhibitory oscillator network (LEGION) proposed in [15]. The building block of LEGION is a single oscillator consisting of a reciprocally connected excitatory unit x and inhibitory unit y. The network takes the form of a time-frequency grid (see figure 1), so we index each oscillator according to its frequency channel (i) and time frame (j): 3
x˙ij = 3x ij – x ij + 2 – y ij + I ij + S
(3a)
y˙ij = ε ( γ ( 1 + tanh ( x ij ⁄ β ) ) – y ij )
(3b)
This formulation of LEGION is similar to that described in [5]. Here, Wz represents the weight of inhibition from the global inhibitor, z. The activity of z is defined as z˙ = φ ( σ ∞ – z )
(6)
where σ = 0 if xij < θz for every oscillator (i,j), and σ = 1 if xij ≥ θz for at least one oscillator. Here, θz represents a threshold. Once an oscillator is in the active phase, this threshold is exceeded and the global inhibitor receives an input. In turn, the global inhibitor feeds back inhibition to the oscillators in the network, causing the oscillatory responses to different objects to desynchronize. The parameters for all simulations reported here were ε = 0.1, γ = 6.0, β = 4.0, Wz = 0.2, θz = 0.1, φ = 3.0 and K = 50. 2.4. Spectral subtraction and harmonic grouping Segregation of speech from a noise background is achieved in the model by two mechanisms; spectral subtraction and harmonic grouping. Both mechanisms can be conveniently implemented within a neural oscillator framework. Spectral subtraction is a well-known technique for suppressing a stationary or slowly varying noise background [2]. Here we use a simple non-adaptive spectral subtraction approach. For each channel i of the auditory model, we compute a fixed noise estimate ni from the mean of the first 10 frames of the smoothed firing rate response. Only oscillators corresponding to time-frequency regions whose energy lie above ni receive an input: I ij = H ( e ij – n i ) p ij
(7)
Here, H is the Heaviside function (i.e., H(x) = 1 for x ≥ 0, and zero otherwise) and eij is the smoothed firing rate response in channel i at time j. The term pij in (7) is an input whose value depends on whether the corresponding time-frequency region (i,j) is classified as pitched or unpitched. Initially, the pooled correlogram is used to identify time frames that contain a strong pitch. Global pitch strength pg(j) at time frame j is given by p g ( j ) = s ( j, τ p ) ⁄ s ( j, 0 )
(8)
Here, τp represents the autocorrelation delay at which the largest peak occurs in the pooled correlogram, within a pitch range of 60 Hz to 500 Hz. Therefore (8) represents a measure of the height of the pitch peak relative to the energy in that time frame (as estimated from the pooled autocorrelation at zero delay). Similarly, we estimate the local pitch strength pc(i,j) in each channel i at time frame j as follows: p c ( i , j ) = A ( i , j , τ p ) ⁄ A ( i, j, 0 )
(9)
Finally, pij is defined as: 0.2 if p g ( j ) > θ p and p c ( i, j ) > θ c p ij = 0.15 otherwise
(10)
Here θp and θc are thresholds. We use θp=0.65 and θc=0.7. Taken together, (7)-(10) mean that oscillators corresponding to acoustic components which lie below the noise floor receive zero input; otherwise, each oscillator receives one of two inputs depending on whether the component it represents is pitched or unpitched. The effect of this input differential, when combined with the effect of the global inhibitor, is to cause oscillators representing pitched components to desynchronize from those representing unpitched components. This behaviour is illustrated in figure 2. The figure indicates that spectral subtraction is effective in suppressing the noise background, except when impulsive intrusions occur. However, because the impulsive sounds are unpitched, they are segregated from the pitched (speech) components by the harmonic grouping mechanism.
3. Evaluation 3.1. Missing data speech recogniser In general, the speech recognition problem is to assign an observed acoustic vector v to a class C. However, in cases where some elements of v are missing or unreliable, the likelihood f(v|C) cannot be evaluated in the conventional manner. The ‘missing data’ solution to this problem is to partition v into reliable parts vr and unreliable parts vu [8]. The components of vr have known values and are directly
available to the classifier, whereas the components of vu have uncertain values. One approach, then, is to classify based solely on the reliable data, by replacing f(v|C) with the marginal distribution f(vr|C). However, when v is an acoustic vector additional constraints can be exploited, since it is known that the uncertain components will have bounded values. Here, v is an estimate of auditory nerve firing rate, so the lower bound for vu will be zero and the upper bound will be the observed firing rate. Accordingly, in the experiments described here we employ a missing data recogniser based on the ‘bounded marginalisation’ method (see [8] for details). Clearly, the missing data approach requires a process which will partition v into (vr, vu). In this respect, the neural oscillator network forms an ideal preprocessor for missing data recognition, since the state of the network directly indicates whether each element in the time-frequency plane is reliable or unreliable. When the speech stream is in its active phase, active oscillators correspond to the components of vr; they represent reliable spectral regions that are pitched and lie above the noise floor. Similarly, oscillators which remain silent when the speech stream is in its active phase represent unreliable components, vu. This is illustrated in figure 2C, which may be interpreted as a mask for the corresponding map of firing rate shown in figure 2A. In figure 2C, white pixels (active oscillators) indicate reliable time-frequency regions and black pixels (inactive oscillators) indicate unreliable time-frequency regions. 3.2. Corpus Following Cooke et al. [8], we evaluated our system using the male utterances from the TiDigits connected digit corpus [10]. Auditory rate maps were obtained for the training section of the corpus as described in section 2.1, and used to train 12 word-level HMMs (a silence model, ‘oh’, ‘zero’ and ‘1’ to ‘9’). A subset of 240 utterances from the TiDigits test set were used for testing. To each test utterance, ‘factory’ noise from the NOISEX corpus [13] was added with a random offset at a range of SNRs from -5 dB to 20 dB in 5 dB increments. The ‘factory’ noise intrusion represents a reasonable challenge for our system; in addition to a continuous noise background with energy peaks in the formant region of speech, it contains occasional noise bursts that are reminiscent of hammer blows. 3.3. Results Recognition results are shown in Figure 4. Baseline performance, equivalent to that of a conventional HMMbased speech recogniser, was obtained by recognising the noisy rate maps directly. The figure also shows the performance of the combined CASA preprocessor and missing data recogniser. At high SNRs (20 dB and above),
identified as a separate stream by our neural oscillator network.
100 90 80
CASA + MD ASR Conventional ASR Spectral Subtraction
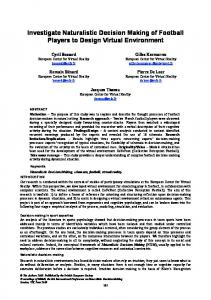
We should note, however, that a mechanism for removing unpitched acoustic components is a double-edged sword; it also removes unvoiced regions of speech. Hence, the recognition performance of the combined CASA and missing data approach is based on recognition of voiced speech only. Consequently, our CASA system performs less well than a conventional recogniser or spectral subtraction front-end when the SNR is high (20 dB or above). It is likely that overall performance could be further improved by using delta features [1]. Also, the number of insertion errors could be reduced by forcing silence at the start and end of the decodings.
Accuracy [%]
70 60 50 40 30 20 10 0 −5
0
5
10
15
20
200
Signal−to−noise ratio [dB] Figure 4: Recognition accuracy for a corpus of spoken digits in factory noise. The neural oscillator approach to CASA outperforms a spectral subtraction preprocessor (data from [8]), and when combined with missing data techniques it represents a significant improvement over the performance of a conventional automatic speech recogniser (ASR). the conventional recogniser outperforms the combined CASA and missing data system. However, as the SNR falls, the accuracy of the conventional recogniser drops very sharply, whereas the performance of the missing data system degrades gracefully. At some SNRs, the combined CASA and missing data processing give a very substantial improvement in recognition accuracy (in excess of 40% at 5 dB). Figure 4 also shows the recognition performance of a conventional speech recogniser when combined with a spectral subtraction algorithm (data from [8]). Again, this outperforms our CASA system at high SNRs, but performs relatively poorly as the SNR falls.
4. Discussion The pattern of results in Figure 4 suggest that our CASA system, when combined with a missing data approach, provides speech recognition performance which far exceeds that of a conventional ASR system at low SNRs. Similarly, our CASA preprocessor outperforms a conventional spectral subtraction front-end at low SNRs. Spectral subtraction performs poorly because the ‘factory’ noise background is nonstationary; impulsive noise bursts cannot be effectively removed by the spectral subtraction technique, but they are
The approach described here is a simplification of our earlier two-layer neural oscillator CASA model [14]. These simplifications have been made to reduce the computational cost of the model, at the loss of some generality. The approach described here works well when speech is contaminated with broadband interfering sounds which are weakly harmonic, or unpitched. However, it will fail when the interfering sound source is strongly harmonic, such as the voice of another speaker. In two respects, however, the current study extends our previous model. First, we have shown that spectral subtraction can be conveniently implemented within the neural oscillator framework. Also, our previous model did not provide a mechanism for grouping acoustic components that are separated in time (‘sequential grouping’ [3]). We have implemented such a mechanism here, albeit a very simple one. Future work will address the issue of sequential grouping in a more general way, by using binaural cues to group acoustic components that originate from the same location in space, and by tracking the pitch contour of a single speaker.
References [1] J. Barker, L. Josifovski, M.P. Cooke and P.D. Green, ‘Soft decisions in missing data techniques for robust automatic speech recognition’, Proceedings of ICSLP-2000, Beijing. [2] S. F. Boll, ‘Suppression of acoustic noise in speech using spectral subtraction’, IEEE Transactions on Acoustic, Speech and Signal Processing, 27 (2), pp. 113-120, 1979. [3] A. S. Bregman, Auditory scene analysis. Cambridge, MA: MIT Press, 1990. [4] G. J. Brown & M. Cooke, ‘Computational auditory scene analysis’, Computer Speech and Language, 8, pp. 297-336, 1994. [5] G. J. Brown & D. L. Wang, ‘Modelling the perceptual segregation of double vowels with a network of neural oscillators’, Neural Networks, 10 (9), pp. 1547-1558, 1997.
[6] M. Cooke, Modelling auditory processing and organization. Cambridge, U.K.: Cambridge University Press, 1993. [7] M. Cooke, A. C. Morris & P. D. Green, ‘Missing data techniques for robust speech recognition’, Proceedings of ICASSP, pp. 863-866, 1997. [8] M. Cooke, P. D. Green, L. Josifovsky & A. Vizinho, ‘Robust automatic speech recognition with missing and unreliable acoustic data’, Speech Communication, 34, pp. 267-285, 2001. [9] D. P. W. Ellis, Prediction-driven computational auditory scene analysis. Ph.D. Dissertation, MIT Department of Electrical Engineering and Computer Science, 1996. [10] R. G. Leonard, ‘A database for speaker-independent digit recognition’, Proceedings of ICASSP, pp. 111-114, 1984. [11] D. F. Rosenthal & H. Okuno (Eds.), Computational auditory scene analysis. Mahwah, NJ: Lawrence Erlbaum, 1998. [12] M. Slaney & R. F. Lyon, ‘A perceptual pitch detector’, Proceedings of ICASSP, pp. 357-360, 1990. [13] A. P. Varga, H. J. M. Steeneken, M. Tomlinson & D. Jones, The NOISEX-92 study on the effect of additive noise on automatic speech recognition. Technical Report, Speech Research Unit, Defence Research Agency, Malvern, U.K. [14] D. L. Wang & G. J. Brown, ‘Separation of speech from interfering sounds based on oscillatory correlation’, IEEE Transactions on Neural Networks, 10 (3), pp. 684-697, 1999. [15] D. L. Wang & D. Terman (1995) Locally excitatory globally inhibitory oscillator networks. IEEE Transactions on Neural Networks, 6 (1), pp. 283-286. [16] R. M. Warren, Auditory perception: a new analysis and synthesis. Cambridge, U.K.: Cambridge University Press, 1999. [17] A. J. W. van der Kouwe, D. L. Wang & G. J. Brown, ‘A comparison of auditory and blind separation techniques for speech segregation’, IEEE Transactions on Speech and Audio Processing, 9, pp. 189-195, 2001. [18] C. von der Malsburg, The correlation theory of brain function, Internal Report 81-2, Max-Planck-Institute for Biophysical Chemistry, 1981.