Circuits Systems & Signal Processing
A Control-Theoretic Approach for Efficient Design of Filters in DAC and Digital Audio Amplifiers Konstantinos Tsakalis, Nikolaos Vlassopoulos, George Lentaris, Dionysios Reisis
Received: October 2009 / Revised: January 2010
ABSTRACT A control-theoretic approach in designing Digital to Analogue Converters and Digital Amplifiers which leads to improved performance in Audio and Multimedia applications is presented in this paper. The design involves an over-sampling and a pulse modulation component which is driven by a pulse generation algorithm based on the characteristics of the output filter. The theoretical model results in a family of digital circuits whose operation is verified by computer simulations achieving a performance of Signal-to-Noise Ratio of 147 dB at a switching rate of 90 MHz. Implementation and hardware complexity issues are discussed based on a FPGA realization of the algorithm.
Keywords Pulse Width Modulation, Delta Modulation, Digital-to-Analog Converters
____________________ Partially supported by IST programme IST-1999-20380 (HIPRO) and project 70/4/4084 of the National and Kapodistrian Univ. of Athens ____________________ K. Tsakalis Electrical Engineering, Arizona State University, PO Box 875706, Tempe, AZ 85287-5706, USA e-mail:
[email protected] N. Vlassopoulos LORIA MAIA Team, INRIA Nancy-Grand Est, France e-mail:
[email protected] G. Lentaris, D. Reisis Electronics Laboratory, Physics Department, National and Kapodistrian University of Athens, Panepistimiopolis, Athens 157 84, Greece e-mail:
[email protected] D. Reisis () e-mail:
[email protected]
Paper published at: Springer - Birkhäuser Boston, ISSN: 0278-081X Circuits, Systems, and Signal Processing Volume 30, Number 2, pp. 421-438 DOI: 10.1007/s00034-010-9231-3 http://dx.doi.org/10.1007/s00034-010-9231-3
Circuits Systems & Signal Processing
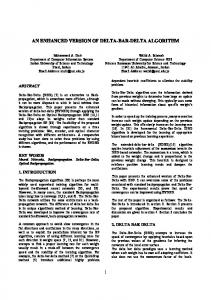
1. INTRODUCTION The demand for power efficiency in a variety of multimedia and home theater applications imposes the need for using digital audio amplifiers. Furthermore, the organization of these amplification units and the vast signal processing capabilities of current computing hardware facilitate the development of novel applications. In all cases and regardless of the digital signal processing units involved, the final stage of a digital amplifier includes a plain digital-to-analog converter (DAC) producing a sequence of pulses most often in a Pulse Width Modulation (PWM) or Pulse Density Modulation (PDM) mode of operation. Such a system accomplishes the digital-to-analog conversion by using one or more switching devices, e.g. MOSFETs, in order to form and deliver the appropriate pulses to an appropriately matched output low-pass (or averaging) filter [11][17][8]. The implementation of PWM sequences must address the nonlinearity of the system response to the width of the pulse [15][18][5][19]. A plethora of designs for modules suited for the digital amplifiers as well as integrated devices and consequent implementations have been presented in the literature [2][14][16][20][6][7][9][12][4]. The authors in [2] propose a novel pulse width modulation technique called narrow pulse elimination (NPE) PWM. Their methodology allows the reduction of the harmonic distortion introduced by non-ideal switching times of power switches in digital amplifiers. The authors in [14] use a feedback path to subtract the errors introduced during the amplification of the initial PWM pulses. The advantage of their method lies in the rejection of the power supply noise affecting the power stage of the digital amplifier. The authors in [16] consider the non-linearities of the switching devices and implement a high-fidelity PWM digital amplifier with and without the use of feedback paths (open-loop, closed-loop). [20] introduces a nonlinear control technique that provides one-cycle response and nearly constant switching frequency without a resetable integrator in the control path. As a result, their amplifier can reject large-signal power supply ripple (even 15%). [6] considers the conversion of the pulses from the PCM to the PWM format and studies the distortion introduced during the process. They introduce the “jither” method to minimize the harmonics distortion and they discuss practical realizations of their system operating at 90 MHz clock rate. The feedback linearization study in [4] involves methods to optimize the feedback gain and the circuit parameters of the transistor amplifier. The construction bases on nonlinear higher order models (3rd, 5th, etc) and the parameter optimization is performed off-line (i.e. not during the processing of the signal). Arguably, the ultimate objective of all methods is to approximately invert (and, hence, “linearize”) the PWM generator so that the output signal is as close as possible to the reference signal. In principle, this can be accomplished either by designing a very accurate feedforward inverse filter, or by using a high gain feedback. These two approaches involve a tradeoff decision between sampling rate/speed of execution and computational complexity. In this paper we consider the latter case, where a fast, high gain feedback computational algorithm is used for DAC and Digital Amplifier architectures. Our goal is to design an algorithm that can be implemented and executed in available hardware and establish its limits of performance and any associated performance-complexity tradeoffs. The algorithm results in a DAC architecture, which refers to either an open-loop or a closedloop mode of operation as depicted in Figure 1. In the first case, the operation is an estimation of Computational Algorithm
Switching Device
Output Filter
Output Load
Possible Feedback
Figure 1: The two possible Controller System modes of operation
Circuits Systems & Signal Processing
the pulse to be sent to the switching device based on a known static model of the output filter. In the second case, feedback is used so that the pulse estimation is computed based on a dynamic model of the output filter reflecting its running state as affected by the following device. In either case, the nonlinearity introduced by the switching device presents a non-trivial problem even if the output time-averaging filter is considered to be simple with an exact model available. The computational algorithm determines the pulses (output pulse-train) that are required by the switching device so that the output of the filter tracks as closely as possible the signal being converted. If this computation is accomplished in a recursive rather than a feed-forward manner, then the addition of feedback will lead to a more accurate tracking of the output signal, especially in the presence of perturbations. In turn, this will result in an improved performance in terms of Signal-toNoise Ratio (SNR) with respect to the open-loop approach, without necessarily increasing the computational power required by the algorithm. The present paper is organized as follows. In Section 2, we present the analytical development of the proposed algorithm including the incorporated model details and considerations regarding the output filter. In Section 3, we present the obtained simulation results. In Section 4, we study the robustness of the algorithms with the use of feedback control and present the relative simulation results. Section 5 discusses implementation issues and hardware complexity, while concluding comments are given in Section 6.
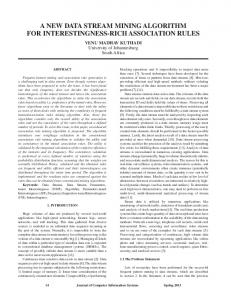
2. DEVELOPMENT OF THE ALGORITHM In order to analytically describe the development of the computational algorithm, we consider the DAC forward signal path, as shown in Figure 2. We denote as y*n the input samples of a target or reference audio signal sampled elsewhere at a sampling rate fs, which is typically equal to 44.1 KHz, and as y(t) the restored analog signal at the output of the output filter with x being the filter state vector. Furthermore, let uk denote the switching device control signal as produced by the computational algorithm in the form of pulses of frequency fu, assumed here to be fu = 45 or 90 MHz. Finally, we use the notation _(t) to denote analog signal and indexes n and k to denote sampled values obtained at fs and fu, respectively. fu y*[n]
Computational Algorithm
u[k]
Switching Device
Output Filter
y(t)
Figure 2: The considered forward signal path
The design of a control algorithm is based on solving an optimization problem of the form: min || y * − y || (1) u where ||·|| is any suitable norm as approximated by the corresponding discrete-time values of the variables y and y*. This will be acceptable if the target signal y*[n] (already sampled at fs=44.1 KHz) is up-sampled and filtered at the pulse frequency fu, since the up-sampled sequence y*[k] is equivalent to sampling of the analog target signal y*(t) at fu because of the band-limited nature of y*[n]. Therefore, we can use digital interpolation and low-pass filtering to generate y*[k] (i.e. oversampling y*[n] by factors of, say, 1024 or 2048 to achieve fu = 45.2 or 90.3 MHz) and then define a set of recursive problems as following:
Circuits Systems & Signal Processing
at time instant k, select u[k],...,u[k+m-1] as the solution of min
u [ k ],,u [ k + m −1]∈{−1, 0 ,1}
y * [k + m] − y[k + m]
(2)
Clearly, this represents an m-Step-Ahead problem, whose integer programming nature is handled by brute force: the algorithm initially computes all the possible outputs of the next time instant and then it selects the optimal input. Such a combinatorial explosion makes long horizons (m>3) impractical but few steps have relatively modest computational requirements. In this respect, we now consider the 1-Step-Ahead (1-SA) and 2-Step-Ahead (2-SA) cases. a) Model Details We start with a state-space description [A,B,C,D] of the filter, and assume a linear filter with constant coefficients. The equations describing the next sampled state and signal output are [13]: x(t k +1 ) = e
A ( tk +1 −tk )
x(t k ) +
t k +1
∫e
A ( tk +1 −τ )
Bu[k ]dτ
(3)
tk
y (t k ) = Cx(t k ) + Du[k ]
(4)
where u[k] is used here as a piecewise constant signal over each pulse interval. Typically, for the intended application D is zero. We perform an a priori evaluation of the matrix exponential and the integral and the state equations in discrete time become: x[k+1] = Φx[k]+Pu[k]
(5)
y[k] = Cx[k]
(6)
t k +1
where
Φ = e A(tk +1 −tk ) , P = ∫ e A(tk +1 −τ ) Bdτ
(7)
tk
We consider the Linear and Time Invariant (LTI) solution P = -A-1(I - Φ)Β. The modeling requirements are described by the matrices Φ (unforced response) and P (pulse response) and for a linear filter these matrices define the model response to the possible pulses. These are the responses: FS[+1] = Φx[k] + P, FS[0] = Φx[k] and FS[-1] = Φx[k] - P. The above model does not consider the characteristics (such as rise and fall times) of the switching device. To account for the transistor switching effects, the filter responses can be modified by a function of the last input. In such a case, t k +1
the pulse response becomes Pi , j = ∫ e A(tk +1 −τ ) Bmi , j (τ )dτ where mi,j(t) is the transition of the transistk
tor output from state i to state j, with i,j = {-1,0,1}. Thus, the One-Step-Ahead algorithm becomes: (0) Step 0 Initialize the filter state vector. Assuming that the filter begins at steady state, equal #
C 1 # ⋅ to the first sample of the target output, x[0] = M IC y[0], M IC = , where [] CΦ 1 denotes the pseudo-inverse of a matrix. This is only important in simulations to avoid the initial transients. (i) Step 1 Compute the responses yi[k+1] for all possible inputs ui, i=1,2,3, and form the corresponding errors ||y*[k+1] – yi[k+1]||. (ii) Step 2 Select the input minimizing the error, u[k] = ui, i=argmini ||y*[k+1] – yi[k+1]||.
Circuits Systems & Signal Processing
(iii) Step 3 Update the state vector using the selected input u[k] and return to Step 1. The computations in Step 1 take into account the model details and can be modified according to the characteristics of the switching devices (e.g. using the aforementioned Pi,j response) or any other known parameter of the system. The 2-SA algorithm is similar except that in Step 1, the output estimate is computed at k+2 for the 9 possible input combinations (u[k]/u[k+1] = {0/0,0/1,0/-1,...}). Then, in Steps 2 and 3, the minimizing inputs are computed in pairs (or tuples for an m-SA algorithm). b) Algorithm Considerations To avoid state or output drifts due to modeling errors it is possible to include an observer-based feedback in the model equations (5) and (6). The resulting equations are [3]: x[k+1] = Φx[k]+Pu[k] + L·(yf[k] – y[k]) y[k] = Cx[k]
(8) (9)
where yf is the output of the analog filter and L is the observer gain computed for the model equations, discretized at the base sampling frequency fs. This update aims to adjust the state x[k] of the model so as to provide the best approximation of the state of the actual system (analog filter, amplifiers, power supply, etc). If the model is a fairly accurate representation of the filter, this correction may be performed infrequently. A common way to compute L is by using Kalman filter theory, e.g., as: L = Φ·S·CT·(C·S·CT+ R)-1 (10) where S is the positive definite solution of the discrete-time filter algebraic Riccati equation Φ·S·ΦΤ – S – Φ·S·CT·(C·S·CT + R)-1·C·S·ΦΤ + Q = 0. Standard conditions for the existence of such a solution are [Φ,C] is observable, R is positive definite and Q is positive semidefinite such that [Φ,Q] is controllable. The most important aspect of the observer design is to select its bandwidth: it should be high enough to reduce the effect of model variations due to nonlinear effects, changes of operating points etc, but low enough to provide immunity to the noise level that exists in the application. Note that, the bandwidth can be adjusted by changing the weight R in the above equations. When the model deviates significantly it is natural to expect a more pronounced deterioration. In this case, an adaptive algorithm (e.g., based on least squares estimation) can be employed to update some or all of the various model parameters. Again, these operations can be performed infrequently or at a low sampling rate since the parameter drifts are expected to occur slowly, if at all. c) Selection of the output filter From our experience with simulated examples we made the following qualitative observations regarding the selection of the output filter. First order filters are simple but their performance is dictated by the pulse frequency. Lower bandwidth filters yield better SNR by a few dB at the expense of a small decrease in dynamic range. 1-SA and 2-SA implementations of the pulse formation algorithm exhibit only minimal differences. They are very easy to code, computationally fast, and reliable to adapt. Second order filters are more complicated but, in general, yield significantly better performance for the same pulse frequency. Both 1-SA and 2-SA algorithms may be used but the 2-SA algorithm yields better performance, especially in the presence of perturbations. The damping ratio can be used to shape the noise spectrum as well as affect the dynamic range. Third or higher order filters are possible but the increase in complexity may be prohibitive. High order filters require mSA algorithms to deal with stability problems, possibly adjusting the control objective (minimization criterion).
Circuits Systems & Signal Processing
3. SIMULATION RESULTS This section contains the more interesting results of our simulation study. We examine the performance of the 1-SA and 2-SA algorithms considering different scenarios with and without modeling errors. The simulation models are intended to show the effectiveness of these algorithms and they omit the transistor switching transients because these can be modeled separately. The test signal of all simulations corresponds to a chirp signal 50 Hz - 25 kHz defined as c(t) = A·sin[(ωο+βt)t], where ωο and β are the starting and the ending frequencies respectively for the time interval of interest (we use here a sequence of 217 points). This chirp signal uses a linear sweep for the instantaneous frequency. It is defined as a sine (instead of the more common cosine) to avoid initial transients causing unnecessary errors. Chirp signals provide a smooth deterministic way to generate energy at given frequencies and analyze control systems. Alternatively, Gaussian random signals could be used for excitation of the system as long as sufficient duration is allowed to ensure that sufficient energy has been supplied at all frequencies of interest. The latter case may produce smoother spectra but may have a disadvantage when the loop contains significant nonlinearities that affect high frequencies, and can distort low frequencies through aliasing effects. The sampling frequency of the chirp is the same as the pulse frequency, although for the 2-SA algorithm only one every other sample is used. The dynamic range, which is the amplitude of sinusoids that can be tracked by the amplifier, is related to the amplitude of control signals that can be applied (control authority). In our case, tracking is achievable for chirp signals of 1/4 amplitude and thus, unless otherwise indicated, the dynamic range is 1/2 of MATLAB’s chirp function to keep the target output within the feasible range of the filter and avoid clipping. The results are illustrated by plotting a FFT estimate of the spectral ratio of the tracking error and the filter output (E(s)/Y(s)). This is approximately the same as the “transfer function” of the error operator (from the target output to the error; the quotes are due to the system nonlinearity and the ensuing abuse of terminology). Note that this estimate is reliable only up to 20 kHz since there is little excitation beyond that frequency. a) Comparison of filter order and pulse frequency effects In these results, a first order filter is simulated when the u[k] pulses have switching frequency at 45
Figure 3: Comparison of filter order and pulse frequency effects (tracking error vs frequency).
Circuits Systems & Signal Processing
Figure 4: The performance of the 1-SA algorithm for various pulse frequencies
and 90 MHz. Also, a second order filter is simulated with pulses at 45 MHz. In all cases, the 1-SA algorithm is used and the bandwidth of the filter is set at 20 kHz. This simulation has been based on the assumption that the algorithm includes the exact model of the subsequent units (no modeling errors exist). As expected, high pulse frequencies reduce the tracking error of the algorithm: for the first order filter case, the SNR improvement by doubling the pulse frequency is in the order of 10 dB (Figure 3). Moreover, the results show that the second order filter clearly outperforms the first order even at a lower pulse frequency. Before advancing to a more detailed simulation analysis, we note that the proposed algorithm −besides DACs− also applies to digital amplifiers. In such a case, current technology renders the use of 90 MHz switching devices infeasible. Consequently, this paragraph evaluates the performance of the proposed algorithm using lower pulse frequencies. Figure 4 compares the 11 and 22 MHz pulse results to the 45 and 90 MHz pulse results, which actually highlight the potential of the solution presented in this work. In all four plots we use the 1-SA algorithm with a 20 KHz second order output filter resulting in excellent performance (at 90 MHz), gracefully deteriorating as the switching frequency decreases (Figure 4). Even for the 11 MHz pulse train, the error is less than -85 dB which is comparable to a common analog amplifier. b) Comparison of damping ratio effects This simulation result shows the effect of the damping ratio on the shape of the tracking error transfer function. In all cases a second order filter is used with 20 kHz bandwidth, 90 MHz pulse and the 1-SA algorithm. The damping ratio ζ is given in the second order transfer function
ω 02 G ( s) = 2 s + 2ζω 0 s + ω 02 where ωο is the natural frequency of undamped oscillations and it is roughly the cutoff frequency of the filter. Values of ζ less than 1 yield underdamped (oscillatory) responses, while values greater
Circuits Systems & Signal Processing
Figure 5: Comparison of damping ratio effects
than 1 yield overdamped responses. For ζ=0.707 the transfer function corresponds to the 2nd order Butterworth filter. Figure 5 depicts the tracking error for various cases of ζ. Note that the increase in the damping ratio decreases the dynamic range. In the event of clipping the performance deteriorates starting at the high frequencies. Also note that high damping ratios result in a slow increase of the error transfer function around 10 kHz. A fairly flat response can be obtained by adjusting the damping ratio ζ. c) Comparison of 1-SA and 2-SA algorithms To compare the two proposed algorithms, we use a second order filter with a damping ratio of 0.5 and we perform two sets of calculations: in the first set we assume that no modeling errors exist, while in the second set we take into account possible errors that could occur during the modeling of the system. These errors include a higher damping ratio of 0.5% to 3% and a parasitic pole at 20 MHz. Parasitic poles are used here to describe a typical perturbation of a first order lag that can be caused by higher order dynamics, capacitances, etc. In our previous second order model, introducing a parasitic pole leads to the form ω 02 1 G ( s) = 2 ⋅ 2 s + 2ζω 0 s + ω 0 τs + 1 where 1/τ is the pole in rad/s. Figure 6 depicts the performance deterioration of the perturbed system (both parasitic pole and damping ratio error) as well as the improvements gained by the use of the 2-SA algorithm. In all cases we use 90 MHz pulses. First, the results show rapid performance degradation as the modeling error increases: almost 50 dB loss when we introduce a parasitic pole and 0.5% damping ratio error (with 5 dB loss each time the damping ratio error is increased by 1%). Second, the results show that the 2-SA algorithm performs better than the 1-SA algorithm by 2 dB in the nominal case, while in the perturbed case (3% damping ratio error, parasitic pole) it performs better by up to 9 dB for the lower signal frequencies. Also note here that the 2-SA algorithm computations are performed at half the frequency of the pulses produced by the digital part of the DAC. This fact allows for hardware implementations with relaxed requirements with respect to the operating clock period.
Circuits Systems & Signal Processing
Figure 6: Comparison of 1-SA and 2-SA algorithms (with and without modeling errors)
4. ROBUSTNESS OF PERFORMANCE AND FEEDBACK CONTROL The feed-forward algorithms we considered in the previous section are very appealing because they offer high levels of nominal performance, without being susceptible to instability problems that exist with feedback control algorithms. However, as shown in the simulation results involving perturbations, they do require extremely accurate models of the final filtering process to maintain the desirable high level of performance. A common remedy for the modeling errors is the use of feedback. Properly designed feedback controllers can reduce the sensitivity of the closed-loop system to modeling errors in a frequency range. In the rest of the frequencies, the loop sensitivity should necessarily increase but within reasonable levels. In this sense, feedback control can guarantee a high level of performance despite modeling errors (robust performance). Drawbacks of feedback include the need for additional hardware to provide the required measurements at the necessary level of accuracy. Also, when the modeling error becomes too large, feedback instability may occur. There is a fairly standard tradeoff between robust performance and robust stability; the former requires high feedback gain and, for open-loop stable processes, the latter requires low feedback gain. The implication of this trade-off is that an upper bound of the modeling error (including nonlinear effects) should be known for the design of the feedback controller. Optimistic estimates of the modeling error may result in instability (or oscillatory behavior), while conservative estimates will produce worse performance. In the following paragraphs we describe a feedback path accommodating the proposed m-SA algorithm and we present the corresponding simulation results. The proposed feedback path consists of two main components: the Observer and the Outer-loop Controller. Other modifications include the use of a Model Adaptation Estimator (to estimate the model parameters from input-output data) and a Dither (introduce a random or high-frequency dither signal, which can improve the performance by up to 3 dB). In our simulations, the observer gain is adjusted to obtain an observer bandwidth around 0.5–1.0 MHz and -40 dB sensitivity in the frequency range of interest. The outer-loop controller (PI, or integrator) bandwidth is set around 200-
Circuits Systems & Signal Processing
300 KHz, attenuating the modeling errors in the interval 0-20 KHz by 20 dB. Overall, the closedloop system under examination is described via equations as follows. The inner-loop (m-SA, observer and output filter) will take as input the value v[k+1] = PI(r[k]=0, y[k] – yf[k]) where yf[k] is the target signal and is equal to the delayed reference signal, i.e. yf[k] = y*[k-m]. PI stands for a standard PI feedback controller with two inputs, reference (set-point) and measurement. The PI controller is described by the equations w[k+1] = sat{w[k]+Kl(r[k]–{y[k]–yf[k]})} and v[k] = sat{w[k]+KP(r[k]–{y[k]–yf[k]})}, where w[k] is the state of the PI controller, KP and KI are the proportional and integral gains respectively and sat{.} denotes the saturation nonlinearity that is necessary in practice to prevent integrator windup. Within the inner-loop, the m-SA algorithm will compute and forward to the output filter the pulses u[k],...,u[k+m-1] minimizing the norm ||y*[k+m] – y[k+m]|| as described in section 2. The state x[k] of the output filter will be updated including the observer correction as described in equations 8 and 9 (section 2.b). Note here that for the computation of the observer gain L (see equation 10), we use the values Q=diag([1 0.1]) and R=106 in our simulation study. To study the robustness of the performance of the proposed feedback system, we introduce modeling and quantization errors to our system simulations. More specifically, we simulate a perturbed system constituting of the nominal transfer function with 1% higher damping ratio and a parasitic pole at 20MHz. We use a second order output filter and we assume the availability of a quantized sampled output from it at 90 MHz (the output sampling frequency can be reduced with negligible or small performance deterioration). In all cases, we use the simpler 1-SA algorithm at 90 MHz as the inner-most control element performing the pulse conversion. Finally, we ignore any transistor switching transients as these can be modeled separately. Figure 7 depicts the FFT estimate of the spectral ratio of the tracking error for various test cases. First, consider the left part of Figure 7, which depicts the performance gain of the proposed feedback method (Controller + Observer). The closed-loop system maintains a very high performance at the level of –147 dB in the nominal case. In the presence of perturbation the closed-loop performance deteriorates at –128 dB but still remains greater than the performance of the open-loop system. Overall, the use of the feedback path enhances the performance of the system by 25 to 60 dB. Also, as expected, the loss of quality due to the presence of perturbations is significantly less in the case of the closed-loop system (~20 dB) than in the case of the open-loop system (60 to 80 dB). Second, consider the right part of Figure 7, which depicts the effect of the quantization errors intro
Figure 7: Comparison of the proposed open loop and feedback methods (left), and the effects of quantization (right).
Circuits Systems & Signal Processing
Outer-loop controller Observer feedback Observer + controller
12-bit quantization -62.5 dB -85.7 dB -90.5 dB
24-bit quantization -62.5 dB -93.9 dB -115.0 dB
Table 1: Contribution of the feedback components to the perturbed system.
duced by the sampling process of the filter’s output. The simulation results show that the performance of the closed-loop system strongly depends on these errors: when the feedback measurement is quantized to 12 bits, the quantization error is 2-13 (~ –78 dB) and the FFT estimate of the tracking error is roughly the same for both the perturbed and the unperturbed cases. To evaluate separately the contribution of each feedback component to the perturbed system, we present the results of three different simulations in Table 1. We construct three different feedback paths (one using only the outer-loop controller, one using only the observer component and one using both) and we estimate the FFT of the tracking error assuming 12-bit and 24-bit sampled outputs (the test input corresponds to the chirp signal described in Section 3). As Table 1 shows, much of the performance enhancement comes from the observer feedback that keeps the local response prediction reasonably accurate. However (Figure 7), the use of the observer with the nominal system degrades the performance since the measurement contains an error while the model does not. This observation is consistent with the theoretical expectations (Kalman filtering) where the optimal observer gain for accurate models and noisy measurements approaches zero. Table 1 also shows that with the use of an observer the dominant contribution to the responses comes from the quantization error. Finally, note that the feedback controller alone does not have the necessary bandwidth to attenuate the error down to the quantization level; the controller adds a few dB of performance by “centering” the low frequencies a little better. Additionally to the FFT estimate of the spectral ratio of the tracking error and the filter output, we estimate the total harmonic distortion (THD) introduced by the proposed system to an input sine with frequency of 1 KHz. The amplitude of the selected sine is set to half the amplitude of the u[k] commands (Vsine=½) to avoid saturation effects within the simulated system. The THD used here is defined as the ratio Uh/U1, where U1 is the root-mean-square value of the 1 KHz sine and Uh is the rms value of its harmonics (with frequencies up to 1 MHz) at the output of the system. The main results (for the 1-SA algorithm) are as follows: the feedforward algorithm alone features THD of approximately 1.09x10⁻³ %, while the use of feedback can reduce the THD down to 1.08x10⁻³ %, even in the presence of perturbations. When quantization (16 bits) was introduced to the feedback path, the THD was measured at 1.44x10⁻³ % for the perturbed system (and 1.43x10⁻³ % in the nominal case). Similar THD behavior was measured with sine waves of various frequencies within the range 0.1–10 KHz. In all cases the THD is less than 0.01%. Specifically, for the closed-loop system with 16-bit quantization feedback, we have 1.24x10⁻³ % THD at 0.1 KHz. This distortion increases, roughly, by almost 10-3 % every thousand Hz to reach 0.01% at 10 KHz. The aforementioned THD results show that the proposed solution can achieve improved performance compared to hitherto published techniques. The technique in [9] requires less hardware resources (the hardware requirements of the 1-SA and 2-SA algorithms are given in the following section 5), but leads to 0.2% THD, which is an order of magnitude worse than the results presented above. The Narrow Pulse Elimination PWM in [2] uses a low-cost FPGA and leads to experimental results of 0.07% THD. Such performance is clearly inferior to the performance of the proposed technique (when the authors in [2] assume ideal power switches, they report THD levels comparable to our work, i.e. they report 0.004% THD for a 7 KHz tone). A similar comparison can be done with [20], where the PWM controller shows THD levels below 0.07% within the 0.02–20 KHz bandwidth (however, even the best results in [20] show THD > 0.01% for frequencies higher than 2
Circuits Systems & Signal Processing
KHz). The complete digital amplifier in [16] results in 0.02% THD for the 1 KHz sine input (when feedback is also used), which is an order of magnitude worse than the results of the previous paragraph. As a final comparison, we note that the PWM digital correction scheme in [14] leads to 0.006% THD of the 1 KHz test tone; this result, albeit better than the rest of the literature results mentioned here, is still worse than the THD values of the proposed solution.
5. HARDWARE IMPLEMENTATION & COMPLEXITY The question following the theoretical analysis and the simulation results of the proposed DAC is regarding the cost of its implementation in hardware. In this section we focus on the complexity of the hardware implementation of the algorithm, since the cost of the output’s analogue filter depends on the user’s choice of the analogue components. To study its complexity we developed a digital system on the FPGA Altera Stratix 2 EP2S90 [1]. We concentrated our attention on realizing efficiently the proposed inner-loop algorithms. More specifically, we developed and incorporated various architectures for the 1-SA and 2-SA algorithms and we studied the area-speed (cost-quality) tradeoff of the DAC’s digital subsystem. In this section we present and discuss the most indicative of our implementation results. The digital subsystem consists of an oversampling filter, a dither/quantization module and an open-loop estimator module, which carries out the computations of the m-SA algorithm. The overall system architecture is depicted in Figure 8. The oversampling filter is designed as a cascade of lowpass interpolating filters [10]. The modification of the oversampling factor can be accomplished by simply adding (or removing) interpolating units to the cascade according to the desired cost of the DAC. In our study, we have used a basic oversampling factor of 256 realized by five interpolating filters (partial factors: x2, x2, x4, x4, x4) with each filter varying from 256 to 64 taps. This design occupies 1498 ALUTs (or 5974 ALUTs if we do not make use of the FPGA’s dedicated multipliers) and generates a PCM audio signal at 11.3 MHz. The addition of one or two small interpolation units to the basic datapath increases the audio signal frequency to 22.5 MHz, 45.1 MHz and 90.3 MHz (with a moderate cost of 270 to 491 ALUTs). The dither module [21] generates 8-bit random numbers distributed according to a triangular probability density function (with the use of 16 32-bit wide LFSRs). The Estimator module (Figure 8) corresponds to the proposed m-SA algorithm: it estimates the response of the following analog components to the {1, 0, -1} pulses and then it compares these estimations to the current sample of its input signal. As a result of this calculation, the estimator forwards the pulse leading to the best match of the input-output signals, and it updates the known state vector of the output filter according to the selected pulse (it keeps track of the filter’s state). All the above calculations constitute the implementation of the equations (5) and (6) described in Section 2. In the case of the 1-SA algorithm, the values of the matrices Φ and P are pre-calculated and can be supplied to the estimator module at any time during the process (e.g., when a modeling error correc-
FPGA
PCM audio 16-bits 44.1 KHz
Dither
Oversampling Filters
+
Quantizer
Estimator
Figure 8: Architecture of the implemented digital system
Output Filter
Circuits Systems & Signal Processing
tion occurs). Similarly, the values CΦ and CP are pre-calculated and supplied to the estimator (to avoid redundant multiplications within the module). In the case of the 2-SA algorithm, the precalculated values supplied to the estimator module are the matrices ΦΦ, ΦP, P, CΦΦ, CΦP and CP, because in this case the algorithm estimates x[k+2] instead of x[k+1]. The straightforward implementation of the 1-SA algorithm (Figure 9) consists of a vector multiplier (i.e. two 16-bit multipliers and an adder) to calculate CΦx[k] and two vector multipliers to calculate Φx[k]. The CΦx[k] value is subtracted from the input sample and three-way combined with CP (i.e. +1/0/-1) to produce three estimation errors. The minimum absolute error is used to decide the value of the output pulse (we compare the values within COMP) and the addition/subtraction of P to Φx[k], which determines the next filter state x[k+1]. The straightforward implementation of the 2-SA algorithm is based on the same data flow graph with the 1-SA architecture. The 2-SA’s implementation differentiates mainly with respect to the selector component, which processes nine distinct estimation errors instead of the three processed in the 1-SA case: the COMP is realized by a nine-input comparator tree with registers at its input level (the 2-SA algorithm generates two output pulses every other cycle). The results of implementing the 1-SA and 2-SA −as described above− are shown in the first two rows (“1-SA straight” and “2-SA straight”) of Table 2. Note here that, the ALUTs count considers the multipliers as part of the FPGA logic, i.e. the multipliers do not utilize DSP blocks. According to these results, the 2-SA estimator shows a 21% increase at the output pulse frequency at the expense of 34% extra ALUTs. The frequency increase deteriorates mostly due to the use of the comparator tree (asynchronous path). The main reason of increasing the resources’ requirement by 34% is the complexity of the 2-SA selector component. The higher frequency of the output pulse-train and the simulation results of Section 3 render the 2-SA a better solution than 1-SA when the hardware cost (VLSI area) is not a critical issue. The straightforward implementations achieve a maximum of 73 MHz pulse frequency implemented on an EP2S90 FPGA device. To achieve the simulated 90 MHz, we used two distinct paral-
Figure 9: Straightforward implementation of the 1-SA algorithm
Circuits Systems & Signal Processing
FPGA Resources multipliers registers ALUTs (total) 1-SA straight 6 194 1612 2-SA straight 6 360 2155 1-SA parallel 6 259 2050 2-SA parallel 6 420 2701 1-SA economy 2 260 1079 Architecture
Pulse Frequency (MHz) w/o DSP blocks w/ DSP blocks 57 66 69 73 99 104 86 95 28 33
Table 2: Implementation results for five different architectures of the estimator module
lelization techniques. In the 1-SA case, we designed a 2-stage pipeline (Figure 10). The first stage computes the next filter state x[k+1], while the second stage generates the output pulse u[k]. This arrangement allows the partition of the u[k] computation path into two shorter paths (stage 1, stage 2), and thus it leads to the increase of the operating clock frequency. The resulting data flow though, must preserve the dependencies between u[k] and x[k+1]. To allow the computation of x[k+1] to use the proper value u[k], we use the following idea: the y[k+2] estimations begin at the first stage with an assumption of the value of the u[k] pulse (0,1,-1). During the next clock cycle, the first stage computes x[k+2], while the second stage uses three distinct selector components processing each assumption of the previous cycle separately. The actual u[k] (stored previously in a special purpose register) defines the correct selector, which in turn defines u[k+1]. To initiate the process, we arbitrarily set the u[0] pulse to zero. The parallelization of the 2-SA algorithm bases on a modification of the comparison tree (within COMP): every pair of estimations is compared independently (all in parallel) and the result is generated by simple AND-trees with shorter asynchronous paths.
Figure 10: Pipelined implementation of the 1-SA algorithm
Circuits Systems & Signal Processing
The implementation results of the two parallel architectures are shown in the third and fourth row (“1-SA parallel” and “2-SA parallel”) of Table 2. In terms of hardware resources, the “2-SA parallel” implementation shows a 32% greater resource occupation compared to the “1-SA parallel”. However, the 2-SA algorithm yields better performance according to the simulation results of Section 3. Regarding the cost increase with respect to the straightforward implementations, both parallelization techniques result in an increase of the occupied ALUTs by approximately 26%. Taking into account the improvement of the performance due to the increased frequency of the output pulse-train, this extra cost should be considered reasonable. Finally it is worth mentioning that in applications targeting lower output pulse frequencies and/or reduced hardware cost, different techniques should be used for the design of the estimator module. One approach is to use one vector multiplier to compute both CΦx[k] and Φx[k], i.e. perform one 1-SA prediction every four clock cycles (three multiplication cycles and one comparison cycle). The fifth row of Table 2 (“1-SA economy”) shows such an example implementation for pulse frequencies of up to 33 MHz (the maximum clock frequency is 132 MHz). Notice that this design shows a cost reduction of 33% compared to the straightforward implementation.
6. CONCLUSION Targeting high-fidelity audio applications, this paper has presented a method for designing digitalto-analogue converters which also can be efficiently utilized in digital amplifiers for audio signals. The proposed design technique is characterized by a look-ahead algorithm estimating the exact output of the switching devices and the low pass filter of the architecture. At each time instant, the algorithm generates the digital pulse, which will drive the filter to output the most accurate approximation of the input signal. The algorithm bases its estimations on prior knowledge of the model parameters. In cases where these parameters cannot be modeled with high accuracy, we have shown that the proposed algorithm can be supported by specifically designed feedback control units. The use of control-theoretic algorithms in switching amplifiers for audio and multimedia applications introduces many interesting theoretical issues. The extended research that has been conducted in the field of Control Theory can give rise to new approaches to the solution of problems inherent in switching amplifier systems. Although the computational complexity of this approach is significant for the available hardware capabilities, it is lower than pure feedforward schemes and can be implemented at higher sampling rates. Our experiments show that even with a non-optimal implementation it can produce high performance results, comparable or better to the current stateof-the-art. On the other hand, the integration of output feedback and observer structures in the algorithm, provide graceful performance deterioration to model uncertainty, component variability, and reduction of the sampling rate.
REFERENCES [1] [2]
[3]
Altera Stratix Devices, http://www.altera.com/products/devices/stratix/stx-index.jsp V. M. E. Antunes, V. F. Pires, J. F. A. Silva, Narrow Pulse Elimination PWM for Multilevel Digital Audio Power Amplifiers Using Two Cascaded H-Bridges as a Nine-Level Converter, IEEE Trans. on Power Electronics, 22 (2), 425-434, 2007. J. B. Burl, Linear Optimal Control. H2 and H∞ methods, Addison-Wesley Longman Inc., Menlo Park, CA, 1999.
Circuits Systems & Signal Processing
[4] [5] [6] [7]
[8] [9]
[10] [11]
[12]
[13] [14] [15]
[16]
[17] [18] [19] [20] [21]
J. L. Dawson, T. H. Lee, Feedback Linearization of RF Power Amplifiers, Kluwer Academic Publishers, Boston, 2004. A. Floros, J. Mourjopoulos, Analytic Derivation of Audio PWM Signals and Spectra, J. Audio Engineering Soc., 46 (7/8), 621-633, 1998. A. Floros, J. Mourjopoulos, Distortion-free 1-bit PWM coding for digital audio signals, EURASIP J. on Applied Signal Proc., 2007 (1), 2007. A. E. Ginart, R. M. Bass, W. M. Leach, T. G. Habetler, Analysis of the class AD audio amplifier including hysteresis effects, IEEE Trans. on Power Electronics, 18 (2), 679685, 2003. J. Goldberg, M. B. Sandler, New results in PWM for Digital Power Amplification, Audio Engineering Soc., Convention, August 1990, preprint 2959 B. H. Gwee, J. S. Chang, H. Li, A micropower low-distortion digital pulsewidth modulator for a digital class D amplifier, IEEE Trans. on Circuits and Systems II: Analog and Digital Signal Proc., 49 (4), 245-256, 2002. M. J. Hawksford, W. Wingerter, Oversampling Filter Design in Noise-Shaping Digitalto-Analog Conversion, Journal Audio Engineering Soc., 38 (11), 845-856, 1990. R. E. Hiorns, R. G. Bowman, J. M. Goldberg, M. B. Sandler, Developments in realizing an all digital power amplifier, Audio Engineering Soc., Convention, Paris, February 1991, preprint 3034 J. W. Jung, M. J. Hawksford, An oversampled digital PWM linearization technique for digital-to-analog conversion, IEEE Trans. on Circuits and Systems I: Regular Papers, 51 (9), 1781-1789, 2004. T. Kailath, Linear Systems, Prentice Hall, Englewood Cliffs, NJ, 1980. P. Midya, B. Roeckner, S. Bergstedt, Digital correction of PWM switching amplifiers, IEEE Power Electronics Letters, 2 (2), 68-72, 2004. K. Nielsen, A review and comparison of pulse-width-modulation (pwm) methods for analog and digital input switching power amplifiers, Audio Engineering Soc., Convention, February 1997, preprint 4446. C. Pascual, Z. Song, P. T. Krein, D. V. Sarwate, P. Midya, W. J. Roeckner, High-fidelity PWM inverter for digital audio amplification: Spectral analysis, real-time DSP implementation, and results, IEEE Trans. on Power Electronics, 18 (1), 473-485, 2003. M. S. Pedersen, M. Shajaan, All digital power amplifier based on pulse width modulation, Audio Engineering Soc., Convention, Amsterdam, February 1994, preprint 3809. P. Pribyl, The non-linear distortion in class D amplifiers, Audio Engineering Soc., Convention, February 1991, preprint 3035. P. Pribyl, Spectral Represantation of a PCM-PWM Digital Power Amplifier, 88th Convention of the Audio Engineering Soc., preprint 2920, March 1990. K. M. Smith, Z. Lai, K. M. Smedley, A new PWM controller with one-cycle response, IEEE Trans. on Power Electronics, 14 (1), 142-150, 1999. R. A. Wannamaker, S. P. Lipshitz, Time-Domain Behavior of Dithered Quantizers, Audio Engineering Soc., 93rd Convention, October 1992, preprint 3418.