Nuclear Mathematical and Computational Sciences: A Century in Review, A Century Anew Gatlinburg, Tennessee, April 6-11, 2003, on CD-ROM, American Nuclear Society, LaGrange Park, IL (2003)
“The submitted manuscript has been authored by a contractor of the U.S. Government under contract DE-AC05-00OR22725. Accordingly, the U.S. Government retains a nonexclusive, royaltyfree license to publish or reproduce the published form of this contribution, or allow others to do so, for U.S. Government purposes.”
A NEW APPROACH FOR CALCULATING AVERAGE CROSS SECTIONS IN THE UNRESOLVED ENERGY REGION L. C. Leal and M. E. Dunn Oak Ridge National Laboratory Oak Ridge, TN 37831 US
[email protected];
[email protected] ABSTRACT A novel approach for calculating average cross sections in the unresolved resonance region is proposed. The methodology is based on the well-known probability table technique. Two new features are added to the probability table method in the way the energy level spacing is sampled: firstly, a constraint is imposed in the sampling of the energy level spacing, that is, in addition to sampling from a Wigner distribution the ∆3 statistic test of Mehta-Dyson is also added; secondly, instead of generating a sequence of level spacing in a energy range (ladders) in the present method the level of spacing is sampled around a reference energy. The methodology was implemented and tested in a computer code named URR (Unresolved Resonance Region). It has also been incorporated in the codes RACER and AMPX. Key Words: cross section, unresolved, probability table
1. INTRODUCTION The formalism developed based on the R-matrix theory for treating the resonance in the resolved resonance region cannot be utilized when the average resonance width is of the order or larger than the average level spacing. One cannot determine suitably the resonance parameter for an individual resonance but rather resonance parameter, which would represent a cluster of resonance. For instance, for the fissile and fertile nuclides the unresolved energy region starts in the keV region and extends up to few hundreds keV. An alternative for representing the cross section in the unresolved region would be to use a pointwise tabulation. However this approach would imply an overwhelming amount of data storage. The formalism mostly used for calculating cross sections in the unresolved energy region is based on calculations done using average resonance parameters. The calculation is expected to include the Doppler and the self-shielding effects, which are important effects in the determination of reactor multiplication factors. The calculation of average resonance parameters is based on the statistical distributions of the resonance parameters. A computer code named URR (Unresolved Resonance Region) [1] was developed to study the effect of various assumptions on the statistical distributions of unresolved resonance parameters on the calculation of self-shielding factors and self-indication ratios. The code uses the Monte Carlo method to generate probability tables for calculating of average cross sections. The self-shielding factors are calculated using the Bondarenko formalism. All cross section calculations are done based on the single-level Breit-Wigner approximation. The calculations can be done at a specified energy, temperature and cross section dilution. The main characteristic of the URR code is that, contrary
L.C Leal and M. E. Dunn
to existing probability table codes, the resonance energies are not sampled from consecutive points on a statistical ladder, but rather pairs of resonance are generated around the energy of interest. This method has been implemented in the computer codes RACER [2,3] and AMPX [4]. In addition to the modification in the sampling of the energy level spacing the resonance energies generated are also compared with the corresponding energy levels on the ∆3 statistic test of Mehta-Dyson. 2. BRIEF OVERVIEW OF THE THEORETICAL DISTRIBUTIONS OF THE RESONANCE PARAMETERS 2.1 LEVEL SPACING DISTRIBUTION LAW The spacing between two consecutive resonance energies for the same total angular momentum and parity exhibits random behavior. For a set of n resonance energy levels, E1, E2,..., En , where the level spacing between two consecutive energies, Ek and Ek-1 , is Dk, and the average level spacing is , the probability distribution function predicted by the Wigner law[5] is p(x) dx '
πx π x2 exp (& ) d x, 2 4
(1)
where x ' Dk / < D > , and is the average level spacing. The Wigner probability distribution function has the following property: 4 4 p(x) dx ' x p ( x )d x ' 1 . m m 0
(2)
0
The second moment of the Wigner distribution is given by x2 '
4 2 4 x p ( x )d x ' . m π
(3)
0
Equation (1) was the first mathematical prediction of the level spacing distribution to provide excellent agreement with experimental results; it has triggered a series of investigations on the subject of the statistical distribution of resonance parameters. Although other accurate level spacing distributions have been proposed, Wigner’s law is the most widely used and is suitable for practical applications. 2.2 RESONANCE WIDTH DISTRIBUTION LAW Systematic measurements of the resonance widths show strong fluctuations among resonances of the same angular momentum and parity. The definition of resonance width involves two other quantities, namely the reduced widths, γλc , and the penetration factor, Pc , which are related according to the equation American Nuclear Society Topical Meeting in Mathematics & Computations, Gatlinburg, TN, 2003
2/9
A New Approach for Calculating Average Cross Sections
Γλ ' j ( 2 Pc ) γλ c , 2
(4)
c
where λ refers to the energy levels in the compound nucleus and c refers to the particle channel. One should expect that the fluctuations are connected to either the reduced widths, γλc , or to the penetration factors, Pc. However, it is improbable that the fluctuations are due to the penetration factors since they are smooth functions of energy. Therefore, the observed fluctuations are caused by the reduced widths, γλc; these, in turn, are related to the projection of the eigenfunctions of the Hamiltonian of the compound nucleus on the nuclear surface. This projection involves an integration of many uncorrelated contributions, positive and negative, over the high-dimensional phase space of the compound nucleus. It then follows from the central limit theorem that the distributions of 2 γλc have a Gaussian distribution with zero-mean. Therefore, the distribution function of the reduced widths can be written as 1
P ( γλ c ) d γλ c ' 2π 2
2
exp( &
2 < γλ c>
γλ c 2
2
) d γλ c ,
(5)
2
where is the average value of γ λ c . The probability distribution function of the resonance widths, Γλ ,can be derived from Eq. (3) as follows: The statistical theorem states that if y is a variable that is the sum of squares of ν normally distributed zero-mean independent variables, then y is distributed according to a χ2 distribution with ν degrees of freedom. Therefore, the distribution of Γλ is ν pν (x) d x ' (ν x /2) 2 G (ν/2 )
ν &1 2
exp ( & νx / 2) d x ,
(6)
where x ' Γλ / < Γ > , G ( ν / 2 ) is the mathematical gamma function, and < Γ > is the average value of the width taken over a given energy range. For ν ' 1 , Eq. (6) is the well known as the PorterThomas[6] distribution law of the neutron width. It is generally accepted that fission is a fewchannel process, and that there are only a limited number of effectively open channels; 2 or 3 degrees of freedom (ν ' 2 or ν ' 3) are usually assumed in the fission width distribution. In the neutron capture event, a large number of capture channels are opened; the gamma width distribution is represented by a χ2 distribution with a large number of degrees of freedom ( ν64 ) ,which corresponds to a Dirac-delta function centered at Γγ ' < Γ > . The χ2 distribution function has the following property:
American Nuclear Society Topical Meeting in Mathematics & Computations, Gatlinburg, TN, 2003
3/9
L.C Leal and M. E. Dunn
4 4 pν (x) d x ' x pν (x) d x ' 1 . m m 0
(7)
0
The second moment of a χ2 distribution with ν degrees of freedom is given as
x2 '
4 2 2 x pν (x) d x ' % 1 . m ν
(8)
0
2.3 DYSON AND MEHTA LONG-RANGE CORRELATION OF ∆3 STATISTICS TEST The ∆3 statistics test, introduced by Dyson and Mehta, [7] provides a measure of the mean-square deviation between the number of observed energy levels in the energy interval Ei to Ef and the best fit to the straight line, as a function of energy, given as a E % b . Strictly speaking, the definition is Ef
1 ∆3 ' Min N(E) & aE &b (a , b) 2 L m
2
dE
,
(9)
Ei
where N(E) is the corresponding cumulative number of energy levels as a function of energy. The Dyson and Mehta ∆3 test predicts that the theoretical average value is given as < ∆3 > '
1 ln (n) & 0.0687 , π2
(10)
with variance V∆ '1.169/π4 . Here n is the number of energy levels observed in the interval Ei to 3
Ef . For practical applications, the coefficients a and b in Eq. (9) are determined according to the following conditions: M ∆3 Ma
' 0,
(11)
and American Nuclear Society Topical Meeting in Mathematics & Computations, Gatlinburg, TN, 2003
4/9
A New Approach for Calculating Average Cross Sections
M ∆3 Mb
' 0.
(12)
These conditions lead to the following equations: Ef
Ef
Ef
a E dE % b E dE ' N(E) dE , m m m 2
Ei
Ei
(13)
Ei
and Ef
Ef
Ef
a E dE % b dE ' N(E) dE . m m m Ei
Ei
(14)
Ei
The following identities will be used in evaluating a and b: Ef
m
d E ' Ef & Ei ,
(15)
Ei
Ef
m
2
2
E d E ' ( Ef & Ei ) / 2 ,
(16)
Ei
and Ef
m
3
3
E 2 d E ' ( Ef & Ei ) / 3 .
(17)
Ei
If the energy levels in the range Ei to Ef are numbered from l ' &L to l ' %L , then the following relations also hold: Ef
m Ei
El%1
N(E) dE ' j l d E ' j l ( El % 1 & El) , l'&L m l'&L %L
%L
(18)
El
American Nuclear Society Topical Meeting in Mathematics & Computations, Gatlinburg, TN, 2003
5/9
L.C Leal and M. E. Dunn
Ef
N(E) E dE ' j m %L
l'&L
Ei
El % 1
l E d E ' j l ( E l % 1 & El ) / 2 , m l'&L %L
2
2
(19)
El
and Ef
N 2 ( E ) E d E ' j l 2 (E l % 1 & El ) . m %L
(20)
l'&L
Ei
The system of Eqs. (13) and (14) can be written as α1 a % β1 b ' γ1
(21)
α2 a % β2 b ' γ2 ,
(22)
and
in which the Greek symbols are defined as 3
3
α1 ' ( E f & E i ) / 3 ,
2
2
α2 ' β1 ' ( E f & E i ) / 2 ,
(24)
β2 ' E f & E i ,
(25)
γ1 ' j l ( E l % 1 & El ) / 2 ,
(26)
γ2 ' j l ( E l % 1 & El ) .
(27)
2
2
l
and
(23)
l
American Nuclear Society Topical Meeting in Mathematics & Computations, Gatlinburg, TN, 2003
6/9
A New Approach for Calculating Average Cross Sections
The solution for a and b is then γ1 & γ2 β1 / β2
a '
α1 & α2 β1 / β2
,
(28)
and b '
γ2 β2
&
α2 γ1 & γ2 β1 / β2 β2 α1 & α2 β1 / β2
.
(29)
Substituting these definitions into Eq. (9) leads to the expression for the ∆3 test: 1 ∆3 ' Ef & Ei
Ef
m
N 2 ( E ) d E & γ1 a & γ2 b ,
(30)
Ei
or ∆3 '
1 Ef & Ei
2 j l ( El%1 & El ) & γ1 a & γ2 b , %L
(31)
&L
where a and b are given by Eqs. (28) and (29), and γ1 and γ2 by Eqs. (26) and (27). 3. SAMPLING TECHNIQUE TO GENERATE RESONANCE ENERGY AROUND THE REFERENCE ENERGY For a reference energy E , as tabulated in the Evaluated Nuclear Data Files (ENDF), series of resonance surrounding the reference energy is selected from the probability distribution P(x)dx'xW(x)dx
(32)
where W ( x ) is the level spacing distribution law given in Eq. 1 (Wigner distribution). The sample variable x is defined as the ratio between the level spacing D and the average level spacing ( x = D / < D > ). The separation between the first two resonances around E is sampled from Eq. (32) and pair of resonances are assigned above and below E respectively as, E + sD and
E +( s − 1) D . The value s is a random number between 0 and 1 and is determined from a uniform distribution as p(x)'
dx s
American Nuclear Society Topical Meeting in Mathematics & Computations, Gatlinburg, TN, 2003
(33) 7/9
L.C Leal and M. E. Dunn
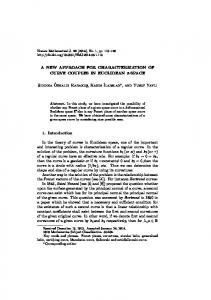
This procedure is repeated and more resonances are included around the reference energy. The total number of resonances (pairs of resonances) around the reference energy is arbitrary. While this method is very efficient for generation of the values needed for creating probability tables for cross section calculations it was originally developed for testing interference effects of the elastic channel in the cross sections. The long range interference effect in the elastic channel may require large numbers of resonance pairs around the energy of interest for the determination of the average cross sections. The resonance energy sequence sample as described is also tested with the Dyson and Mehta ∆3 test as indicated in Eqs. (3) and (4). The ∆3 test was successfully used in the evaluation of the 235U cross sections.[8] It is also included in the computer code SAMDIST[9] which is used for calculating statistical distribution of R-Matrix resonance parameters. To test the unresolved resonance methodology in the computer code URR, comparisons of the experimental average neutron cross section for 235U in the energy region from 3 keV to 20 keV is shown is Figure 1. The upper curve represents the total cross section measured by Harvey et al.[10], whereas the middle and bottom curves are respectively the fission and capture cross sections of Weston et. al.[11] Solid curves are the average calculations with URR and the vertical lines are the experimental data. The average input data used in the calculations are of an ongoing 235U unresolved evaluation done at ORNL. The URR result are excellent.
Figure 1. Comparisons of average cross sections calculated with the URR computer code with experimental data for 235U. Upper curve is the total cross section, middle and bottom curves are respectively fission and capture cross sections.
American Nuclear Society Topical Meeting in Mathematics & Computations, Gatlinburg, TN, 2003
8/9
A New Approach for Calculating Average Cross Sections
3. CONCLUSIONS This work describe a novel approach for calculating average cross sections based on the probability table method. Two new features are established in the way the energy level spacing of the resonances are sampled. The method has been implemented a computer code named URR and has also been included in major computer codes, such as RACER and AMPX. Comparisons of the average cross sections calculated with URR for 235U are compared with experimental results and the results are excellent. ACKNOWLEDGMENTS This work was sponsored by the Office of Environmental Management, U. S. Department of Energy, under contract DE-AC05-00OR22725 with UT-Battelle, LLC. REFERENCES 1. L. C. Leal, G. deSaussure, and R. B. Perez, “URR Computer Code: A Code to Calculate Resonance Neutron Cross-Section Probability Tables, Bondarenko Self-Shielding Factors and Self-Indication Ratios for Fissile and Fertile Nuclides,” ORNL/TM-11297, Martin Marieta Energy Systems, Inc., Oak Ridge National Laboratory (August 1989). 2. F. B. Brown and T. M. Sutton, “Monte Carlo Fundamentals,” KAPL-4823, Department of Energy - Office of Scientific and Technical Information (1996). 3. T. M. Sutton and F. B. Brown, “Implementation of the Probability Table Method in a Continuous-Energy Monte Carlo Code System,” International Conference on the Physics of Nuclear Science and Technology, p. 891-898, Long Island, New York, October 5-8, 1998. 4. M. E. Dunn and N. M. Greene, “AMPX-2000: A Cross-Section Processing System for Generating Nuclear Data for Criticality Safety Applications,” Trans. Am. Nucl. Soc., 86, 118-119 (2002). 5. E. P. Wigner, Conf. On Neutron Physics by Time-of-Flight, Gatlinburg, TN, 1956, ORNL-2309, Union Carbide Corp., Nucl. Div., Oak Ridge National Laboratory, 1957, pp. 59. 6. C. E. Porter and R. G. Thomas, “Fluctuations of Nuclear Reaction Widths,” Phys. Rev. 104, 483491 (1956). 7. F. J. Dyson and M. L. Mehta, “Statistical Theory of the Energy Levels of Complex Systems,” J. Math. Phys. 4, 701 (1963). 8. L. C. Leal, G. deSaussure, and R. B. Perez, “An R-Matrix Analysis of the 235U Neutron Induced Cross Sections up to 500 eV,” Nucl. Sci. Eng. 109, 1-17 (1991). 9. L. C. Leal and N. M. Larson, “SAMDIST: A Computer Code for Calculating Statistical Distributions for R-Matrix Resonance Parameters,” ORNL/TM-13092, Lockheed Martin Energy Research Corporation, Oak Ridge National Laboratory (September 1995). 10. J. A. Harvey, N. W. Hill, F. G. Perey, G. L. Tweed, and L. C. Leal, Proc. Int. Conf. On Nuclear Data for Science and Technology, Mito, Japan (May 30-June 3, 1988). 11. L. W. Weston, and J. H. Todd, Nucl. Sci. Eng., 88, 567 (1984).
American Nuclear Society Topical Meeting in Mathematics & Computations, Gatlinburg, TN, 2003
9/9