Journal of Computer Sciences and Applications, 2014, Vol. 2, No. 2, 36-39 Available online at http://pubs.sciepub.com/jcsa/2/2/4 © Science and Education Publishing DOI:10.12691/jcsa-2-2-4
A New Approach to Perform Regression Using Minimum Bounding Geometry Yousef Younes1,*, Jun Sang1, Ahmad Abdullah2, Ali Baddour1 1
School of Software Engineering, Chongqing University, Chongqing, P.R. China 2 School of Computer Science, Chongqing University, Chongqing, P.R. China *Corresponding author:
[email protected]
Received October 15, 2014; Revised November 22, 2014; Accepted December 02, 2014
Abstract Regression is the data mining process related to estimating a value for a given input by modeling the relationship between the predicators and the response. Choosing the most suitable regression algorithm is the center of big discussion in which the dataset always having the final decision. But when we studied different numerical datasets, we noticed that, data repetition over different intervals is a common property that could be found between any pair of attribute and class values. To exploit this property, this paper begins the journey of finding a new regression approach to address all numeric datasets. The new method uses the minimum bounding geometry to bound the data points in shapes which are used later to suggest values. From the suggested values we choose our targeted prediction value. When we tried this method on different datasets even with the circle as the bounding shape, the results were not perfect but encouraging enough to further elaborate the method. Besides that, the method showed a possibility to do other data mining tasks. Keywords: data mining, regression, minimum bounding geometry, classification, association rule discovery Cite This Article: Yousef Younes, Jun Sang, Ahmad Abdullah, and Ali Baddour, “A New Approach to Perform Regression Using Minimum Bounding Geometry.” Journal of Computer Sciences and Applications, vol. 2, no. 2 (2014): 36-39. doi: 10.12691/jcsa-2-2-4.
1. Introduction Regression is a typical data mining task. In which instances consisting of attributes and a class are used to build a model to be used for predicating the unknown class of a new instance whose attributes are fully or partially known [1]. To perform this task there are many algorithms but none of them are general. That is one algorithm might perform well on a dataset but on the other hand may perform bad when it is applied on another dataset. And the best algorithm to use depends only on the dataset. This introduces another problem called the algorithm selection problem, which is related to selecting the algorithm that performs the best on a given dataset [2], [3]. Now, we have two dependent problems which make the situation worse. Because for performing regression, we should apply one of the algorithm selection problems’ algorithms to pick up one regression algorithm, and then apply it on the dataset. If the regression algorithm selection was bad, that will give us a regression algorithm with bad performance on the dataset at hand. Considering the above mentioned discussion, wouldn’t be nice if we have one algorithm that could perform well on all datasets? Having such algorithm will eliminate dependency relationship between the regression problem and the selection of the regression algorithm problem. Furthermore it will remove the need to study and analyze each data set and could serve as a step towards the data
mining theory, which is supposed to organize the field and stop the current ad hoc situation in dealing with data mining problems [4,5]. This paper is not supposed to give the intended general best solution rather than it opens the door on a new way of thinking to tackle regression problem by providing one promising method in its infancy form and proving its feasibility by applying it on datasets of different sizes. The remaining of this paper is organized as follows. Section 2 overviews data mining and describe in hurry some prediction algorithms. Section 3 describes the new method and discusses the results obtained when applying it on a dataset with thoughts to widen the method usage. Finally, the paper concludes in section 4 with preliminary idea for future work to elaborate the method.
2. Literature Review This section starts by an overview of data mining then it discusses some of the most widely used Prediction algorithms. Although most of these algorithms are used for classification, they can be adapted to perform prediction.
2.1. Data Mining Background Data mining is the extraction of implicit and potentially useful information or interesting patterns from the data to help solve problems or make better decisions [6,14]. To perform its task, data mining uses different methods which
37
Journal of Computer Sciences and Applications
are usually described by being either descriptive, which aims to describe the data, or predictive, which tries to predict unknown values. Among those methods are the following typical ones: 1. Classification is a predictive task that works on categorical data. It learns a model from the data then uses that model for assigning a new instance to a predefined class, what is known as supervised learning [1]. 2. Association is the function that discovers the probability of the co-occurrence of items in a collection. The relationships between co-occurring items are expressed as association rules. Those association rules are no different from classification rules except that they can predict any attribute, not just the class, and this gives them the freedom to predict combinations of attributes. Since many association rules can be discovered in a small dataset. The attention is usually paid to the ones whose support is high and accuracy is good for the dataset at hand [6]. 3. Clustering is a descriptive process that divides the data into groups whose objects are similar to each other and different from objects in other groups. These groups are called clusters or classes. But unlike classification, these classes are not predefined so that clustering task is considered as an unsupervised learning method [7]. The data used in the aforementioned processes are usually stored in a dataset which is a collection of records called instances each of which consists of attributes and one or more classes. The dataset usually tends to be huge a property that makes performing a task time consuming and infeasible. To overcome this problem data reduction techniques are used to obtain a reduced representation of the data set that is much smaller in volume, yet closely maintains the integrity of the original data [1].
2.2. Regression Algorithms Regression also called numeric prediction and classification are two sides of the same coin. Except for that regression deals with continuous values to predict a value based on the given predicators. Different methods have been proposed to deal with numeric prediction. In this section we have tried to put together different regression methods. However, our goal is not to present all of them, some methods could not be referenced here. Linear Regression is the simplest kind of regression which models the relationship between an attribute and the class by a straight line whose equation is used to predict the class for a new instance. As an improvement of the linear regression, the multi-linear regression involves more than one attribute. Although, they perform well on linear data, both of them are not suitable for nonlinear data. To solve this problem, the nonlinear regression replaced the straight line by a curve. Again nonlinear regression does not work well on linear data [11]. Support vector machine is an algorithm that can be applied on linear and nonlinear data to perform both classification and prediction. It works by using nonlinear mapping to transform the training data into higher dimension in which data from two classes can be separated by a hyper plane. Although it is accurate, it is
extremely slow and touchy to the noise and outliers in the training data [8,12,13]. Back propagation is a neural network learning algorithm. In this method a neural network, a set of weighted connections between input and output units, learns by modifying the weights so as to be able to predict the correct class label or predicted attribute of the input instance. Although neural network may have complex structure, long training time, poor interoperability, it has high tolerance to noisy data and good accuracy [1,9]. K-Nearest-neighbor classifier can be used for prediction. It is based on learning by analogy, that is, by comparing a given test instance with k-training instances that are similar to it. To avoid the poor accuracy implied by giving all the attributes the same weight when performing comparison, techniques for attribute weighting and pruning of noise have appeared but the method still extremely slow in action [6].
3. The Method Our objective in this paper is to find a simple and general approach that could be applied on different datasets to perform regression. So we have to consider the differences and similarities between numerical datasets to use them in shaping the new approach by overcoming the differences and exploiting the similarities. In Typical numerical dataset, every attribute contributes in deciding the classes of its instance so the new method should allow every attribute to contribute in the final decision by giving its opinion then the final decision is derived from these opinions. On the other hand, one attribute value may have different class values and vice versa. A property better described as data repeat itself over different intervals, so instead of modeling the relationship between the attribute and the class using a line or curve, we tried to make use of the minimum bounding geometry, finding the minimum shape that bounds a set of given points, to define different areas that contains all the data points. These areas will be geometric shapes whose equations will be used to do prediction. To show the feasibility of our method we implemented a simple version in Matlab [15]. This version depends on the most representative unique values in the column to group the data, and then uses the circle to represent the repetitive nature of the data in each group separately. We applied it on three datasets the CPU, baseball, and tic datasets and calculated the Mean Average Error (MAE) for each execution. We also used Weka [10] to apply linear regression, k-nearest neighbor algorithms on those datasets using the same percentage for training set and documented the MAE for each execution. The execution of our method involves splitting the dataset into training set to build the model and testing set to test the built model. The following subsections explain every activity in details.
3.1. Separating the Data Set A good training set for our method, in this version, is one that contains every unique value in every column along with the max and min class values associated with that unique value. To select the training set with a specific percentage of the dataset, we use a build destroy strategy.
Journal of Computer Sciences and Applications
First, we select the perfect training set which contains every unique value in every column, and then we delete records from the selected training set randomly to meet the specified percentage. After that, the testing set is just the records in the dataset which are not selected to be part of the training set. In our experiment and for all the methods, we have chosen the training set as ninety percent of the dataset which leaves ten percent for the testing set.
3.2. Constructing the Model As we said, this model is a group of circles that bounds the data points. To build this model, we consider every attribute alone with the class, then we find the least number of circles that bound the 2D-data points in which the attribute values are the x-coordinates and the class values are the y-coordinates. To find these circles, every unique value in the attribute column at hand is studied to determine the most representative unique value whose range on x- and y-axes contain the biggest number of points. Then we draw the minimum bounding circle that surrounds those points. Now, the data points that fall inside the circle are removed from consideration and the same operation is applied again on the remaining unbounded data in the same attribute column. After finishing one attribute, another one is considered along with the class applying the same previous steps until all the training set data is bounded in circles.
3.3. Testing the Model To test the model against an instance, for every attribute value of that instance, we search in that attribute’s circles to find the appropriate circle whose center‘s x-coordinate value is the closest to the attribute value at hand. Then we determine the range of y values that puts the attribute value into the selected circle range. This is done by finding the intersection between the selected circle in the form as in Eq. 1 and a straight line as in Eq. 2. This line passes through the circle center and the point whose xcoordinate equals to the attribute value and y-coordinate equals to zero.
38
Where h and k are the center x, y coordinates respectively and r is the radius
= y
(2)
m*x + b
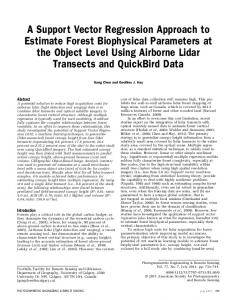
Where m is the slope of the line and b is a constant number. The result is a range of acceptable class values from that attribute point of view as shown in Figure 1. After we get an interval of candidate solutions from each attribute, we find the acceptable interval to all the attributes and the predicted value belongs to the accepted interval. The acceptable interval is not always the common one. Instead it is defined according to the dataset at hand. In our case, we choose the acceptable interval by taking the least minimum and maximum limit among all the candidate intervals. Finally, we choose the target class value to be the mid-point of the acceptable interval.
3.4. Results and Discussion Using the same percentage to select the training sets, we applied two different methods, in addition to ours, ten times on three different sized datasets. Since we are interested only in proving the rationality of our method, we chose the common mean average error as the metric and recorded the average of the ten executions in Table 1. Although, these results are not good enough from practical point of view, they are worthy from theoretical one. Because as we can see from Figure 2, the three methods has done their best on the tic database due to the large number of instances, whereas their execution suffered from high errors on the baseball dataset since it contains real numbers. Dataset Method Linear Regression K-Nearest Neighbor Our Method
Table 1. Experiment Results CPU Baseball
37.19 32.67 62.85
561.43 496.80 679.31
Tic
0.110441 0.099572 20.62
Figure 2. Graphical Representation of the results
Figure 1. Example of finding the candidate class interval for an attribute value
(x
− h) + 2
(y
− k) = r2 2
(1)
Using the circle, which has fixed radius on x- and yaxes, imposes an error on the results of our method. That implies using more advanced shape could give better results. However, comparing our method’s results to the others is like comparing the speed of a toddler to that of an adult, but it is important for two reasons. The first is that seeing our method as a toddler makes it very much promising since its results follow the same pattern and are not extremely different from those of the adults. The
39
Journal of Computer Sciences and Applications
second of which is that the documentation of these results is important to measure future improvements. More than a regression model, the model we have built could be used to perform other data mining tasks. For example to do classification, a class could be defined as a range of values on the y-axis and after finding the predicated value as described above. We just need to determine the range, i.e. the class, to which it belongs. Also, association rule discovery could be satisfied by finding the y-range associated with a given x-value of an attribute then using this y-range to find the associated xvalues of other attributes. When we are able to perform all the data mining tasks using this method with good results it will be the Swiss army knife for data mining.
References [1] [2]
[3] [4] [5] [6] [7]
4. Conclusion In this paper, we have introduced a new approach with simple implementation to perform regression. The new method uses the minimum bounding geometry to establish some kind of clustering on attribute level. The main idea behind this work was the repetition nature of the data over multiple intervals. We have also suggested some ideas to use this method for other data mining tasks such as classification and association. Results and ideas of this paper will definitely be a starting point for the further research to elaborate the method. As the title implies, this is an introductory step that needs a lot of effort before it reaches the maturity level that we want. The future improvements will focus on benefitting from advanced statistical concepts to group the data as well as on using other geometric shapes to bound the grouped data in order to improve the results and make the method the best choice for regression. Once we have achieved this goal we will move to address other tasks using the same method.
[8]
[9]
[10]
[11] [12] [13] [14] [15]
Han, Jiawei, Micheline Kamber, and Jian Pei. Data mining: concepts and techniques. Morgan kaufmann, 2006. G. Loterman, and M. Christophe, "Selecting accurate and comprehensible regression algorithms through meta learning." Data Mining Workshops (ICDMW), 2012 IEEE 12th International Conference on. IEEE, 2012. J. R. Rice. "The algorithm selection problem ". Advances in Computers, vol. 15, pp. 65-118, 1976. H. Mannila, "Theoretical frameworks for data mining." ACM SIGKDD Explorations Newsletter vol. 1, pp. 30-32, 2000. Q. Yang, and X. Wu. "10 challenging problems in data mining research." International Journal of Information Technology & Decision Making vol. 5, pp. 597-604, 2006. I. H. Witten, and E. Frank. Data Mining: Practical machine learning tools and techniques. Morgan Kaufmann, 2005. C. Shah, and A. Jivani. "Comparison of data mining clustering algorithms." Engineering (NUiCONE), 2013 Nirma University International Conference on. IEEE, 2013. L. Li, Z. P. Gao, W. Y. Ding, "Fuzzy Multi-class Support Vector Machine Based on Binary Tree in Network Intrusion Detection," Electrical and Control Engineering (ICECE), 2010 International Conference on , vol. , pp. 1043-1046, 2010. S. Ullah, Z. Hussain, "A two-step approach for improving efficiency of feedforward Multilayer Perceptrons network," Information and Communication Technologies, ICICT '09. International Conference on, vol. pp. 140-143, 2009. G. Holmes, A. Donkin, and I. H. Witten, "WEKA: a machine learning workbench," Intelligent Information Systems, 1994. Proceedings of the 1994 Second Australian and New Zealand Conference on , vol., no., pp. 357,361, 29 Nov-2 Dec 1994. S. Weisberg,” Applied linear regression,” 4th ed., New Jersey, John Wiley & Sons, 2014. AJ. Smola, B. Schölkopf, “A tutorial on support vector regression,” Statistics and Computing, Vol. 14, Issue 3, pp 199222, Aug 2004. L. Wang, “Support Vector Machines: theory and applications,” Vol. 177. Springer, 2005. M.Branmer, Principles of Data Mining, Springer, 2013. S. Chapman, “MATLAB programming for engineers,” Cengage Learning, 2007.