Jurnal Teknologi
Full paper
Assessment of Cost Escalation factors for Building and Civil Engineering Projects in Nigerian Construction Industry: a Multiple Regression Approach Nasiru Zakari Muhammada, Ali Keyvanfara*, Muhd Zaimi Abd Majida, Arezou Shafaghata, Aliyu Muhammad Maganab, Hasan Lawanc, Saeed Balubaida aConstruction
Research Centre (CRC), Institute of Smart Infrastructures and Innovative Construction (ISIIC), Faculty of Civil Engineering, Universiti Teknologi Malaysia, 81310 UTM Johor Bahru, Johor, Malaysia bBayero University Kano c Kano University of Science and Technology Wudil *Corresponding author:
[email protected]
Article history
Abstract
Received: 10 November 2014 Received in revised form: 23 January 2015 Accepted: 12 April 2015
Estimation of cost for building and civil engineering projects with minimum error at the conceptual stage of project development is crucial for planning. This paper evaluated the most significant cost escalation causing factors in building and civil engineering projects. Questionnaires were administered to clients, consultants and contractors to elicit information regarding their opinions with regard to these factors. Mean score value for each factor was determined. Also level of agreement of ranking of such factors between groups was investigated. The results of the analysis show that the most significant causes were the “Fluctuation of price of material” and “Variations” with the highest mean score values of 3.9 and 3.73 respectively. Also there was agreement in the opinions between all the groups with regard to these factors. A linear multiple regression models for the prediction of final cost of construction of building and civil engineering projects were developed using Statistical Package for Social Sciences (SPSS). Keywords: Cost escalation; factors; multiple regression models © 2015 Penerbit UTM Press. All rights reserved.
1.0 INTRODUCTION Manufacturing and other service industries are known to contribute more, yet construction industries also occupy significant position in the Nigerian economy [1]. Increase in the Nigerian population is accompanied with the growing need for infrastructure and other facilities. Critical areas in which construction industry plays a significant role for social needs are housing, education and industry. Increasing complexity of construction industry presents many challenges [2]. Dwindling economy which led to high inflation and delay related issues lead to construction cost overrun. These are the major problems affecting the construction industry in Nigeria as identified by previous researches [3-5]. These findings were supported by [6-9]. Some other nations in the sub-Saharan Africa faces similar challenge [10]. For example, in Ghana most of the projects executed between1970-1999 were completed at a cost more than the original budgeted amount [10]. And this has manifested in both large and small projects [4]. This poses fear to people aspiring to own shelter [11]. For example cost of a bag of cement has increased by 37% from 2006-2009[11]. However, an
improved efficiency in the building processes could lead to saving in the construction cost [11]. Cost escalation is the increase in the amount of money required to construct a given project above the initially budgeted sum. It arises if the actual cost of construction is in excess of the originally estimated amount [12-13]. Though some studies have cited the main causes of the delay, the factors responsible for the causes have not been critically addressed [14].Thus, projects are being completed at a cost higher than the initial budget [15]. This indicated an unsuccessful project delivery, since cost is relatively more important than quality in terms of build ability at design stage [11]. Twenty (20) variables responsible for delays and cost overrun in southern part of Nigeria were reported [6]. He further identified seven (7) other factors that are likely to cause high cost of construction without necessary having any delay. Also inaccuracy in the prediction of the actual cost of projects at the conceptual stages have been reported [16-18].Thus, such other areas which lead to high escalation of construction cost needs to be further investigated and assessed.
74:4 (2015) 85–91 | www.jurnalteknologi.utm.my | eISSN 2180–3722 |
86
Ali Keyvanfar et al. / Jurnal Teknologi (Sciences & Engineering) 74:4 (2015), 85–91
2.0 LITERATURE REVIEW Costs control is very critical issue in construction project management [19]. It is a phenomenon which is widely practiced by all construction stake holders. And needs to be carried out throughout the life of the project. Cost escalation has negative implications for both construction stakeholders and the industry in general [20]. To the client, it means less return on the investment. Since the project is now completed at a cost in excess of the earlier agreed sum. And to the end user, the added costs are passed on as higher rental/lease costs or prices. To the consultants, it means inability to deliver value-for-money and could tarnish their reputation. It may result in loss of confidence reposed in them by clients. To the contractor, it implies loss of profit through penalties for non- completion, and negative word of mouth that could jeopardize his/her chances of winning further jobs, if at fault. Therefore, projects successes affects all the construction stakeholders including government [21]. Factors responsible for the escalation of civil and building engineering projects were identified [6, 22-28]. They are: Fluctuation of price of materials, Variation, Government policies, Change of Government and political instability, Wrong method of estimation, Poor financial control on site, Long period between design and tendering time, Design errors, Lack of coordination between contractors and consultant, Poor supervision and lquidation Damages, Previous experience of contract, Inadequate production of raw materials, Effect of weather and Absence of of construction cost data Inaccurate projects cost estimation. The choice the study area was based on the new government policy of mass infrastructure such as hospitals, schools, houses and road network. Geographical location coupled with high level of commercial activities and other regional local factors were known to cause cost differential [29] of the states were also considered. The objectives of this study are to: (i) To carry out an in-depth investigation on the factors that contribute to the causes of cost escalation in the construction of building and civil engineering projects in of Nigeria. The research only considered such projects completed within the period 2003–2011 in Kano state. (ii) To rank the cost escalation factors according to their severity. (iii) To test the level of agreement in the perception of cost escalation factors between the various groups (principal participants)it is also the objective to develop a model, for predicting final cost of construction at the conceptual stage of project development. 3.1 Hypotheses Testing Test of agreement between the various groups (Clients/Consultants, Clients/Contractors, Consultants/Contractors) on the severity of factors of cost escalation in building and civil engineering projects was established as follows: HYPOTHESIS 1 (H1) H0: There is no significance difference between the perceptions of Clients and Consultants with regard to severity of factors responsible for cost escalation. HA: There is significance difference in the perception between Clients and Consultants with regard to severity of factors responsible for cost escalation. HYPOTHESIS 2 (H2) H0: There is no significance difference between the perceptions of Clients and Contractors with regard to severity of factors responsible for cost escalation.
HA: There is significance difference in the perception between Clients and Contractors with regard to severity of factors responsible for cost escalation. HYPOTHESIS 3 (H3) H0: There is no significance difference between the perceptions of Clients and Consultant with regard to severity of factors responsible for cost escalation. HA: There is significance difference in the perception between Clients and Consultants with regard to severity of factors responsible for cost escalation. 3.0 METHOD Descriptive survey method is adopted for this research it made use of qualitative data gathering through an in-depth literature review. Based on this, the study sought the opinion of respondents through questionnaire survey. The responses provided were subsequently analyzed. The research made use of stratified sampling technique. Respondents were randomly selected from the groups of clients, consultants and contractors. These three groups participated in the projects executed by Kano State government during the period 2003-2011. Thus, the unit of the analysis is a group of consultants, contactors and clients respectively. The questionnaire consists of three parts. First part deals with the personal information regarding the respondents’ characteristics such as academic qualifications, construction industry work experience and membership with Professional organization. Part two deals with such information as area of specialization, ages, and type of projects executed and services by each of the companies respectively. The last part of the questionnaire deals with such information on the factors responsible for the high cost of projects as perceived by respondents. The research made use of the 40 returned questionnaire out of the fifty seven administered. The respondents rated the variables which they perceived to be the likely contributing factors influencing cost of building and civil engineering projects by responding on a scale from 1 (most significant) to 6 (insignificant). The six-points Likert rating scale was 1 most significant, 2 more significant, 3 significant, 4 moderately significant, 5 fairly significant and 6 insignificant. This six point scale is used to calculate the mean score for each factor and element, which is then used to determine the relative ranking of each factor by assigning ranking to mean score, such mean score with low magnitude is assigned low ranks while those with the highest score is allocated the highest rank accordingly. The mean score (MS) for each factor, the level of agreement of ranking of such factors between contractors and clients, contractors and consultants and consultants and clients respectively and the multiple regression model were computed by using SPSS. 4.0 DATA DESCRIPTION AND ANALYSIS Sixty two (62) civil engineering and building projects initiated by Kano State government and completed between the period 2003 and 2011 were considered. The initial and final contract sums of public projects in Nigeria (in US Dollar) were presented in Tables 1 and 2 below respectively. The data with respect to the costs of various building and civil engineering projects considered were obtained from the Archives of Kano State Ministry of Works housing and Transport (KMOWH&T) and Kano Urban Development Authority (KNUPDA.
87
Ali Keyvanfar et al. / Jurnal Teknologi (Sciences & Engineering) 74:4 (2015), 85–91
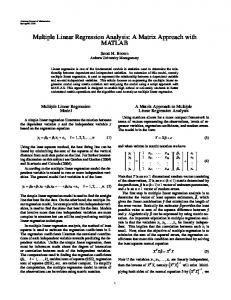
8211 9563 7252 7252 492 492 492 171565 23290 31093 36682 9864 13254 3920 3435 87227 87573 69588 65719 9361 8699 58435 60963 39345 39345 20503 18999 19300 16170 30645 35607 611700 550615 485581 49164 332083 34823 18329 10457 10995 13501 10048 13564 15072 15072 90429 10048 7536 8541 24277 26627 1707 1508 2327 2354 219451 212920 167202 166730 18246 10458 207896 269437 43880 51008 13994 13491 18350 18480 8533 10508 4957 3901 5113 6940 3976 3463 8215 11799 14978 12659 8533 4564 2292 2421 2316 2357 487 502 1508 1664 47809 40259 25675 20161 11304 19674 65870 75500 8518 8550 9513 7711 22564 22701 18496 19300 17240 17743 3675 3213 21811 24024 23015 20796 6589 5922 14744 14964 14225 14940 8954 10507 12870 15883 3172 3283 19298 18304 16732 17066 9709 11764 2018 2013 35525 40153 88350 515275 89860 90432 37576 37576 18295 19450 11964 13254 24292 34320 4526 4840 30645 35607 61170 55062 48558 24044 88586 80100 66121 64356 138725 317056 89882 116159 11799 13222 8213 11950 4913 3934 12869 11967 1005 1005 1507 1608 251 251 251 251 105407 108291 242451 2389677 46262 52751 247871 229401 43114 46933 21812 22314 14225 14335 22039 21605 69595 65023 44068 31213 11304 20095 75500 96064 70411 82592 219757 190453 22607 22607 97192 143916 41615 40651 31608 34389 26618 34321 3936 3459 4192 4524 3836 4262 4294 4023 5343 6810 5894 6197 3936 3438 8197 8960 4675 5718 7728 7227 88640 90841 40911 44127 26871 26168 64516 65720 2515 2629 1803 1877 2929 2929 5343 6810 5894 6197 3936 3438
The construction elements considered here are: Substructure, Frames, Floors, Roofs, Walls, Windows and Doors, Finishing, Fittings, Services. These elements are used as the variables X1, X2, X3, ………..X9 in the multiple regression model. The model predicts the final cost of the project.
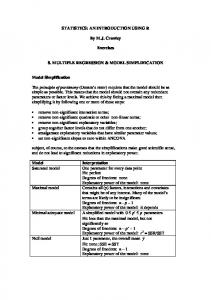
Table 2 Initial and final contract sums of road projects (Us Dollar) S/no
1 2 3 4 5 6 7 8 9 10 11 12 13 14 15
INITIAL SUMS 3155794 366626 245378 3106358 369577 314965 1279181 2525183 1474036 1784247 344895 496175 302405 744042 1243138
FINAL SUMS 4020588 386241 304949 3261332 419364 545624 1338012 2804930 1687862 2373794 370818 559276 480314 871679 1522253
INITIAL EARTH WORK 746965 68533 29236 508432 63710 76529 419252 118723 369163 401113 68735 221704 71506 251193 266308
FINAL EARTH WORK 850711 69587 39504 510662 79032 258010 450302 130076 391054 493849 70493 248307 202748 289302 394884
FINAL SERVICES
INITIAL SERVICES
FINAL FITTING
INITIAL FITTING
4579 29081 154957 56677 13702 37585 7536 28622 489494 49405 5092 1851 2761 11651 9717 35843 33513 150020 34513 29810 37104 13702 41938 10711 2261 496552 491546 21842 38202 62119 13236 18180 11373 113714 36624 18180
FINAL FINISHING
4696 23303 144906 58486 17681 40400 6029 27589 393618 39419 4555 2446 2761 16035 10256 34370 32411 17491 33818 29810 34069 17971 48301 14242 2010 496552 48146 27498 326830 64484 9720 17666 12377 99671 36848 17666
INITIAL FINISHING
FINAL WALLS
5332 29461 162444 50060 152206 53058 15072 28344 250508 45625 25026 69412 2095 63374 12216 29498 39413 19902 26836 80243 47131 152206 104654 19000 1507 167728 51855 76241 77861 60229 9220 13423 8434 75028 44383 13423
FINAL WIN- DOW/ DOOR
INITIAL WALLS
5195 32060 157355 48065 69804 494420 14067 23267 240297 43414 23284 30231 1858 69537 11815 30452 47132 18251 24322 77188 47131 70025 105926 21712 1507 167728 49161 84610 72259 55683 8457 12382 8229 72265 4399 12382
INITIAL WINDOW/DOOR
FINAL ROOFS
1 34905 4370 10328 103279 5629 5629 2 142719 172848 6741 9302 185826 28344 3 114663 123977 218446 238551 401316 470406 4 303087 308105 20018 20174 97370 106679 5 321397 329740 63618 62302 112765 126397 6 254981 280696 28543 39254 69488 87825 7 96810 99975 18438 20095 12560 16076 8 182460 190511 17435 18246 49544 5006 9 1615708 1837206 109444 118988 259555 3186707 10 289964 312611 46930 49542 839565 85061 11 561601 546555 7484 13237 12870 17239 12 129386 178618 18176 200005 46806 58332 13 21683 22448 3520 3684 518195 5204 14 376020 378348 82349 83354 57429 54325 15 82254 80718 17419 20003 18547 19012 16 243587 250464 38601 38857 78189 80054 17 243492 264430 38590 41806 78792 820565 18 112980 129924 9717 13253 28299 36784 19 196636 204881 32208 33513 58514 60872 20 70318 85407 62136 72087 124696 124696 21 214722 225229 6815 8976 67630 70005 22 404748 419303 63618 62302 112759 76159 23 775086 978740 146273 165997 91273 88480 24 193989 208307 48522 57432 83554 90346 25 10701 11052 3014 3014 1256 1256 26 1080942 1096931 101680 130249 119889 119889 27 339938 348707 59345 60714 82097 81796 28 585485 664841 105479 106681 71978 66823 29 692463 749198 97253 95576 80453 97987 30 397630 417509 53663 54416 120029 127927 31 51677 61002 9216 11763 11963 1397 32 102100 103784 8458 11721 48422 4745 33 75187 79892 11963 12139 22017 26040 34 906682 995843 193080 257642 320729 322606 35 58042 58977 3014 3281 6534 7193 36 100341 106673 24115 24969 11555 12761
INITIAL ROOFS
FINAL FRAMES
INITIAL FRAMES
FINAL SUBSTRACTURE
INITIAL SUBSTRACTURE
FINAL SUMS
S/no
INITIAL SUMS
Table 1 Initial and final contract sums of building projects (Us Dollar)
INITIAL SURFACE DRESSING 1750295 130035 97370 1800649 85154 81480 520881 2169788 627196 839735 182725 134097 76456 329067 441193
FINAL SURFACE DRESSING 2503473 147692 138084 1907398 119620 97768 520881 2418478 819560 1350674 197178 163598 92744 380290 467528
INITIAL DRAINGE& CULVERT 658534 168056 118772 797278 220712 156956 339048 236672 477677 543399 93435 140353 151932 163782 535637
FINAL DRAINGE& CULVERT 666404 168961 127361 843272 220712 189846 366830 256376 477248 529270 103147 147371 184822 202087 659842
88
Ali Keyvanfar et al. / Jurnal Teknologi (Sciences & Engineering) 74:4 (2015), 85–91 S/no
16 17 18 19 20 21 22 23 24 25 26
INITIAL SUMS 932155 1095631 550413 1441066 725837 648750 1969607 1564555 170811 669160 673505
FINAL SUMS 9898165 1153094 588881 1681846 792672 683471 2492846 1692108 196935 726557 833678
INITIAL EARTH WORK 115830 256375 113896 369899 138082 149116 472181 320430 10048 119777 120030
FINAL EARTH WORK 47874 491675 131733 540860 153311 167384 671398 378507 11052 128417 159576
INITIAL SURFACE DRESSING 410778 320587 135393 580665 320781 282433 820806 487625 50239 178414 310694
FINAL SURFACE DRESSING 400839 392434 156059 651487 359624 298057 1023300 540725 65310 198023 421709
INITIAL DRAINGE& CULVERT 405546 518669 301094 490501 266974 217202 676621 756500 35167 370970 242781
FINAL DRAINGE& CULVERT 541405 520178 301094 489499 279736 218029 798148 772876 40191 400116 252393
The construction elements considered here are: Earth work, Pavement work, Drainage and Culvert, Bridge. These are used as the variables X1, X2, X3, ………..X5 in the multiple regression model for the prediction of final cost of project.
5.0 RESULTS AND DISCUSSION
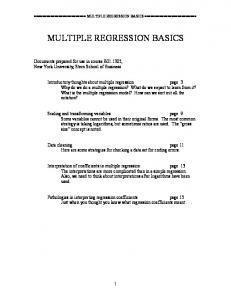
Table 4 Paired t-test value for road construction elements
Paired t-test result for difference between the initial and final contract sum of individual building construction elements is presented in the Table 3 and 4 below. And it can be seen from the Tables 3 & 4 that almost all cases, there is significant difference between the initial and final cost of construction for both building and civil engineering projects. This serves as a justification, to investigate the causes. The mean score value of these factors based on their severity, have been presented in Tables 5, 6 and 7 as perceived by individual group of respondents. They were also subsequently ranked accordingly. Also the aggregation of mean score values and rankings with regard to such factors as perceived by all groups of respondents are presented in Table 8. Factors considered in the research. i) Fluctuation of price of materials ii) Variation iii) Government policies iv) Change of Government and political instability v) Wrong method of estimation vi) Poor financial control on site vii) Long period between design and tendering time viii) Design errors ix) Lack of coordination between contractors and consultant x) Poor supervision and lquidation Damages xi) Previous experience of contract xii) Inadequate production of raw materials xiii) Effect of weather xiv) Absence of construction cost data Table 3 Paired t-test result for difference between the initial and final contract sum of individual Building construction elements S/no 1 2 3 4 5 6 7 8 9
DF All – 37 X1 – 36 X2 – 36 X3 – 36 X4 – 36 X5 – 36 X6 – 36 X7 – 36 8 – 36 X9 – 36
t cal 12.60 11.59 13.39 16.20 18.65 12.23 3.03 12.67 14.12 10.15
t
0.05 2.48 2.18 1.26 1.73 1.28 2.43 1.85 2.37 1.76 2.64
P-value 0.056 0.043 0.008 0.013 0.097 0.085 0.015 0.052 0.028 0.061
Remark Significant Significant Significant Significant Significant Significant Significant Significant Significant Significant
S/no 1 2 3 4
DF Y1 – 26 Y2 – 26 Y3 – 26 Y4 – 26
t
cal 14.465 25.693 28.611 -
t
0.05 1.158 0.016 0.298 -
P-value 0.258 0.987 0.768 -
Remark Significant Significant Significant -
Table 5 Respondents’ ranking of factors for cost escalation icontractors’ rating (N =14) S/No 1 2 3 4 5 6 7 8 9 10 11 12 13 14
FACTORS Poor financial control on site Fluctuation of price of materials Variation Design errors Government policies Wrong method of estimation Change of Government and political instability Long period between design and tendering time Poor supervision and lquidation Damages Previous experience of contract Lack of coordination between contractors and consultant Effect of weather Absence of construction cost data Inadequate production of raw materials
MEAN 1.9 1.7 1.5 1.3 0.99 0.97 o.95
RANK 1 2 3 4 5 6 7
0.93
8
0.91
9
0.88 0.87
10 11
0.61 0.53 0.49
12 13 14
89
Ali Keyvanfar et al. / Jurnal Teknologi (Sciences & Engineering) 74:4 (2015), 85–91
Table 6 Respondents’ ranking of factors for cost escalation consultants’ rating (n =13) S/No 1 2 3 4 5 6 7 8 9 10 11 12 13 14
FACTORS Fluctuation of price of materials Variation Government policies Change of Government and political instability Wrong method of estimation Poor financial control on site Long period between design and tendering time Design errors Lack of coordination between contractors and consultant Poor supervision and lquidation Damages Previous experience of contract Inadequate production of raw materials Effect of weather Absence of construction cost data
MEAN 1.09 1.05 1.03 1.02
RANK 1 2 3 4
1.01 0.98 0.95
5 6 7
0.92 0.91
8 9
0.89
10
0.77 0.75
11 12
0.73 0.70
13 14
Table 7 Respondents’ ranking of factors for cost escalation clients’ opinion (N =13) S/No 1 2 3 4 5 6 7 8 9 10 11 12 13 14
FACTORS Fluctuation of price of materials Variation Government policies Change of Government and political instability Long period between design and tendering time Poor financial control on site Design errors Poor supervision and lquidation Damages Wrong method of estimation Lack of coordination between contractors and consultant Inadequate production of raw materials Effect of weather Previous experience of contract Absence of construction cost data
MEAN
RANK
1.07 1.06 1.04 1.03
1 2 3 4
1.00
5
0.99 0.97 0.89
6 7 8
0.88 0.87
9 10
0.85 0.80 0.76 0.71
11 12 13 14
Table 8 Overall (aggregation) respondents’ ranking of factors for cost escalation based on the opinions of clients, consultants and contractors(n =40) S/No 1 2 3 4 5 6 7 8 9 10 11 12 13 14
FACTORS Fluctuation of price of materials Variaton Government policies Change of Government and political instability Poor financial control on site Long period between design and tendering time Wrong method of estimation Design errors Poor supervision and lquidation Damages Lack of coordination between contractors and consultant Inadequate production of raw materials Effect of weather Previous experience of contract Absence of construction cost data
MEAN 3.90 3.73 3.23 3.00
RANK 1 2 3 4
2.75 2.75
5 6
2.60 2.56 2.54
7 8 9
2.52
10
2.50 2.44 2.44 2.42
11 12 13 14
Table 9 Test of agreement on the ranking between the various groups on the severity index with regard to factors of cost escalation in building and civil engineering project Groups Clients / Consultants Contractors / Clients Consultants / Contractors
R s 0.27
t - cal
t- tab
1.30
1.13
Accept Ho Yes
P value
0.35
1.80
1.13
Yes
< 0.05
0.41
2.10
1.13
Yes
< 0.05
< 0.05
Thus, further analysis of factors from the Contactors’ opinion in the Table 5 shows that “poor financial control on site’’, “fluctuation of price of material’’ and “variation” Were the most significant factors responsible for cost escalation. This is based on their mean score values of 1.9, 1.7, and 1.5 respectively. They were then ranked accordingly as 1st, 2nd and 3rd. Table 6 shows that from consultants’ rating “Fluctuation of price of material: “variation” and ‘’government policy’’ were the major causes of cost escalation. Each with the mean score value of 1.09, 1.05and 1.03. Consequently they were ranked as 1st 2nd and 3rd most significant factors responsible for cost escalation in both Road and Building projects. As can be seen from Table 7 Clients’ have rated “Fluctuation of price of material”, “Variation” and ‘’Government policy ‘are the top most important factors responsible for escalation of construction cost. Each with the mean score value of 1.07, 1.06 and 1.04. Therefore, they were ranked as 1st, 2ndand 3rd important factors. In the final analysis, the aggregation in the overall perception of all the three groups (Clients, Consultants, and Contractors) from Table 8 shows that “Fluctuation of price of material” and “Variation” each with the mean score of 3.9 and 3.73 were the key factors responsible for cost escalation. They are therefore, ranked as 1st and 2nd most important factors Table 9 shows that there is no significant difference in the perception of Clients/Consultant, Clients/Contractors and Consultants/Contractors with regard to factors responsible for escalation of construction projects costs respectively. Also the linear multiple regression models for prediction of final cost of construction for both building and road projects from the conceptual stage of projects were developed and presented in equations (4.1) and (4.2).
5.1 Linear Multiple Regression Model Here SPSS was used to establish the relationship between the initial and final sums of building and civil engineering projects. Consequently multiple regression equation models were developed. Yi=b0 + b1X1 + b2X2+ ……..bnXn Where; Y1 = Final contract sum per square meter of floor area excluding preliminaries and Contingencies; Y2 = Final contract sum per kilo meter of road excluding preliminaries and Contingencies; b0 = Regression constant b1 = Regression coefficient for the construction element (Regression estimates) x(1-9) = initial contract sum of all the building construction elements (Independent variables)
90
Ali Keyvanfar et al. / Jurnal Teknologi (Sciences & Engineering) 74:4 (2015), 85–91
X(1-4) = initial contract sum of all road construction elements (Independent variables) Allowing for preliminaries and contingencies, the overall final contract sum becomes F=Y+P+C Where; F= Overall final contract sum The result of multiple regression analysis, using initial cost per square meter of floor area for building construction element as independent variables and final contract sum per square meter of floor area as dependent variables was established as follows;
Acknowledgement The authors would like to thank Research Management Center (RMC) at Universiti Teknologi Malaysia. Furthermore, special thanks to the Ministry of Science, Technology, and Innovation (MOSTI) for funding this research projects with vote no. 4S055, and PAS grants (vote no. Q.J130000.2709.01K40, and Q.J130000.2709.01K41).
References [1]
Y= b0 + b1x1 + b2x2 + - - - bnxn Y= 5.212E7 + 1.641x1 + 3.319x2 + 0.891x3 + 0.949x4 – 0.364x5 + 0.819x6 + 0.949x7 – 2.134x8 ……………. (4.1) The result of multiple regression analysis, using initial cost per kilometer for road construction element as independent variables and final contract sum per kilometer as dependent variables was also established as follows; Y= b0 + b1x1 + b2x2 + - - - bnxn Y = 2.32E6 + 1.178x1 + 1.068x2 + 3.189x3 ……………. (4.2) Hence; F=Y+P+C Where; F.Y.P.C and x-values were as earlier defined. 6.0 CONCLUSION Factors responsible for the cost escalation of building and civil engineering have been identified. These factors are: Fluctuation of price of materials, Variation, Government policies, Change of Government and political instability, Wrong method of estimation, Poor financial control on site, Long period between design and tendering time, Design errors, Lack of coordination between contractors and consultant, Poor supervision and liquidation Damages, Previous experience of contract, Inadequate production of raw materials, Effect of weather and Absence of of construction cost data Inaccurate projects cost estimation. The mean score values of these factors were determined and subsequently ranked accordingly. According to contractors’ rating “poor financial control on site’’, “fluctuation of price of material’’ and “variation” Were the most significant factors responsible for cost escalation each with mean score value of 1.9, 1.7 and 1.5 respectively. Consultants have rated “Fluctuation of price of material: “variation” and government policy as the major causes of cost escalation. Each with the mean score value of 1.09, 1.05 and 1.03. From the opinions of the individual group and also aggregation in the opinions of all the three groups, it could be concluded that ‘’Fluctuation of price of material’’ and variation were the major causes of cost escalation in the construction of building and civil engineering projects. Each with the mean score value of 3.9 and 3.73 respectively. The result of the hypotheses test shows that there was no significant difference between the perceptions of Clients/Consultants, Clients/Contractors and that of Consultants/Contractors with regard to factors responsible for cost escalation.
[2]
[3]
[4]
[5]
[6]
[7]
[8] [9]
[10]
[11] [12]
[13]
[14]
[15]
[16]
[17]
[18] [19]
[20]
Oladinin, T. O., Ogunsemi, D., R. and AjeI, O. 2012. Role of Construction Sector in Economic Growth: Empirical Evidences from Nigeria. Journal of the Environment. 7(1). Rosli Mohamad Zin, Krisen Moodley, Nigel Smith and Christopher Nigel Freece. 2008. Stakeholder Matrix for Ethical Relationships in the Construction Industry. Construction Management and Economics. 26(6): 625–632. Daniel C. Okpala1 and Anny N. Aniekwu. 1988. Causes Of High Costs of Construction in Nigeria. Journal of .Construction. Engineering and. Management. 114: 233–244. Majid, M. Z. A., Lamit, H., Zakaria, W. Z., Keyvanfar, A., Shafaghat A. 2012. Executive Information Site Management System For Monitoring Project Performance: System Requirement Study. International Journal of Sustainable Development. 3(3): 11–24. AjibadeAyodeji Aibinu1 and Henry Agboola Odeyinka. 2006. Construction Delays and Their Causative Factors in Nigeria. Journal of Construction. Engineering and. Management. 132: 667–677. Daniel, C. Okpala, Anny N. Aniekwu. 1988. Causes of High Cost of Construction in Nigeria. Journal of Construction Engineering and Management. 114(2). Yaw Frimpong, Jacob Oluwoye and Lynn Crawford. 2003. Causes of Delay and Cost Overruns in Construction of Groundwater Projects in a Developing Countries; Ghana As A Case Study. International Journal of Project Management. 21: 321–326. Sadi A. Assaf ,Sadiq Al-Hejji. 2006. International Journal of Project Management. 24: 349–357. MuraliSambasivan andYau Wen Soon. 2007. Causes and Effects of Delays in Malaysian Construction Industry. International Journal of Project Management. 25 517–526. Frimpong, Y. (2000, November). Project Management in Developing Countries: Causes of Delay and Cost Overruns in Construction of Groundwater Projects. Unpublished Masters Research Project, University of Technology, Sydney, Australia. Anosike, P. 2009. Nigerian Groans Under High Cost of Building Material. The Daily Sun. 38–39. Majid, M. Z. A., Zakaria, W. Z., Lamit, H., Keyvanfar, A., Shafaghat, A., Bakti, E. B. 2012. Construction Information Systems for Executive Management in Monitoring Work Progress. Journal of Advanced Science Letter. 15(PP): 169–171. Leavitt, D., Ennis, S. and McGovern, P. 1993. The Cost Escalation of Rail Projects: Using Previous Experience to Re-evaluate the Cal Speed Estimates. California: University of California Transportation Center Azhar, N. and Farouqi, R. U. 2008. Cost Overrun Factors in the Construction Industry of Pakistan. Proceedings: The 1st International Conference on Construction in Developing Countries: Advancing and Integrating Construction Education, Research and Practice. Karachi, Pakistan, 18–20 April Advance Material Research, 2012. 446–449: 3879–3884 M. Z. Abd. Majld and Ronald McCaffe. 1998. Factors of Non-excusable Delays that Influence Contractors' Performance. Journal of Management in Engineering. 42–49. Chan, D. W. M, Kumaraswamy, M. M. A. 1997. Comparative Study of Causes of Time Overruns in Hong Kong Construction Projects. Int J Project Manage. 15(1):55–63. Achuenu E. 1999. Elemental Approach to the Evaluation and Modelling of Cost Overrun of Public Office Building Projects in Nigeria. Unpublished Ph.D. Dissertation, University of Jos, Nigeria. Ogunsemi, D. R. and Jagboro, G. O. 2006. Time-cost Model for Building Projects in Nigeria. Construction Management Economics. 24: 353–258. Amusan, Lekan Murtala. 2011. Neural Network-based Cost Predictive Model for Building Works. Unpublished Thesis for the Ward of PhD Degree Covenant University Nigeria. Nasiru, Zakari Muhammad, Kunya Sani Usman, and Abdurrahman Mutawakkil. 2012. Assessment of Factors that Affect Cost Control by
91
[21] [22]
[23]
[24] [25]
Ali Keyvanfar et al. / Jurnal Teknologi (Sciences & Engineering) 74:4 (2015), 85–91 Nigerian Construction Contractors. Journal of Engineering and Applied Sciences. 4. Mbachu, J. I. C. and R. N. Nkado. 2004. Reducing Building Construction Costs; the Views of Consultants and Contractors. COBRA. Nilashi, M., Zakaria, R., Ibrahim, O. Majid, M. Z. A., Zin, R. M., Farahmand, M. 2015. MCPC: A DEMATELANP Multi-criteria Decision Making Approach to Evaluate the Critical Success Factors in Construction Projects. Arabian Journal of Science and Engineering. 40: 343–361. Aibinu, A. A. and Jagboro, G. O. 2002. The Effects of Construction Delays on Projects delivery in the Nigerian Construction Industry. International Journal of Project Management. 20: 593–599. Schexnyder, C. Fiori, C. and Weber, S. 2003. Project Cost Estimating; A Synthesis of Highway Practice. Turkey Statistical Institute. Omole, A. O. 1986. Causes of the High Cost of Building and Civil Engineering Construction in Nigeria. The Nigerian Journal of Quantity Surveyor. 6: 1–2.
[26] Sardar Dyrdyev, Siuhaida Isma’il and Nooh Abu Bakr. 2012. Factors Causing Cost Overrun In Construction Of Residential Projects. A Case Study of Turkey. International Journal of Science And Management. 1(1): 3–12. [27] Ojedokun, O. Y., Odewumi T. O., Babalola, A. O. 2012. Cost Control Variables in Building Construction: A case study of Oyo state, Nigeria. Journal of Mechanical and Civil Engineering. 4(1): P32–37. [28] Yadollahi, M., Zin, R. M., Majid, M. Z. A., Zakaria, R. Z., Keyvanfar A. 2013. Designing for Less Maintenance: Lessons Learned from Flood Damaged Buildings. Advanced Science Letters. 19(10): 2988–2991 [29] Ojene, A. O., Achuenu, E. 2013. Evaluation of Factors Responsible for Dynamics of Direct Cost of Building Elements in Cross River State, Nigeria. Journal of Building Performance. 4. [30] Johannes, J. M., Koch, P. D. and Rasche, R. 1985. Estimating Regional Construction Cost Differences: Theory and Evidence. Managerial and Decision Economics. ABI/INFORM Global. 2: 70.