LETTER
Communicated by Tzyy-Ping Jung
A New Approach to Spatial Covariance Modeling of Functional Brain Imaging Data: Ordinal Trend Analysis Christian Habeck
[email protected] Cognitive Neuroscience Division, Taub Institute, and Department of Neurology, College of Physicians and Surgeons, Columbia University, New York, NY 10032, U.S.A.
John W. Krakauer
[email protected] Department of Neurology, College of Physicians and Surgeons, Columbia University, New York, NY 10032, U.S.A.
Claude Ghez
[email protected] Department of Neurology, College of Physicians and Surgeons, and Center for Neurobiology and Behavior, Columbia University, New York, NY 10032, U.S.A.
Harold A. Sackeim
[email protected] Departments of Neurology, Psychiatry, and Radiology, College of Physicians and Surgeons, Columbia University, New York, NY 10032, and Department of Biological Psychiatry, New York State Psychiatric Institute, New York, NY 10032, U.S.A.
David Eidelberg
[email protected] Center for Neurosciences, Institute for Medical Research, North Shore–Long Island Jewish Health System, Manhasset, NY 11030, and Department of Neurology, School of Medicine, New York University, New York, NY 10016, U.S.A.
Yaakov Stern
[email protected] Cognitive Neuroscience Division, Taub Institute, and Departments of Neurology and Psychiatry, College of Physicians and Surgeons, Columbia University, New York, NY 10032, USA; and Department of Biological Psychiatry, New York State Psychiatric Institute, New York, NY 10032, U.S.A. Neural Computation 17, 1602–1645 (2005)
© 2005 Massachusetts Institute of Technology
Ordinal Trend Canonical Variates Analysis
1603
James R. Moeller
[email protected] Cognitive Neuroscience Division, Taub Institute, and Department of Neurology, College of Physicians and Surgeons, Columbia University, New York, NY 10032, USA; and Department of Biological Psychiatry, New York State Psychiatric Institute, New York, NY 10032, U.S.A.
In neuroimaging studies of human cognitive abilities, brain activation patterns that include regions that are strongly interactive in response to experimental task demands are of particular interest. Among the existing network analyses, partial least squares (PLS; McIntosh, 1999; McIntosh, Bookstein, Haxby, & Grady, 1996) has been highly successful, particularly in identifying group differences in regional functional connectivity, including differences as diverse as those associated with states of awareness and normal aging. However, we address the need for a within-group model that identifies patterns of regional functional connectivity that exhibit sustained activity across graduated changes in task parameters. For example, predictions of sustained connectivity are commonplace in studies of cognition that involve a series of tasks over which task difficulty increases (Baddeley, 2003). We designed ordinal trend analysis (OrT) to identify activation patterns that increase monotonically in their expression as the experimental task parameter increases, while the correlative relationships between brain regions remain constant. Of specific interest are patterns that express positive ordinal trends on a subject-by-subject basis. A unique feature of OrT is that it recovers information about functional connectivity based solely on experimental design variables. In particular, there is no requirement by OrT to provide either a quantitative model of the uncertain relationship between functional brain circuitry and subject variables (e.g., task performance and IQ) or partial information about the regions that are functionally connected. In this letter, we provide a step-by-step recipe of the computations performed in the new OrT analysis, including a description of the inferential statistical methods applied. Second, we describe applications of OrT to an event-related fMRI study of verbal working memory and H2 15 O-PET study of visuomotor learning. In sum, OrT has potential applications to not only studies of young adults and their cognitive abilities, but also studies of normal aging and neurological and psychiatric disease. 1 Introduction Perhaps it is not an oversimplification to say that in neuroimaging studies of human cognition, it is rare to capture glimpses of the regional functional connectivity of the underlying neural circuitry, particularly in studies involving H2 15 O PET and event-related fMRI (Friston, Frith, Liddle, &
1604
C. Habeck et al.
Frackowiak, 1993; McIntosh, Bookstein, Haxby, & Grady, 1996; McIntosh & Gonzalez-Lima, 1994). In cognitive neuroscience, the term functional connectivity refers to the distributed nature of human information processing that occurs over a scale of centimeters (DeFelipe et al., 2002; Felleman & Van Essen, 1991; McIntosh & Gonzalez-Lima, 1994; Mellet et al., 2000), where the term was co-opted from neurophysiologists (Gerstein, Perkel, & Subramanian, 1978) who originally used it to describe the cooperative firing between functionally related neurons that were grouped together on a submillimeter scale. Although functional connectivity was intended and is often evoked as a guiding principle for understanding brain function (Friston et al., 1993; Horwitz, 1991; McIntosh, 1999), it bears a resemblance to the elusive qualities of dark matter in the astrophysicist’s presentday universe (Abbott, 2002; Ostriker & Steinhardt, 2003). That is, interregional functional connectivity and dark matter are known to be ubiquitous in their respective sciences, but sightings are rare. What is the explanation for this odd circumstance as it pertains to cognitive neuroscience? Based on current and past neuroimaging studies of ordinary human abilities, we do not know whether the apparent uncertainty we confront in mapping regional functional connectivity reflects an inherent property of human information processing or whether it is a property of the experimental designs and statistical models we apply. Concretely, there is no assurance that latent patterns of functional connectivity will be uncovered using the conventional voxel-by-voxel modeling of expected experimental effects (Friston, Frith, Liddle, & Frackowiak, 1991; Friston et al., 1996; Worsley, Poline, Friston, & Evans, 1997). Indeed, the principal authors of the voxel-wise univariate and multivariate linear models, Friston, Worsley, and colleagues, have been reticent to suggest otherwise (Worsley et al., 1997). Further, McIntosh (1999) in his discourse on the need for spatial covariance modeling and the likely empirical evidence for functional connectivity to be derived therefrom, stops just short of asserting that latent patterns of functional connectivity frequently will be missed by voxel-by-voxel modeling. On the other hand, with the network analyses offered by McIntosh— structural equation modeling (McIntosh & Gonzalez-Lima, 1994) and partial least-squares analysis (McIntosh et al., 1996)—there is always a concern that some misattributions of connectivity will inevitably occur. Indeed, it is somewhat surprising that McIntosh and colleagues’ strongest evidence for functional connectivity has come from demonstrations that connectivity is substantially altered by graduated changes in task parameters (McIntosh, 1999), subject mind-set or state of awareness (McIntosh, Rajah, & Lobaugh, 1999), and subtle changes in neurophysiology that occur with normal aging (Cabeza, Anderson, Houle, Mangels, & Nyberg, 2000; Cabeza, McIntosh, Tulving, Nyberg, & Grady, 1997; Grady, McIntosh, & Craik, 2003). The question is whether this level of apparent volatility in functional connectivity is an inherent property of ordinary human abilities (Fernandez-Duque, Baird, & Posner, 2000a, 2000b), or a by-product of the
Ordinal Trend Canonical Variates Analysis
1605
limitations in our experimental designs and statistical modeling methods. To address this issue, we sought to devise a different type of spatial covariance modeling that would identify sustained functional connectivity across graduated changes in task parameters. Our intention has been to extend the definition of functional connectivity as it was originally applied to individual task conditions so as to define it for experiments that consist of parametric series of tasks conditions. The notion of sustained functional connectivity we consider here is that in which the influence of parametric changes between tasks is exchangeable with the influence of endogenous variables that induce subject differences within a task. Specifically, if—within a task—the effect of changing the level of endogenous variables is to scale up or down the activity of the functionally connected brain regions, then the effect of parametric changes between tasks is likewise to scale up or down the activity in these functionally connected brain regions, albeit on a subject-by-subject basis. In every task and subject, the scaling of activity in the functionally connected regions is therefore determined jointly by the experimental and endogenous variables. Based on this exchangeability of experimental and subject variables, we designed a spatial covariance model that can identify regional brain activations that in aggregate (i.e., as represented by a pattern of regional weights) express a positive ordinal trend with incremental changes in a task parameter; that is, these brain activations increase monotonically as the experimental task parameter increases, while the correlative relationships between brain regions remain constant. The activation patterns of interest are those that express positive ordinal trends on a subject-by-subject basis. Indeed, a prediction of ordinal trends is commonplace in studies of cognition that involve a series of experimental conditions over which task difficulty increases. Representative examples in the study of working memory are the N-back (Braver et al., 1997) and Sternberg (1966, 1969) tasks. Another example is the well-known auditory “oddball task” (Naatanen, Tervaniemi, Sussman, Paavilainen, & Winkler, 2001), where the fraction of standard to deviant tones is varied in a parametric manner. Many cognitive theories presume that there is sustained functional connectivity in the sense described above. For example, in his theory of verbal memory, Baddeley (1988, 2003) describes a coalition of component processes, including articulatory rehearsal, phonological store, and central executive, that is common to all individuals, and he predicts that the effect of increasing memory load is to incrementally increase activity in brain regions associated with these processes. The spatial covariance analysis that we devised, which we have named ordinal trends (OrT) analysis, provides an explicit test of the assumption of sustained functional connectivity. Of course, OrT is applicable not only to studies of task difficulty, but also to the broader spectrum of parametrically designed studies of human cognition.
1606
C. Habeck et al.
The strategy for using the OrT analysis to test the prediction of sustained functional connectivity is briefly the following. In a data set, OrT assigns reduced salience, on the one hand, to latent activation patterns that express mean directional changes between tasks that are different from the predicted ordinal trend.1 On the other hand, among the latent patterns that express mean trends in the predicted direction, OrT assigns a different level of salience depending on the type of task × subject interaction that a pattern expresses. Salience is reduced in activation patterns where the direction of the trend expressed is different for different subjects. By contrast, salience is enhanced in activation patterns where the direction of the trend is same in all subjects. Among the latter type of patterns, the salience assigned to a pattern is directly related to the proportion of the total (voxel × task × subject) variance in the original data set that is accounted for by the pattern and its expression. Among the latent patterns that express ordinal trends, OrT provides an estimate of the pattern with the highest salience, quantifies the expression of this pattern for each subject and task condition, and quantifies the statistical significance of the pattern expression and the reliability of the pattern’s voxel weights. In this article, we discuss the feasibility of the OrT computational approach, followed by a step-by-step recipe of the computations performed in an OrT analysis, including a description of the inferential statistical methods applied. Second, we describe applications of OrT to actual event-related fMRI and PET data sets. We report the results from OrT analyses of two studies of ordinary human abilities: (1) an event-related fMRI study of a verbal working memory task involving a delayed-matched-to-sample experimental design and (2) an H2 15 O-PET study of visuomotor learning. We show that the OrT analysis takes its place alongside PLS network analysis as being only the second spatial covariance model that is specifically designed to recover latent aspects of functional connectivity in neuroimaging studies that involve parametric experimental designs. In short, OrT serves as an omnibus test of sustained functional connectivity that is performed across multiple task conditions and all brain regions (voxels). 2 Feasibility of the OrT Computational Approach From a computational perspective, the ideal approach to identifying latent patterns that express ordinal trends would be simply to multiply the original neuroimaging data matrix by a matrix that would maximally enhance the salience of the target patterns, where the latter matrix is based on the parametric design of the experiment. This approach is similar to 1 In our description of the OrT strategy for assigning salience to regional covariance patterns, a latent pattern is any covariance pattern that is contained in the vector space spanned by the functional images contained in a data set. Moreover, the term latent pattern is not used in reference to a particular canonical representation of the vector space.
Ordinal Trend Canonical Variates Analysis
1607
the current canonical variates analyses (CVA) that have been designed for analyzing neuroimaging data (McIntosh et al., 1996; Worsley et al., 1997). In current CVAs, the task-subject × voxel matrix Y (the neuroimage data set) is multiplied by a task-subject × design matrix X consisting of predictor variables, after which the X! Y product is submitted to singular value decomposition (SVD). Algebraically, the effect of matrix multiplication is always to differentially alter the voxel × task × subject variance accounted for by different latent patterns. In particular, matrix multiplication in the OrT analysis would be designed to selectively enhance the voxel × task × subject variance of patterns that expressed ordinal trends and, among these latter patterns, to produce the greatest enhancement in the pattern that expressed the largest voxel × task × subject variance in the original data set. On this basis, the application of principal component analysis (PCA), or SVD, to the transformed data set could be expected to produce major principal components that provided a good approximation to one or more patterns that express ordinal trends. In these respects, our approach builds on the current model-guided PCA methods designed for analyzing neuroimaging data (Petersson, Nichols, Poline, & Holmes, 1999). Spelling out what is required by the OrT analysis made it less certain, however, that there actually is a design matrix that would guarantee the identification of patterns that expressed ordinal trends. A new design matrix had to be invented that would differentiate among three categories of latent patterns, that is, would differentially alter the voxel × task × subject variance of three types of latent patents: first, discriminate among patterns that expressed mean trends in the predicted direction from patterns that expressed mean directional changes between tasks that are different from the predicted trend; and second, discriminate among different types of patterns within the first category. In the first category, the design matrix has to discriminate among patterns in which the direction of the trend expressed is the same in all subjects from patterns that express task × subject interactions in which the trend expressed is different for different subjects. In addition, the design matrix has to preserve the relative size of the voxel × task × subject variance accounted for by latent patterns that express ordinal trends. On the one hand, our computational approach is a form of CVA. On the other hand, the previous work on CVA—as it concerns the analysis of neuroimaging data (McIntosh et al., 1996; Worsley et al., 1997)—is not extendable in a straightforward manner to provide a matrix solution that satisfies the above OrT requirements. Indeed, in the extant CVA approaches, the presumption is that a modest number of predictor variables (i.e., a lowdimensional design matrix) will provide an adequate account of the neuroimaging data or, conversely, a large number of predictor variables would likely produce mixtures of different model effects that are not interpretable. We recognized, however, that no low-dimensional design matrix could correctly assign the appropriate salience to the three pattern categories that
1608
C. Habeck et al.
must be discriminated in the OrT analysis. In particular, a low-dimensional design matrix would not provide the means to differentiate among patterns that expressed the predicted mean trend but differed in the type of task × subject interactions. A high-dimensional matrix is required to differentiate among patterns in which the direction of the trend expressed is the same in all subjects and patterns that express task × subject interactions in which the trend expressed is different for different subjects. Our answer to the question of feasibility was a design matrix of dimension T ∗ N × (T − 1)∗ N, where T is the number of task conditions in the parametric series and N is the number of subjects. For the particular series of task conditions, E i , i = 1, . . . , T, the individual columns of the design matrix assign unit values to one or another pair of consecutive task conditions and zero to all other task conditions. For each pair of consecutive task conditions, these assignments are made on a subject-by-subject basis. When T = 5, for example, the OrT design matrix (Q) is a 5N × 4N matrix of the form
IN IN Q= 0 0 0
0 IN IN 0 0
0 0 IN IN 0
0 0 0 , IN IN
where for each task, IN denotes the N × N identity matrix. In other words, tasks are ordered sequentially along the row dimension, and subjects are repeated within each task. This article includes the tests we have performed to evaluate the utility of this new design matrix. We have applied the OrT analysis not only to real event-related fMRI and H2 15 O PET data sets, but also to data sets simulated using Monte Carlo methods. In the Monte Carlo simulations, the performance of the OrT design matrix was evaluated in terms of the degree that the PCA of the transformed data set outperformed the PCA of the untransformed data set (see the appendix). The primary aim of the Monte Carlo computations was to verify that the target patterns that expressed ordinal trends in the simulated data sets were better estimated by a fixed number of the major principal components of the transformed data than by the same number of principal components of the untransformed data. A detailed discussion of these Monte Carlo tests of feasibility is contained in the appendix. In addition, we compared the performance of the OrT method to the performance of the conventional, low-dimensional CVA models that are ordinarily applied to event-related fMRI and H2 15 O PET data sets. In brief, it may come as a surprise that the low-dimensional CVA models actually performed worse—in recovering target patterns that expressed ordinal trends—than PCA applied to the untransformed data set (Figure 8 in the
Ordinal Trend Canonical Variates Analysis
1609
appendix). The differences in performance are substantial. We also found that even high-dimensional design matrices that do not contain the particular features of the OrT matrix, such as, the Helmert matrix (Venables & Ripley, 1999), perform nearly as poorly as the conventional low-dimensional design matrices (Figure 8 in the appendix). Finally, we have addressed the issue of the statistical specificity of the OrT analysis by demonstrating that the OrT design matrix achieves low type I error rates (false alarm rates) in data sets in which the task × subject neuroimaging data are generated using the statistics of random gaussian fields. In the next section, before presenting the computational recipe for the OrT analysis and the information about its statistical specificity, we provide one example of a Monte Carlo simulation in order to portray with simple graphics (see Figure 1) what it means for the PCA of the OrT transformed data set to outperform the PCA of the untransformed data set in identifying latent patterns with ordinal trends. 2.1 First Illustration of the OrT Analysis. Consider a miniature data set that consists of two task conditions: a control condition B and an experimental challenge condition E1 where, for purposes of visual display, each image was limited to just two voxels. These diminutive images for 100 subjects are displayed in a two-dimensional Cartesian coordinate system in Figure 1. This visual display corresponds to the formal algebraic representation of the data set as a task-and-subject × voxel matrix (Y), consisting of 200 rows (two tasks times 100 subjects) and two columns (two voxels). Moreover, different data points in Figure 1 represent two-voxel images for different subjects and task conditions, where each data point corresponds to a single row in the data matrix Y. With regard to the remainder of the Monte Carlo simulations described in the appendix, they involve more realistic data sets and are described using matrix notation only. In our miniature data set, all 200 images are actually admixtures of just two latent patterns of functional connectivity: a latent pattern that expresses a positive trend for every subject and a second latent pattern that does not. In algebraic notation, the OrT pattern is z1 = [1; 1], and the second, nonOrT pattern is z2 = [1; −1], where the boldface z1 and z2 variables represent 2 × 1 column vectors. In z1 , the two positive voxel weights indicate a form of functional connectivity in which z1 ’s contributions to the overall activity of voxels 1 and 2 are positive. In contrast, in z2 , the voxel weights are of the opposite sign, indicating a form of functional connectivity in which z2 ’s contribution to the overall activity of voxel 1 is positive, but its contribution to voxel 2 is negative. In this sense, z1 and z2 represent orthogonal patterns of functional connectivity, which is represented algebraically by a zero inner product, z1 · z2 = 0. In this simulated data set, the group mean expression of each pattern is configured to reveal a positive change from B to E1. Indeed, the subject
1610
C. Habeck et al.
expressions of the two patterns, z1 and z2 , are configured to have the same means and the same variances in each of the two task conditions, while at the same time, z1 expresses a positive trend for every subject, whereas z2 expresses a positive trend for 55 of the subjects and expresses a negative trend for the remainder of subjects. These several features of latent activation patterns z1 and z2 are displayed in Figure 1A, where the total voxel activity in a data set is plotted for each task and subject (open circles). Also plotted are the subject levels of voxel activity in the individual patterns of functional connectivity. For z1 , the circles are linearly aligned with positive slope along the line [1; 1], and for z2 , the circles are linearly aligned with negative slope along [1; −1]. Different colors are used to distinguish task B (green) from task E1 (red) in depicting the activity in both whole images and the individual patterns of functional connectivity. The details of subject pattern expression are as follows. For z1 , the subject expression values b for task B were sampled from the uniform distribution U(0,1). The vector b is an N × 1 column vector. The expression values for E1 are denoted as e1 and were generated as b + !, where ! also is a N × 1 random variable, sampled from U(0,1). This results in b and e1 having mean 1/2 and 1 and variance 1/12 and 1/6, respectively. For z2 , b and e1 are similarly constructed. However, the subject labels for both b and e1 have been randomly permuted, resulting in different subjects exhibiting opposite trends. In other words, the collection of images in the task-and-subject × region data matrix can be represented as an algebraic sum of the individual contributions of the latent patterns z1 and z2 : Y=
'
b e1
(
Target
) * 1 1 +
'
b e1
(
Non−Target
)
* 1 −1 .
Indeed, it is clear from this formula that subject expression of a latent pattern is simply the projection of the pattern onto the data set. For example,
Figure 1: Miniature data set Y involving two experimental tasks B and E1 and 100 subjects, in which each image, containing just two voxels, is an admixture of a targeted activation pattern and an orthogonal, nontargeted activation pattern. (A, Right) Task × subject voxel activity in Y. Activity values due to the individual patterns are displayed as well as the aggregate data. Different tasks are indicated by different-colored open circles: green indicates activity pertaining to task B, red to task E1 . The blue line indicates the major source of variance, which is also the mean difference image between conditions found with mean contrast analysis. It is the vector average of both targeted and nontargeted activation pattern. (A, left) Task-activity curves for the subject expression of targeted and nontargeted pattern, shown for a subset of 20 subjects to avoid clutter. The ordinal trend feature of strictly monotonic curves with a high intertask correlation can be discerned for the
Ordinal Trend Canonical Variates Analysis
(A)
1611
Target expression
E1 Voxel 2
B
Non-target expression
B
Voxel 1
E1
(B)
Voxel 2
main source of variance
Voxel 1 Figure 1: (cont.) targeted (upper-left figure) but not the nontargeted activation pattern (lower-left figure). (B) Subject-voxel activity in the data transformed by the OrT matrix Q(Q! Q)−1/2 (open blue circles). Application of the OrT matrix results in the same amount of variance of the open circles along the direction of the nontargeted component, but a much enlarged amount of variance ( = var(b) + var(e1 ) + 2cov(e, b1 )) along the direction of the targeted pattern because of the high intertask correlation of subject expression. The direction of the major source of variance ( = first principal component) is drawn as a blue line.
1612
C. Habeck et al.
for z1 , the pattern expression is the inner product of the z1 vector with the Y matrix: '
b e1
(
Target
= Y · z1 .
A comparison between Figures 1A and 1B illustrates the considerable impact that the OrT matrix has on the voxel × task × subject variances of z1 and z2 . In particular, the comparison reveals that the OrT transformed data set outperforms the PCA of the untransformed data set in identifying as the first principal component the latent pattern z1 for which all subjects exhibit a positive trend. Figure 1A shows that the patterns z1 and z2 have equal salience and that the first principal component of the untransformed data set is not latent pattern z1 but, rather, the vector average of patterns z1 and z2 along the direction [1; 0], which is indicated by a blue line. By contrast, Figure 1B shows that after OrT matrix multiplication, the patterns z1 and z2 no longer have equal salience, and now the first principal component is a good approximation of z1 . We have used extensive Monte Carlo simulations to generalize these results and establish a benchmark of the accuracy of OrT pattern estimation. The simulated data sets and OrT performance are described in the appendix. Monte Carlo simulations were written in MATLAB 6.0 (Mathworks, Natick, MA) and performed on Linux workstations. Interested readers who want to learn more about the derivation and utility of the OrT design matrix can find all pertinent information in the appendix. 2.2 Algorithm of OrT/CVA. We now present a list of the 5 computational steps of the OrT/CVA, assuming that the neuroimaging data have undergone sufficient preprocessing, resulting in one scan per subject per task. (The preprocessing steps will be explained in detail in the sections showing applications to real-world PET and fMRI data sets.) We assume three task conditions, B, E1, E2, but our recipe can be generalized to any number of task conditions (two or greater). Step 1: Application of a projection operator, P, by multiplication from the right according to YP, to eliminate strictly task-independent effects. P is constructed from the set of 2N eigen images of the Helmerttransformed data matrix H! Y. The eigen decomposition can be written as Y! HH! Y W = W" with the Helmert matrix
−IN H = IN 0
IN IN . −2IN
Ordinal Trend Canonical Variates Analysis
1613
The matrix W contains the 2N eigen images as column vectors, and " is a 2N-diagonal matrix containing the nonzero eigen values. P is the projection matrix of the Helmert eigen images; that is, P is the matrix WW! . The modified data matrix YP has the same dimensions as the original data matrix Y. However, YP will contain N fewer activation patterns and has rank 2N (i.e., it is of lower rank than Y, which has rank 3N). Step 2: Application of the OrT design matrix, Q, by multiplication from the left according to [Q(Q! Q)−1/2 ]! YP, to increase the salience of ordinal trend effects. With N subjects and 3 task conditions, the OrT design matrix consists of 2N predictor variables, where a pair of predictor variables is constructed for each subject. With the preselected ordering of tasks B, E 1 , and E2, the predictor variables for the jth subject are (1) a 3N vector in which the entries are zero except for the jth scans for the B and E1 task conditions, which both contain unit values, and (2) a 3N vector in which the entries are zero except for the jth scans for the E1 and E2 task conditions, which contain unit values. The OrT design matrix can thus be written as
0 IN . IN
IN Q = IN 0
The OrT design matrix applied to the imaging data YP is the orthonormal version Q(Q! Q)−1/2 of the above matrix. This normalization guarantees that all predictor variables, specifically all subjects, are equally influential in assigning salience to latent patterns. Step 3: Singular value decomposition is applied to the mean-centered [Q(Q$ Q)−1/2 ]$ YP matrix. This is equivalent to applying PCA, that is, P! Y! Q(Q! Q)−1 Q! YP V = V#. V contains 2N orthogonal eigen images as column vectors, and # is a 2Ndiagonal matrix of the eigen values. Step 4: The first K eigen images are tested for the presence of an ordinal trend. For the first K singular images, a 2N × K predictor array is calculated according to [E1 − B; E1 + B − 2E2 ]. B is obtained by projection of all K images onto the raw data pertaining to condition B : B = Y(1 : N, :) V(:, 1 : K ). Likewise, for E 1 and E2, we have E1 = Y(N + 1 : 2N, :)V(:, 1 : K ), and E2 = Y(2N + 1 : 3N, :)V(:, 1 : K ). We then conduct a linear regression to best predict the dependent variable of the regression, which is a 2N column vector [1; 1], with the 2N × K predictor array described above: '
1 −1
(
≈
'
( E1 − B β. E1 + B − 2E2
1614
C. Habeck et al.
Table 1: Tabulation of Type I Error Rates for the Number-of-Exceptions Criterion, Obtained from 10,000 Monte Carlo Simulations for 13 Subjects and 500 Regional Resolution Elements.
0 exceptions 1 exceptions 2 exceptions 3 exceptions 4 exceptions 5 exceptions 6 exceptions
PC1
PC1-2
PC1-3
PC1-4
PC1-5
PC1-6
0.000 0.001 0.011 0.059 0.209 0.533 1.000
0.000 0.005 0.038 0.156 0.409 0.730 1.000
0.001 0.015 0.090 0.290 0.591 0.856 1.000
0.004 0.041 0.176 0.440 0.739 0.925 1.000
0.012 0.088 0.291 0.589 0.844 0.966 1.000
0.030 0.167 0.432 0.724 0.916 0.985 1.000
In other words, the regression is a type of discriminant analysis that produces the linear combination of the K eigen images according to V(:, 1 : K )β whose mean expression changes maximally across task conditions. For the test of significance of the ordinal trend, we compute the task-subject scores for this new linear combination image according to the right-hand side of the above regression equation. The test of significance is based on the minimum number of exceptions to a perfect segregation of these contrast scores, which is an inverse correlate to the maximum number of subjects who exhibit monotonic task-activity curves. Monte Carlo methods are used to calculate the type I error rate of ordinal trends based on the minimum number of exceptions to a perfect segregation of scores. Table 1 illustrates the type I error based on (1) fixing in advance the number of the principal components of [Q(Q! Q)−1/2 ]! YP employed in the discriminant analysis described above and (2) task × subject images that have been smoothed to 500 regional resolution elements (”resels”), where images contain resels of independently and normally distributed noise. Naturally, different error rates are obtained depending on the particular decision rule that is used to select principal components 1 to K from [Q(Q! Q)−1/2 ]! YP and the number of resels per image. Step 5: Bootstrap estimation of the robustness of voxel weights in the ordinal trend topographic estimate. A bootstrap resampling procedure can be used to estimate the variability of the regional weights in the patterns about their point estimate values. The complete analysis (steps 1–4) that was performed on the original subject sample to arrive at the ordinal trend topographic estimate is usually repeated 100 to 1000 times on samples of subjects that have been chosen randomly with replacement from the original subject pool.2 The inverse coefficient of variation (ICV) serves as the 2
The computational requirements of this resampling process are as follows: for our fMRI example using 16 subjects and 500 iterations on a Linux workstation with 4 GB of RAM, the bootstrap estimation process took about 2 hours.
Ordinal Trend Canonical Variates Analysis
1615
measure of the reliability of the regional weight at each voxel in the topographic pattern. ICV is computed from the point estimate of the regional weights, wvoxel , and the variability of the resampling process around this point estimate, captured as the standard deviation σvoxel , as ICVvoxel =
Wvoxel ∼ N(0, 1), σvoxel
and is approximately standard normally distributed (Efron & Tibshirani, 1994). The larger the absolute magnitude of ICVvoxel , the smaller the relative variability of the regional weight about its point estimate value. We adopted a threshold of at least |ICVvoxel | > 2 for the two examples discussed in the next section. Under the assumption of a standard-normal distribution, this corresponds to a one-tailed p-level of p < 0.0228. 3 Application to Event-Related fMRI Study of Working Memory Methodological details are spelled out for a typical application of OrT to event-related fMRI data. The application is a study of verbal working memory, some of whose results have been published in Habeck et al., (2004). Here we present results that have not been included in the previous publication. 3.1 Study Design. Eighteen young subjects (age = 26.3 ± 4.9 years) participated in an event-related functional magnetic resonance imaging (efMRI) paradigm of a delayed-match-to-sample (DMS) task. The initial scan occurred at 9 A.M. (”PRE”), and the follow-up scan occurred at the same time 48 hours later (”POST”) to eliminate confounding circadian effects, yielding 48 hours of prolonged wakefulness. All subjects had been carefully screened for normal sleep patterns for 2 weeks prior to the experiments and for the absence of neurological or psychiatric contraindications. (Details are available elsewhere (Habeck et al., 2004) and are omitted here for brevity.) Finally, 22 additional subjects (age 23.93 ± 1.14) participated in the PRE scan but did not undergo the sleep deprivation protocol. The DMS task was a variant of the Sternberg task (Sternberg, 1966, 1969). A trial lasted 16 seconds. Subjects were instructed to respond as accurately as possible. No feedback about their performance was given. The sequence of trial events was as follows: first, a fixed 3 second period of blank presentation marked the beginning of trial; then, during the stimulus period of the task, an array of one, three, or six uppercase letters was presented for 3 seconds (the stimulus phase). With the offset of the visual stimulus, subjects were instructed to focus on the blank screen and hold the stimulus items in mind for a 1 second maintenance interval (the retention phase). Finally, a probe appeared for 3 seconds (the probe phase), which was a lowercase letter centered in the field of view. In response to the probe,
1616
C. Habeck et al.
subjects indicated by a button press whether the probe matched a letter in the study array (the left index finger indicated yes and the right index finger indicated No). Each of three experimental blocks contained 10 trials for each of 3 set sizes with 5 true negative and 5 true positive probes per set size. There were 10 × 3 × 3 = 90 experimental trials per scanning session. In addition to the fixed 3 second period of a blank screen presentation, which we counted as part of the experimental trial, there were intertrial intervals (ITI) that consisted of presentation of a blank screen and were used as baseline epochs in the time-series analysis of the subject’s data. Their length was variable and determined in the following way: 70 2-second increments were available throughout the whole block, for 30 intertrial intervals. It was decided stochastically whether a 2 second increment of ITI would be inserted prior to the start of the trial or whether the trial would begin immediately. The details of this procedure have been reported in detail elsewhere (Habeck et al., 2004). With 30 trials of 16 seconds each, each block lasted for 140 + (30 × 16) = 620 seconds. There were two breaks of approximately 1 minute each between block 1 and 2 as well as block 2 and 3. This brings the overall time subjects spent in the scanner by each subject to (3 × 620) + 120 = 1980 seconds, or 33 minutes. On the evening before the first day of fMRI scanning, every subject received seven blocks of initial training on the experimental setup: the first 6 training blocks were run with feedback and the seventh without feedback. On the first day of fMRI scanning, all subjects were well rested. Reported here are new OrT/CVA analyses of the fMRI data sets of PRE and POST sleep deprivation; the focus is on the functional activity of the retention phase. The first analytic goal was to recover a pattern of sustained functional connectivity in which subjects expressed ordinal trends with an increasing memory load of 1-, 3-, and 6-letter arrays. The OrT/CVA analysis was initially performed on fMRI data from a subgroup of the 40 subjects who participated in our working memory study: the subgroup consisted of 16 randomly selected subjects. Subsequent to this analysis, the plan was to apply the presumptive OrT pattern obtained from the analysis of 16 subjects to the fMRI data of the 24 additional individuals, where there were again three load conditions per subject, and again subjects were well rested. The aim of this ”forward application” was to illustrate that the original ordinal trend effect could be replicated in an independent subject sample of comparable size. Successful forward application provided a demonstration that an accurate estimate of the OrT pattern had been obtained from the initial OrT/CVA analysis. The forward application of an OrT pattern simply entailed the calculation of pattern expression in the individual fMRI images obtained for the retention interval for each of the 24 subjects, for each of the three load conditions. For each subject and load condition, pattern expression is a scalar
Ordinal Trend Canonical Variates Analysis
1617
value that is the inner product between each raw fMRI image and the OrT pattern image: the inner product is simply the voxel-by-voxel multiplication of the weights in the fMRI and OrT pattern images summed over the whole brain. (See section 2.1 for a description of this operation in terms of vector notation.) Provided that the ordinal trend effect was replicated in the independent group of 24 well-rested subjects, our plan was to assess whether this pattern of sustained functional connectivity revealed in the well-rested state was preserved after sleep deprivation. Concretely, our plan was to forwardapply the OrT pattern estimate of the well-rested state to the fMRI data of the 18 sleep-deprived subjects, where again there were three load conditions (1-, 3-, and 6-letter arrays) per subject. This forward application of the OrT pattern provided a test for ordinal trends with maximal statistical degrees of freedom, where the statistical power of the forward application was dependent on the accuracy of the original OrT pattern estimate. 3.2 FMRI Preprocessing Steps. Functional images were acquired using a 1.5 Tesla magnetic resonance scanner (Philips). A gradient echo EPI sequence (TE = 50 ms; TR = 3 sec; flip angle = 90◦ ) and a standard quadrature head coil were used to acquire T2∗ weighted images with an in-plane resolution of 3.124 mm × 3.124 mm (64 × 64 matrix; 20 cm2 field of view). Based on T1 “scout” images, 8 mm transaxial slices (15–17) were acquired. Following the fMRI runs, a high (in-plane) resolution T2 image at the same slice locations used in the fMRI run was acquired using a fast spin echo sequence (TE = 100 ms; TR = 3 sec; 256 × 256 matrix; 20 cm2 field of view). Task administration and data collection were controlled by a computer running appropriate software (Psyscope 1.1) in electronic synchrony with the MR scanner. Task stimuli were back-projected onto a screen located at the foot of the MRI bed using an LCD projector. Subjects viewed the screen via a mirror system located in the head coil. Task responses were made on an LUMItouch response system, and behavioral response data were recorded on the task computer. All image processing and analysis was done using the SPM99 program (Wellcome Department of Cognitive Neurology) and supporting code written in Matlab 6.0 (Mathworks, Natick, MA). FMRI time series were corrected for order of slice acquisition. All functional volumes in a given subject were realigned to the first volume from the first run of each study. The T2 anatomical image was then coregistered to the first functional volume, using the mutual information coregistration algorithm implemented in SPM99. This coregistered structural image was then used in determining nonlinear spatial normalization (7 × 8 × 7 nonlinear basis functions) parameters for a transformation into a Talairach standard space defined by the Montreal Neurological Institute template brain applied with SPM99. These normalization parameters were then applied to the functional data (using SINC interpolation to reslice the images to 2 mm × 2 mm × 2 mm).
1618
C. Habeck et al.
In a level 1 time-series analysis of the individual subject data, the fMRI responses to the three separate temporal components of the task, in each experimental condition and in each block, were fit to separate sets of predictor variables (Zarahn, 2000). The predictor variables of the time-series modeling were the following: a constant intercept (0th-order discrete cosine set) was chosen for the stimulus and probe phases, whereas a 0th- to 2nd-order discrete cosine set was chosen for the retention phase. For one block, this results in five predictor variables (one for stimulus, three for retention, one for probe) per set size (one, three, and six) per probe type (positive or negative). An additional intercept term is provided for the effect of block, bringing the total number of predictor variables per block to (5 × 3 × 2) + 1 = 31. Predictor variables had a nonzero value at every point in the time series where a particular condition was met and a zero value at every other point. For example, one predictor had a value of one during all stimulus phases of set size one, with a positive probe, during the first block. The set was convolved with a canonical hemodynamic response waveform (a sum of two gamma functions, as specified in the SPM99 program (Friston et al., 1998) whose beginnings were marked by the appropriate onset vector for each epoch, set size, and probe type. The resulting timeseries vectors were used in the design matrix for the within-subject model estimation. The number of rows was the total number of volumes denoting the complete fMRI time series across the scanning session. The number of columns was 3 × 31 = 93, with 31 design vectors for each experimental block. The bandpass-filtered (low pass by a gaussian with a FWHM of 4 sec and a high-pass cutoff of 14.5 mHz) fMRI time series at each voxel were regressed onto these predictor variables. A first-order autoregressive autocorrelation model was fit to the residuals to make statistical inference more robust to the intrinsic temporal autocorrelation structure (Friston et al., 2000). At every voxel in the image, components of the event-related responses that matched the canonical hemodynamic response waveform were estimated for the whole scanning session. Linear contrasts assessed the amplitudes (normalized regression coefficients) of these components. A typical contrast used in our analysis, for instance, would be activity during the retention phase for six items collapsed across probe types and experimental blocks versus activity in the ITI blank period. This method of time-series modeling and contrast estimation at each voxel reduces the number of images to one per subject per condition. To account for gain differences between fMRI sessions, activation values were normalized by their voxel averages. The resulting parametric map images were smoothed using an isotropic gaussian kernel (FWHM = 8 mm) and used as the data in the subsequent analysis. Afterward, a probabilistic gray matter mask was applied with a threshold of 0.5: every voxel submitted to the analysis had at least a chance of 0.5 of being gray matter. The resulting masked brain images contained 115 resolution elements as indicated by SPM99. These parametric maps serve
Ordinal Trend Canonical Variates Analysis
1619
as the dependent variables for the subsequent population-level OrT/CVA analysis. 3.3 Results. In the initial OrT/CVA analysis of the retention period of the working memory task, which involved 16 subjects and three levels of memory load (one-, three-, and six-letter arrays), the first two principal components of the OrT/CVA combined linearly to produce an activation pattern that expressed a statistically significant ordinal trend effect. Here, statistical significance indicated that a regional activation pattern was present in the retention period whose functional connectivity was sustained across increasing levels of memory load. This OrT pattern accounted for 5.8% of the variance in the raw fMRI data set. Brain regions that concomitantly increased in activation (as ascertained by the bootstrap test with a threshold of |ICVvoxel | > 2) for the majority of subjects as a function of memory load were found mainly in parietal areas (BA 7 and BA 40), frontal/prefrontal areas (BA 6,8,9), right fusiform gyrus (BA 19), and left superior temporal gyrus (BA 22). Brain regions that concomitantly decreased in activation for the majority of subjects were found mainly in the anterior and posterior cingulate gyri (BA 31, 24), insula (BA 13), cuneus (BA 19), right parahippocampal gyrus (BA 19), and medial frontal gyrus (BA 10). For a complete listing of both areas of increased and decreased activation see Tables 2 and 3 and Figure 2. Based on the number-of-exceptions statistic (described in step 4 of the OrT/CVA algorithm), there was a significant ordinal trend ( p < 0.01, 2 exceptions; see Figure 3). This OrT pattern of load-related regional activations was forward-applied into the fMRI data set of the additional 24 subjects, who also were scanned while well rested. The matrix of pattern expression values for three load conditions, for each of 24 subjects, yielded a value of 5 for the number-of-exception statistic and p < 0.001. The p-value was computed using a Monte Carlo method similar to that described in step 4 of the OrT/CVA algorithm, where the p-value is the probability of obtaining a statistic of five or less from data sets that were generated from the statistics of gaussian random noise. The p-value reported here is based on 10,000 Monte Carlo simulations of data sets in which individual images contained 115 resolution elements each. Although the OrT pattern accounted for 5.8% of variance in the fMRI data set from which it was originally derived, the same OrT pattern accounted for less variance (i.e., 2.0% variance) in the fMRI data set into which it had been forward applied (the data set of the 24 additional subjects). This reduction in the variance-accounted-for most likely reflects a limitation in terms of the accuracy with which a true OrT pattern can be estimated from an original sample of 16 subjects. Notwithstanding, this reduction in varianceaccounted-for does not detract from the fact that ordinal trends were expressed to a significant degree by the estimated OrT pattern in the fMRI data set of the 24 additional subjects. Indeed, this outcome is consistent
1620
C. Habeck et al.
Table 2: FMRI Example: Talairach Locations of Nearest Gray Matter Locations with Significant Increased Activation Across Memory Load as Ascertained by a Bootstrap Resampling Test (ICV > 2.0). X
Y
Z
Anatomical Description
Brodmann Area
32 42 −8 28 38 6 −4 −40 −24 8 −22 −28 −59 42 34 −30 −42 −6 −6 −42 −40 51 65 14 6 12 53 −51
−52 −42 3 −65 −73 −3 −11 0 1 14 −62 −72 −39 40 42 −73 −76 6 14 41 −61 −68 −39 −80 −81 −65 −53 0
50 56 62 −15 −15 11 13 48 55 3 45 46 30 18 26 −13 −10 0 1 7 −14 9 0 −16 −18 53 −14 33
Superior parietal lobule Inferior parietal lobule Medial frontal gyrus Declive Declive Thalamus Thalamus Middle frontal gyrus Subgyral Caudate Superior parietal lobule Superior parietal lobule Inferior parietal lobule Middle frontal gyrus Middle frontal gyrus Fusiform gyrus Middle occipital gyrus Caudate Caudate Inferior frontal gyrus Fusiform gyrus Middle occipital gyrus Middle temporal gyrus Declive Declive Superior parietal lobule Inferior temporal gyrus Precentral gyrus
Brodmann area 7 Brodmann area 40 Brodmann area 6 Cerebellum Cerebellum Thalamus Medial dorsal nucleus Brodmann area 6 Brodmann area 6 Caudate head Brodmann area 7 Brodmann area 7 Brodmann area 40 Brodmann area 10 Brodmann area 9 Brodmann area 19 Brodmann area 18 Caudate head Caudate head Brodmann area 46 Brodmann area 37 Brodmann area 19 Brodmann area 21 Cerebellum Cerebellum Brodmann area 7 Brodmann area 20 Brodmann area 6
Source: Results come from Talairach Daemon Client 1.1, Research Imaging Center, University of Texas Health Science Center at San Antonio.
with the notion that, compared to a separate OrT/CVA analysis of a new data set, a substantial gain in statistical power can be achieved by the forward application of a previously obtained OrT pattern estimate. In contrast to the above results, the forward application of the OrT pattern did not reveal a significant ordinal trend effect in the comparable fMRI data of 18 sleep-deprived subjects. In these later subjects, who performed the working memory task after 48 hours of sleep deprivation, the forward application of the OrT pattern of the well-rested state produced six exceptions and a p = 0.11. A separate OrT/CVA analysis of the 18 sleep-deprived subjects, again performed on the fMRI data set of the retention period, also failed to produce an activation pattern that expressed significant OrT trends.
Ordinal Trend Canonical Variates Analysis
1621
Table 3: FMRI Example: Talairach Locations of Nearest Gray Matter Locations with Significant Decreased Activation Across Memory Load as Ascertained by a Bootstrap Resampling Test (ICV < − 2.0). X
Y
−44 −57 −59 −12 24 38 28 46 38 40 59 44 14 −12 67 4 −28 −61 −20 65 46 26 −57 −14 −42 8 22 55 −63 −53 26 −20 −24 12 38 −53 14 2 −61 −4 −8 −32 67
−66 −57 −49 −66 27 −15 −45 −52 −75 −56 −53 −53 −88 −88 −32 50 13 −53 39 −16 −21 −6 −9 20 −66 −14 −39 5 −14 −65 −50 −29 −8 −25 −79 −5 −44 1 −7 −50 −75 −47 −35
Z
Anatomical Description
Brodmann Area
36 34 36 −39 41 14 −3 −24 −30 −33 36 23 25 28 16 20 −4 23 35 −1 −1 −3 −16 58 9 −3 −38 −12 −9 −12 −24 5 −5 12 6 −17 −35 29 21 −33 24 −13 −10
Angular gyrus Supramarginal gyrus Supramarginal gyrus Inferior semilunar lobule Middle frontal gyrus Insula Parahippocampal gyrus Tuber Tuber Cerebellar tonsil Supramarginal gyrus Superior temporal gyrus Cuneus Cuneus Superior temporal gyrus Medial frontal gyrus Claustrum Supramarginal gyrus Superior frontal gyrus Superior temporal gyrus Superior temporal gyrus Lentiform nucleus Inferior temporal gyrus Superior frontal gyrus Middle temporal gyrus Brainstem Cerebellar tonsil Middle temporal gyrus Middle temporal gyrus Fusiform gyrus Culmen Thalamus Lentiform nucleus Thalamus Middle occipital gyrus Middle temporal gyrus Cerebellar tonsil Cingulate gyrus Postcentral gyrus Cerebellar tonsil Cuneus Fusiform gyrus Middle temporal gyrus
Brodmann area 39 Brodmann area 40 Brodmann area 40 Cerebellum Brodmann area 8 Brodmann area 13 Brodmann area 19 Cerebellum Cerebellum Cerebellum Brodmann area 40 Brodmann area 39 Brodmann area 19 Brodmann area 19 Brodmann area 22 Brodmann area 9 Cerebellum Brodmann area 40 Brodmann area 9 Brodmann area 21 Brodmann area 22 Putamen Brodmann area 21 Brodmann area 6 Brodmann area 37 Subthalamic nucleus Cerebellum Brodmann area 21 Brodmann area 21 Brodmann area 19 Cerebellum Pulvinar Lateral globus pallidus Pulvinar Brodmann area 19 Brodmann area 21 Cerebellum Brodmann area 24 Brodmann area 43 Cerebellum Brodmann area 18 Brodmann area 37 Brodmann area 21
Source: Results come from Talairach Daemon Client 1.1, Research Imaging Center, University of Texas Health Science Center at San Antonio.
1622
C. Habeck et al.
Figure 2: Activation pattern whose subject expression shows an ordinal trend across memory load during the retention period. The pattern estimate is based on the first two OrT principal components. Pattern voxels whose absolute values exceeded a threshold value of 2 in their inverse coefficient of variation (ICV) are shown in sagittal, coronal, and transverse projection views, produced with spm99 software package. (ICV values were estimated using a bootstrap method.) (A) Positively weighted areas—areas that are increasing in activation across memory load for a majority of subjects. (B) Negatively weighted areas—areas that are decreasing in activation across memory load for a majority of subjects.
In summary, in analyzing the effects of sleep deprivation on working memory, we first applied the OrT/CVA analysis to the fMRI data of well-rested subjects to obtain an activation pattern that indicated loadrelated processing that was operative during the delay period. Although the functional connectivity captured in this activation pattern appeared to be sustained with increasing memory load in well-rested subjects, our results suggest that it had been disrupted in subjects who were sleep deprived for 48 hours. Indeed, neither a forward application of the load-related pattern nor a separate OrT/CVA of the fMRI data set of the 18 sleepdeprived subjects produced a significant ordinal trend effect. 4 Application to Imaging of Visuomotor Learning Using PET We offer here a second application of the OrT methodology, in this case to neuroimaging data obtained in a study that used H2 15 O PET to investigate a subtle form of visuomotor adaptation, the learning of a novel visuomotor gain. The neural response to the cognitive challenge was not detectable using the conventional brain-wide analysis of voxel activity (statistical parametric mapping, SPM; (Friston et al., 1996)). Notwithstanding, some of the sites of activation were predictable a priori and included brain regions that
Ordinal Trend Canonical Variates Analysis
1623
would be expected to be strongly interactive. Indeed, an SPM analysis that was restricted to predictable activation sites did reveal significant responses ( p < 0.05, corrected) during adaptation (Krakauer et al., 2003). The aims of the OrT analysis were more ambitious: to demonstrate that a brain-wide analysis, different from a voxel-wise SPM99 analysis, could detect activations in the predicted regions and that the spatial covariance pattern is significantly associated with visuomotor adaptation—that is, the expression of the OrT activation pattern provides a reliable account of the subject differences in visuomotor adaptation. The results of the OrT analysis met both aims. 4.1 Study Design. The neuroimaging study examined a form of visuomotor adaptation in which subjects performed reaching movements. Individuals additionally had the task of learning to rescale the spatial mapping between actual hand movements and the visual appearance of their trajectories displayed on a monitor (Krakauer et al., 2003). The imaging technology used was H2 15 O PET; 10 subjects participated in the study. Basic task requirements were described in detail in previous publications (Ghilardi et al., 2000; Nakamura et al., 2001). In brief, all tasks required subjects to move a handheld cursor with their right hand on a digitizing tablet (Numonics Corporation, Model 2200) while their hand and target locations were displayed on a 15 inch computer screen. A computer controlled the experiment to generate screen displays and acquire kinematic data from the digitizing tablet at 200 Hz. On the day prior to PET scanning, all subjects received a session of training on the experimental setup, during which time they achieved a level of errorless performance on a baseline condition. The baseline condition (CONTROL) required subjects to move a cursor out and back in one uninterrupted movement from a central starting position to one of eight radially arrayed circular targets. In this condition, the relation between tablet and screen was one to one: the extent and the direction of the hand trajectory on the tablet were replicated on the screen. Each out-and-back movement took 1 second, and the succession of eight out-and-back movements was counterclockwise. This eight-target cycle was repeated eight times over a 96 second period. During PET scanning, a novel learning condition (GAINalt) was covertly introduced in which the tabletto-screen gain was altered every two cycles between 1:1.5 and 1:0.5, thereby maintaining a relatively constant level of challenge across the 96 second period. Two nonconsecutive scans were acquired for each subject performing the GAINalt task, denoted GAINalt1 and GAINalt2. Subject performance during each scan was characterized as a series of learning curves, one for each pair of cycles of constant gain, which were well fitted with single exponential functions. The coefficients of these exponential functions were used as estimates of the average rates of adaptation in the session. For this, the coefficients for the 1:1.5 and 1:0.5 gain change epochs were combined
1624
C. Habeck et al.
to obtain a mean adaptation rate for each scan and subject. This estimated rate of adaptation was the performance variable used in the correlational analysis with OrT pattern expression. 4.2 PET Preprocessing Steps. The PET data analyzed were 3D, H2 15 O PET scans of a 96-second duration. The same raw count images were used in both the SPM and OrT/CVA analyses, where the images were smoothed, aligned, and mapped into MNI coordinates using the SPM99 package (SPM99, Wellcome Department of Cognitive Neurology). Raw images were masked with aprobabilistic gray matter mask at a threshold of 0.2. The entire masked raw image of each subject and condition was used in the OrT analysis. However, in the spatially restricted SPM analysis, the brain areas included were limited to the left sensorimotor cortex (BA 1, 2, 3, and 4), premotor cortex and SMA (BA 6), posterior cingulate (BA 23), parietal (BA 5, 7, 40), and visual areas (BA 17, 18), as well as the subcortical areas of the left putamen, globus pallidus, and thalamus. Both the brain-wide SPM analysis and the spatially restricted SPM analysis sought to identify differences between CONTROL activation and the average activation in averages of two GAINalt scans. By contrast, the OrT analysis was designed to allow for the possibility of task repetition effects by modeling the following ordered triad of conditions: (1) the initial 96 second period of alternating gain (GAINalt1), (2) the second, (GAINalt2), and (3) baseline (CONTROL). In terms of the OrT nomenclature, the CONTROL task served as the baseline condition B; GAINalt2, as the condition of intermediate challenge E1; and GAINalt1, as the condition of highest challenge E2. This OrT analysis therefore permitted physiological repetitionsuppression effects that took the form of a negative ordinal trend across the prespecified task ordering (Ungerleider, Doyon, & Karni, 2002). In addition, OrT allowed individual differences in the expression of the activation pattern that could be accounted for by subject differences in the repetition effect or the rate of visuomotor adaptation. 4.3 Results. The OrT method identified a pattern of regional activity that was a linear combination of the first two principal components for which its change in expression between GAINalt1 and CONTROL was significantly correlated with the subject rate of adaptation (see Figure 4). To obtain this pattern, the difference in adaptation rate between GAINalt1
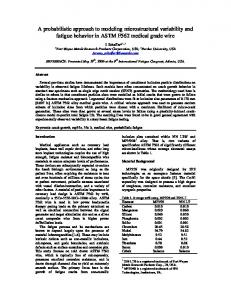
Figure 3: Subject expression of memory load–related OrT pattern constructed from the first 2 principal components of the data from the retention phase of 16 subjects for 1, 3, and 6 letters. Every subject’s expression in the 1-letter condition has been subtracted from the expression of all three conditions to heighten the visual impression of the variability in curve shapes. As a consequence, every
(B)
Pattern expression
(C)
Pattern expression
(A)
1625
Pattern expression
Ordinal Trend Canonical Variates Analysis
1 item 3 items 6 items Memory load during retention Figure 3: (cont.) subject’s pattern expression in the 1-letter conditions is now zero. (A) Task × subject expression curves for the 16 subjects from whom the pattern was originally derived. The number-of-exceptions statistic has the value 2, resulting in a p-value p < 0.01. (B) Forward application of the memory load–related pattern to 24 additional subjects, showing a preserved relationship between the task × subject expression of the pattern and memory load. The number-of-exceptions statistic has the value 5, confirming a significant ordinal trend, p < 0.001. (C) Forward application of the memory load–related pattern to the 18 sleep-deprived subjects, immediately following 48 hours of sleep deprivation. A relationship between the task × subject expression of the pattern and memory load is no longer evident. The number-of-exceptions statistic has the value 6, p = 0.11, which is insufficient to reject the null hypothesis of the absence of an ordinal trend.
1626
C. Habeck et al.
(A)
(B)
94 92 90 88 86 84
Subject network activity
% Error Reduction (initial 6 cycles)
96
82 80 Subject Network Activity: GAINAlt1 – Control
Control
GAINAlt2 GAINAlt1 Task Condition
Figure 4: (A) Relationship between the task × subject expression of the first two OrT principal components and subject rates of adaptation in the GAINalt1 and GAINalt2 conditions. Subject rates of adaptation in GAINalt1 were significantly predicted (R2 = 0.88; p < 0.01) by a linear combination of the component expressions in the individual GAINalt1—CONTROL subtraction images. Further, the expression of the same component combination in the GAINalt2— CONTROL subtraction images predicted rates of adaptation in the repeat condition (R2 = 0.55; p < 0.05; figure not shown). (B) Expression of task activity curves for each of 10 subjects for the activation pattern whose expression predicted subjects’ rates of gain adaptation. Each subject’s CONTROL value is subtracted from his GAINalt1 and GAINalt2 values, highlighting subject differences.
and CONTROL was used as the dependent variable in a multiple linear regression to produce a linear combination of the first two principal components. The p-value from the multiple regression analysis was p < 0.01. In addition, the subject × task expression of this pattern revealed that 9 of 10 subjects exhibited increasing ordinal trends from the CONTROL to GAINalt2 to GAINalt1 conditions (see Figure 4), which is a significant degree of concordance between pattern expression and the ordinal trend criterion ( p < 0.05) according to the type I error rate computed using the Monte Carlo method described earlier. In other words, the spatially unrestricted OrT/CVA revealed a pattern of activation that was statistically significant based on the criterion of ordinal trends and, separately, on the successful prediction of subject performance scores. Notwithstanding, subjects differed in the amount of decline, with some subjects showing right prefrontal-basal
Ordinal Trend Canonical Variates Analysis
sagittal
1627
coronal
transverse
Figure 5: Activation pattern whose expression in subjects’ GAINalt1— CONTROL and GAINalt2—CONTROL subtraction images predicted the respective GAINalt1 and GAINalt2 rates of adaptation. Pattern estimate is based on the first two OrT principal components. Pattern voxel values that exceed a threshold value of 2 in their ICV are shown in sagittal, coronol, and transverse projection views (spm99). The pattern consists of left medial cerebellum; left/right basal ganglia and thalamus; left/right primary and secondary visual cortices (BA 17, 18, 37); and brainstem/pons. It also shows some right frontal and prefrontal activation (BA 6, 46, 47).
ganglionic-cerebellar activity that was reduced almost to their respective null task levels, while others showed little or no reduction in activation (see Figure 4). The bootstrap pattern associated with gain adaptation identified areas similar to those identified by Krakauer et al. (2003)—the left and right putamen and the left cerebellum (see Figure 5 and Table 3)—but also showed additional activations as indicated in Table 1. It is important to state that there is no explicit consideration regarding extent of activation in the bootstrap method. Nevertheless, the number of contiguous voxels that reach significance may be a further indication of the importance of each region of the OrT pattern in mediating gain adaptation. Between the 96 second period in which subjects were initially challenged with tablet-to-screen gain changes and the second 96 second period of gain changes, individuals showed a substantial mean decline in their brain responses to the challenge in right prefrontal, basal ganglionic, and cerebellar activity. Were this level of decline to be replicated in a forward application of the OrT pattern to a new subject sample, the mean difference in OrT pattern expression would be significant at p < 0.05. 5 Discussion The role that OrT is expected to play in functional neuroimaging and cognitive neuroscience can be summarized as follows. OrT takes its place
1628
C. Habeck et al.
alongside the voxel-seeded PLS analysis as being only the second spatial covariance model that is specifically designed to recover latent aspects of functional connectivity in neuroimaging studies that involve parametric experimental designs. Both OrT and voxel-seeded PLS recover information about connectivity based solely on experimental design variables. In particular, there is no requirement in applications of either the OrT or voxel-seeded PLS analysis to provide a quantitative model of the uncertain relationship between functional brain circuitry and subject variables, such as assessments of performance in individual task conditions or general skill level (e.g., IQ or level of education). OrT and PLS analyses target distinct types of task × subject interactions, where each analysis reveals a different aspect of functional connectivity. In this regard, OrT is different in two respects. First, it models a type of task × subject interaction associated with sustained functional connectivity across graduated changes in task parameters. In fact, the interaction modeled by OrT contains information about functional connectivity that previously has not been used in either spatial covariance modeling or voxel-wise, univariate, and multivariate linear modeling. Second, although voxel-seeded PLS requires partial information about the brain regions involved in patterns of functional connectivity, OrT does not. OrT is guided simply by the theoretical prediction of directional changes in regional activity with changes in task parameter values. In short, OrT, like voxel-seeded PLS, represents a unique omnibus test of functional connectivity that is performed across multiple task conditions and the entire brain. From an applied perspective, we have presented the results of the OrT analysis of both event-related fMRI and H2 15 O PET studies of memory and learning. In part, the goal has been to demonstrate the statistical methods that are used to evaluate the specificity and sensitivity of the OrT method: detection of latent patterns that express ordinal trends on a subject-bysubject basis, estimating the salience of individual regions (voxels) in the latent OrT patterns, and the reliability of the regional weights. In addition, the empirical findings appear to have scientific merit in their own right. 5.1 Event-Related fMRI Study of Working Memory. We applied the OrT/CVA method to the retention data of a delayed-match-to-sample task in order to identify an activation pattern whose subject × task expression would reveal a positive monotonic trend with memory load. Such a pattern was successfully derived from a sample of 16 subjects ( p < 0.01) and its validity confirmed through forward application to a replication sample of 24 subjects ( p < 0.001). Figure 5 and Table 4 depict areas whose increase in activation parallels the increase in memory load found in the inferior and superior parietal lobe (BA 40, 7), the middle frontal gyrus (BA 9), and the left superior temporal gyrus (BA 22); the last region merits speculation that auditory rehearsal is taking place during the retention period (Baddeley, 2003). There also were areas that decreased their activation with increasing memory demand
Ordinal Trend Canonical Variates Analysis
1629
Table 4: PET Example: Talairach Locations of Nearest Gray Matter whose Significant Contribution to the Pattern Associated with Adaptation Rate Was Ascertained by a Bootstrap Resampling Test (ICV > 2). X
Y
−36 50 55 28 36 −26 40 −51 50 53 −63 −14 −10 22 −20 42 46 −18 32 24 14 −20 67 −8 67
−47 41 4 −12 −6 4 9 −44 −53 −65 −32 −23 −44 15 −26 −83 −46 −23 8 −84 −88 −88 −42 −60 −44
Z −13 9 31 2 −1 2 −6 −16 −12 −9 13 5 8 −4 −9 6 47 12 7 −8 23 −7 13 47 10
Anatomical Description
Brodmann Area
Fusiform Gyrus Inferior Frontal Gyrus Precentral Gyrus Lentiform Nucleus Claustrum Lentiform Nucleus Insula Fusiform Gyrus Inferior Temporal Gyrus Middle Occipital Gyrus Superior Temporal Gyrus Thalamus Posterior Cingulate Lentiform Nucleus Parahippocampal Gyrus Middle Occipital Gyrus Inferior Parietal Lobule Thalamus Claustrum Middle Occipital Gyrus Cuneus Middle Occipital Gyrus Superior Temporal Gyrus Precuneus Superior Temporal Gyrus
Brodmann area 37 Brodmann area 46 Brodmann area 6 Putamen ∗ Putamen Brodmann area 13 Brodmann area 37 Brodmann area 20 Brodmann area 37 Brodmann area 22 Pulvinar Brodmann area 29 Putamen Brodmann area 28 Brodmann area 19 Brodmann area 40 Pulvinar ∗ Brodmann area 18 Brodmann area 19 Brodmann area 18 Brodmann area 22 Brodmann area 7 Brodmann area 22
Source: Results come from Talairach Daemon Client 1.1, Research Imaging Center, University of Texas Health Science Center at San Antonio.
during the retention period, featuring the anterior and posterior cingulate gyri (BA 31,24) and the medial frontal gyrus (BA 10). Deactivations with experimental task parameters have received more attention in recent years and offer some points of contact with our results. The specific neuroanatomy of connections between medial and lateral prefrontal cortices as well as other cortical areas is an area of ongoing research (Barbas, 2000; Barbas, Ghashghaei, Dombrowski, & Rempel-Clower, 1999) that posits that the connectivity among these particular regions of PFC and posterior regions (involved in oculomotor guidance and spatial attention) contributes to the synthesis of memory, cognition, and emotion in general. A recent study using working-memory with an N-back design (Pochon et al., 2002) also found anterior medial prefrontal deactivating with increasing memory load. The authors of this study offer a rationale for the deactivation of the medial prefrontal cortex that is consistent with the general resource account framework (Engle, Conway, Tuholsky, & Shisler, 1995).
1630
C. Habeck et al.
A shift of resources away from ongoing, but inessential, processes to an increasingly demanding cognitive task might underlie the medial prefrontal deactivation in accordance with this framework. The amount of this shift might still be subject dependent, with a fixed ratio between activity increases and decreases, and result in a large covariance between areas detectable by a multivariate analysis technique. Because of the role of prefrontal limbic cortices (i.e., orbitofrontal and medial prefrontal cortices) in emotional processing (Barbas, 2000), the results suggest that a shifting balance during higher cognitive processing causes increasing activity in cortical cognitive areas and decreasing activity in the limbic and paralimbic structures. Such reciprocal changes in brain activation associated with emotional and cognitive processing are also found in mood disorders such as depression (Mayberg et al., 1999), although with a different relative sign to our findings. In depressed patients, hyperactivity in limbic and paralimbic areas is accompanied by decreased activity in cortical areas, resulting in worse cognitive performance. Negative mood and high memory demand might thus be interpreted as opposite ends of a common continuum, which is reflected in sustained functional connectivity (i.e., a fixed correlative relationship between regional activation), resulting in the changing level of expression of one covariance pattern only. Although the functional connectivity captured in the above activation pattern appears to be sustained with increasing memory load in well-rested subjects, it appears to be disrupted in subjects who were sleep deprived for 48 hours. In other words, one effect of sleep deprivation on working memory—in the retention period—is to disrupt the particular memory processing that normally mediates letter retention at low to moderate memory loads. This conclusion is based on two OrT analytic results. First, the fMRI data of 18 sleep-deprived subjects failed to produce significant positive ordinal trends when the OrT pattern that revealed positive ordinal trends in 40 well-rested subjects was forward-applied. Second, an independent OrT/CVA analysis of the 18 sleep-deprived subjects failed to produce an activation pattern that expressed significant ordinal trends. Apparently the effect of sleep deprivation is not simply to increase the load on the memory processes that are normally operating in well-rested subject at low to moderate load levels. The effect of sleep deprivation on working memory may be to induce nonadditive or nonmultiplicative load effects on memory processing, where the effects may be different in different individuals. 5.2 H2 15 O PET Study of Visuomotor Learning. We applied the OrT method to an H2 15 O data set obtained in a study of visuomotor learning. These PET data had previously been analyzed using SPM99 with conventional voxel-by-voxel modeling (Krakauer et al., 2003). A statistical significant activation pattern was obtained using OrT, where many of the regions with reliable levels of activation were predicted a priori. These regions include several of those normally activated during the execution of
Ordinal Trend Canonical Variates Analysis
1631
overlearned hand movements (i.e., the CONTROL task), which are not activated during sensory control tasks. In this regard, the OrT activation was similar to the pattern obtained in a spatially restricted SPM comparison of the gain adaptation task (i.e., the GAINalt task) and the CONTROL task. In the latter SPM analysis, a spatial mask was used to achieve statistically significant results. This mask delimited areas that routinely had been demonstrated to be activated during the execution of overlearned hand movements: the left primary sensorimotor cortex, (BA 3, 2, 1 and 4), premotor cortex and SMA (BA6), posterior cingulate (BA 23), parietal (BA 5,7,40), and visual areas (BA 17,18) as well as the subcortical areas of the left putamen, globus pallidus, thalamus, and cerebellum. The latter SPM analysis was based on the expectation that the brain areas that mediate gain adaptation reside for the most part within the motor network that is responsible for the execution of overlearned hand movements. However, right prefrontal areas of activation, which do not normally occur during overlearned hand movements, were also part of the OrT activation pattern. Potentially this combination of prefrontal, basal ganglionic, and cerebellar activation sites represents a pattern of strongly functionally connected brain areas. Moreover, combined with the significant association between the OrT pattern expression and subject rates of gain adaptation, the OrT finding raises the possibility that prefrontal regions may be involved in some aspect of gain adaptation. The necessary caveat is that the potential contribution of this discovery relies on a future series of more elaborate experimental investigations into the functional connectivity between prefrontal cortex, basal ganglia, and cerebellum during visuomotor adaptation. 5.3 The Invention of the OrT Design Matrix and Why the Matrix Works. As one might imagine, the OrT design matrix was not invented through a random process of trial and error. Although there was no guarantee that a matrix multiplication approach (i.e., a CVA approach) would actually work, we sought to design a matrix that selectively enhanced the voxel × task × subject variance of patterns that expressed ordinal trends. It was necessary to specify explicitly the different types of latent patterns whose voxel × task × subject variance must be reduced in the transformed data set. Without that stipulation, the application of PCA or SVD to the transformed data set would not necessarily produce major principal components that provided a good approximation to one or more patterns that express ordinal trends. By design, the OrT analysis relies on the major principal components to provide good approximations to patterns that express ordinal trends. As suggested in section 1, the invention of the OrT design matrix required a thorough understanding of the possible similarities and differences between the voxel × task × subject variances of patterns that express ordinal trends and patterns that do not. On the one hand, there are the similarities and differences between patterns that express the predicted mean trend and
1632
C. Habeck et al.
patterns that express mean directional changes that are different from the predicted trend. On the other hand, there are similarities and differences between patterns that express mean trends in the predicted direction but different types of task × subject interactions. Finally, there are similarities and differences between patterns that express ordinal trends in the predicted direction but exhibit different amounts of voxel × task × subject variance in the original data set. The OrT design matrix we invented reduced these similarities and differences to just three factors: task mean differences, within-task variances, and intertask correlations. To appreciate the importance of the novel third factor, consider a series of three experimental conditions, labeled B-E 1 E2, in which features 1 and 2 are identical in all the latent patterns of the data set, whereas the intertask correlations are different. Indeed, suppose it is ρit = CORR(b, e1 )/2 + CORR(e1 , e2 )/2 that distinguishes latent patterns that express ordinal trends from patterns that do not. In patterns that express ordinal trends, the (mean) intertask correlation will be moderately to highly positive—indeed, significantly more positive than the intertask correlations of patterns that do not express ordinal trends. A Monte Carlo sampling of 100,000 families of subject ordinal trends (across B-E 1 -E2 for 13 subjects) illustrates the statistical robustness of this identifying feature of OrT patterns (see Figure 6). In the OrT transformed data set, intertask correlations appear as an explicit term in the algebraic expression of the voxel × task × subject variance of individual latent patterns. For a simple example, consider the miniature data set described in section 2, which consisted of just two experimental conditions. In this example, the contributions of each latent pattern to the 2 × 2 regional covariance matrix Y! [Q(Q! Q)−1 ]Q! Y of the transformed data set is the variance VAR(b + e1 ) = VAR(b) + VAR(e1 ) + 2COV(b, e1 ) associated with the latent pattern. In OrT analyses involving a series of three or more tasks, the contribution of each latent pattern to the meancentered covariance matrix also includes the additive factor of the squared mean differences between tasks. The difference in the COV(b, e1 ) values for the OrT and non-OrT patterns, which corresponds to the difference in their intertask correlations, was the unique factor that distinguished the two covariance patterns. In fact, for the OrT pattern in the miniature data set, COV(b, e1 ) was a large positive value contributing additively to the overall variance of the OrT pattern in [Q(Q! Q)−1/2 ]! Y, whereas COV(b, e1 ) was zero for the non-OrT pattern. The intertask correlations depicted in the Monte Carlo simulations of Figure 6 and in the miniature data set are a feature of all covariance matrices of OrT transformed data sets, regardless of the number of experimental conditions in the parametric series. The recognition that intertask correlations were a key feature of OrT patterns meant that our search for an optimal design matrix for OrT/CVA was limited to high-dimensional design matrices: namely T ∗ N × (T − 1)∗ N
Ordinal Trend Canonical Variates Analysis
1633
Cumulative frequency
1
0.8
D
B
C
A
0.6
0.8
0.6
0.4
0.2
0 −1
−0.8
−0.6 −0.4
−0.2
0
0.2
0.4
1
Inter–task r
Figure 6: Correlational statistics for a Monte Carlo simulation of random samples of monotonic curves, computed for task triplets (ordered B-E1 -E2) and 13 subjects. Specifically, the cumulative distribution functions are depicted for (A) the maximum of CORR(b, e1 ) and CORR(e1 , e2 ); (B) the difference between this maximum value and Corr(b, e2 ); (C) Corr(b, e2 ); and (D) the difference between the minimum of the pair CORR(b, e1 ) and CORR(e1 , e2 ), and CORR(b, e2 ). Vertical lines indicate median and 5 percent values for individual cumulative distribution functions.
matrices. Our strategy for testing candidate matrices was to investigate simulated data sets in which low-dimensional design matrices failed in a significant way to recover latent patterns with ordinal trends. The latter design matrices are those frequently used in either voxel-wise univariate or multivariate analyses or in PLS analyses. Our test of feasibility was that the OrT design matrix Q did not fail in these worst-case scenarios. (See the appendix for details.) 5.4 Conclusion. The OrT analyses of the event-related fMRI and H2 15 O PET studies revealed patterns that suggested the presence of sustained functional activity in the face of considerable subject variation in the trajectories of their ordinal trends. Moreover, in this article, we have argued that although it may be difficult to anticipate the impact that normal subject
1634
C. Habeck et al.
variation has on regional functional connectivity, individual variation can be treated as an additional experimental dimension in neuroimaging studies rather than as an unexplained phenotypic variation. The OrT approach is to model functional connectivity as interactions between experimental parameters and endogenous variables. Indeed, these interactions, like any other type of experimental effect, must be relatively large to be reliably measured. In other words, OrT performs best when applied to studies that achieve an optimal trade-off between study designs that include normal phenotypic variation and experimental designs that exert sufficient control over individual differences so as to achieve sustained functional connectivity. At the same time, OrT analysis takes full advantage of experimental parametric designs to maximize statistical specificity. In particular, the specificity of the analysis increases dramatically with the number of conditions in the series. The probability of a predicted ordinal trend occurring by chance in one subject alone equals (T!)−1 ; the conjunction across subjects thus yields a probability of (T!)−N , explaining how the specificity of the method increases with the number of tasks and subjects. Moreover, statistical specificity increases in the OrT analyses considerably more rapidly than it does when analyses are limited to T × (T − 1)/2 pair-wise comparison tests that are corrected for multiple comparisons. The OrT experimental strategy would appear to be appropriate for studying not only young adults and their cognitive abilities, but also normal aging (Cabeza et al., 1997; Grady et al., 2003; Stern et al., in press) and neurological and psychiatric diseases (Alexander et al., 1999; Eidelberg et al., 1998; Fukuda et al., 2001). On the other hand, as we pointed out earlier, voxel-seeded PLS analyses have been particularly successful in detecting altered functional connectivity, which is also of considerable scientific value. Indeed, some neuroscientists (e.g., Kosslyn et al., 2002) would argue that individual differences in cognitive style would persist even in an ideal world without the practical limitations of experimental design, imaging technologies, and statistical sampling. Overall, OrT and voxel-seeded PLS together are useful for verifying the robustness of our cognitive theories in the face of factors whose influence on mental activity we do not yet know much about. For all the above reasons, both OrT and PLS analyses may take a prominent place in the toolkit of the multivariate modeler of brain imaging data. Appendix: Derivation and Validation of OrT Design Matrix To answer whether a design matrix achieves a salience enhancement of the effects of interest is difficult. It supposes that the very knowledge sought after—knowledge of the underlying covariance structure of the
Ordinal Trend Canonical Variates Analysis
1635
data constituted by targeted and nontargeted activation patterns—is known beforehand, which is impossible. Monte Carlo simulations, on the other hand, afford a model instantiation of a data set with precise knowledge of the targeted and nontargeted activation patterns prior to the analysis, allowing a thorough assessment of the performance of different design matrix and analytic method choices in identifying the targeted activation patterns. This is not to claim that Monte Carlo simulations are an adequate substitute for the complexity of real neuroimaging data, but if these simple scenarios show deviations from the performance characteristics anticipated for routinely chosen design matrices, there is ground for suspicion that in the case of real-world neuroimaging data, the problems would be compounded. Monte Carlo simulations therefore present a test bed for verification (and possibly correction) that our intuitions about the performance of design matrix choices really hold up.
A.1 Unique Target Features. The objective of the OrT design matrix is to assign maximum salience to monotonic task-activity curves. One unique feature is that a family of N monotonic curves, randomly sampled from the set of all possible tripoint monotonic curves, nearly always exhibits positive intertask correlations between the subject levels of pattern expression. Second, of the three correlations among tasks, the largest is between consecutively ordered tasks, thereby identifying the third task as an end point of the ordering. Indeed, in a majority of cases, the two correlations between consecutively ordered tasks are greater than the correlation between nonconsecutively ordered tasks, thereby identifying both end points of the ordering. An elementary model of random between-task changes in pattern expression illustrates the stochastic features of a random sample of monotonic curves. For a task ordering B-E 1 -E2, the targeted pattern’s activity levels in tasks E 1 and E2, denoted e1 and e2 , respectively, are constructed from sums of identical and independently distributed random variables b, !E1 − B and !E2 − E1 , where each is a positive-valued random variable sampled from the uniform distribution U(0,1). e1 is distributed as b + !E1 − B and e2 as b + !E1 − B + !E2 − E1 . These assumptions guarantee monotonic curves with as few constraints and as good a generality as possible. With increasing parametric load as specified by the task conditions, subjects increase their expression of the targeted topography, although the amount of the increase is independent of the current level of expression. As a consequence, the expected value of all three intertask correlations is positive, and in the majority of the cases, it holds that
min{CORR(b, e1 , CORR(e1 , e2 )} > CORR(b, e2 ).
1636
C. Habeck et al.
Figure 6 charts the results of a Monte Carlo simulation of 100,000 random samples of tripoint monotonic curves in which the correlations between consecutively ordered tasks are compared, sample by sample, to the correlation between nonconsecutively ordered tasks. The nonnegativity of the correlational statistics for cumulative distribution functions depicted in Figures 6A, 6B, and 6C is characteristic of almost all randomly sampled families of monotonic curves, even when b, !E1 − B and !E2 − E1 are not identically distributed. When comparing the factors that determine pattern salience in the original data Y and the factors that determine pattern salience for the OrTtransformed data [Q(Q! Q)−1/2 ]! YP in the OrT analysis, the weight given to the nonnegativity of intertask correlations is immediately evident. In the untransformed data sets, the factors that determine salience are the spatial extent of the pattern activation, the size of the mean trend effect, and the subject variance in within-task expression. Indeed, from the perspective of neuromodeling, we consider the worst-case scenario as the one where every nontarget is equal to that of the target in each of these variables. By comparison, in the OrT transformed data matrix [Q(Q! Q)−1/2 ]! YP there are four features of pattern expression that determine pattern salience: the spatial extent of the pattern activation, the size of the mean trend (i.e., the squared difference between the means of the summed pattern expressions b + e1 and e1 + e2 ), the subject variance in within-task expression, and the intertask correlations between subjects’ pattern expression for tasks B and E 1 and tasks E 1 and E2. In a comparison of the two lists of determinants of pattern salience, the principal difference is the increased salience with positive intertask correlations.
A.2. Monte Carlo Simulations. A.2.1 Data Set Design. The worst-case scenarios that are reported here are those in which the salience of every nontarget is equal to that of the target in the untransformed data Y. More specifically, each nontarget activation pattern is comparable to the target pattern in terms of the spatial extent of the pattern activation, the size of the mean trend effects in pattern expression, and the subject variance in within-task expression. The similarities between the targeted and nontargeted component processes have been further augmented. First, there is complete overlap in the voxels activated by the targeted and nontargeted component processes. Second, one or more nontargeted activation patterns exhibit a mean task trend identical to that expressed by the target pattern, although they differ from the target in that they do not express positive intertask correlations. Third, other nontargeted activation patterns express positive intertask correlations, although they differ from the target in the direction of their mean task trends. In the Monte Carlo simulations reported here, individual data sets consist of three task conditions in which the activation patterns of seven component
Ordinal Trend Canonical Variates Analysis
1637
processes are superimposed. The raw data matrix Y can thus be denoted as b e1 z$k . Y= k=1 e2 k 7 +
The index k here denotes the different topographies, and zk therefore is a column vector with a number of rows equal to the number of voxels or regional resolution elements. Even without application of the projection operator P that removes the task-independent effects, one can appreciate the salience enhancement achieved through the application of the OrT design matrix Q by computing the voxel × voxel covariance matrix of Q$ Y, Y! Q(Q! Q)−1 Q! Y ≈
7 + ) 2 * b + 2e21 + e22 + 2b · e1 + 2e1 · e2 k zk z!k .
k=1
The shadow processes essentially have zero intertask covariance in their subject expression. The ordinal trend effects for the alternative task orderings B-E2-E 1 and E 1 -B-E2 still have some residual intertask covariances, but as shown in Figure 6, in most cases these are lower than for the ordinal trend effects of the ordering B-E 1 -E2. All seven patterns are nonfocal activations, where the relative distribution function of voxel weights is matched in the different component processes. In each data set, voxel weights are sampled from the uniform distribution U(0,1) and independently distributed in different component processes. The number of voxels used in these simulated data sets is 500, approximating the number of resels normally contained in smoothed PET and fMRI images. In this Monte Carlo simulation, data sets consisted of 39 task × subject scans, or three scans for each of 13 subjects. No voxel noise was overlaid on these composite patterns of component activations. Taken as a whole, each composite activation pattern of a data set may be thought of as representing the footprint of the larger functional brain architecture that is common to all subjects and tasks. Figure 7 demonstrates some representative task-activity curves for the subject expression of the all the activation patterns used in the simulations. Among the seven activation patterns in a data set, there was a target for each of the three task orderings—an activation pattern that expressed monotonic task-activity curves for all subjects for all possible task orderings B-E1-E2, B-E2-E1, and E1-B-E2. (The end points in a task ordering are interchangeable since monotonically increasing and decreasing subject expressions are equivalent; therefore, there are three rather than six different combinations.) The effect size of the mean trend was the same in all three of these activation patterns. The remaining four activation patterns were nontargets with
1638
C. Habeck et al.
(A)
(B)
Target for B/E1/E2
Shadow of target for B/E1/E2
Target for B/E2/E1
Shadow of target for B/E2/E1
Target for E1/B/E2
Shadow of target for E1/B/E2
B
E1
E2
B
E1
E2
Figure 7: Representative illustration of the task-activity curves in the subject expression of 6 different types of activation patterns used for the Monte Carlo simulations. Column (A) shows processes that display ordinal trends for 3 different task orderings: B-E1-E2, E1-B-E2, and B-E1-E2. Column (B) shows the corresponding shadow processes—activation patterns whose subject expressions show the same monotonic increase in activity on the mean and have the same within-task variances, while allowing a substantial number of subjects to violate the requirement of monotonicity.
intertask correlations of zero, although the direction of a pattern’s mean trend was the same as that in one of the former three activation patterns. For this reason, we refer to each of the latter four activation patterns as a nontargeted shadow process. The elementary model of random between-task changes in pattern expression described in section A.1 was used to generate the family of monotonic task-activity curves for the former three activation patterns. The three sets of three model random variables were identically and independently
Ordinal Trend Canonical Variates Analysis
1639
distributed. Task expressions in the remaining four nontarget activation patterns were independently distributed as well. One hundred thousand simulations were performed to sample the different possible families of monotonic task-activity curves adequately. In the simulations reported here, we used the uniform distribution as the sampling distribution for within-task pattern expressions. However, simulations were also run using a normal sampling distribution, and practically identical results were obtained. A.2.2 OrT Performance. Performance assessment of the OrT analysis is based on the degree to which this CVA has enhanced the salience of targeted activation pattern. Enhanced salience is a relative judgment based on the comparison of the similarities between the activation pattern of the simulated target and the major singular images of OrT/CVA versus the similarity between the target and the major eigen images of the untransformed data YP. The indices of similarity are, respectively, the accuracy with which the first four singular images of OrT/CVA predict the targeted activation pattern in a multiple linear regression analysis and the accuracy with which the first four eigen images of YP predict the target pattern. The respective multiple linear regression coefficients (R2 ) are used as a goodness-of-fit measure for individual data sets. The same task ordering was used to specify the targeted pattern in all data sets. In order to avoid confusion with the examples of Ort/CVA before, we stress again that no inferential assessment was conducted in these simulations; neither was the ordinal trend evaluated in terms of statistical significance, nor was a bootstrap estimation of the robustness of voxel weights performed. The R2 statistic merely captures how much information about the target is captured by the first few principal components. This involves a multiple linear regression that presumes perfect knowledge of the targeted activation pattern—something that is impossible in a real-world neuroimaging context. R2 encodes the upper limit of what is maximally knowable about the target for each design matrix tested. The cumulative distribution functions (CDFs) of the R2 values were tabulated for the entire Monte Carlo simulation for both OrT/CVA and YP. The degree to which OrT/CVA provides a better R2 CDF than YP is the benchmark used to quantify the OrT/CVA enhancement of target salience. We also include a comparison of the OrT CDF with the CDFs associated with two other CVA design matrices that do not assign positive weight to intertask correlations. We used the Helmert design matrix (i.e., performed the SVD on [H(H$ H)−1/2 ]$ Y), as well as the design matrix of mean trends (McIntosh et al., 1996), M. M is a 3N × 2 matrix, containing as predictors the mean Helmert contrasts according to
−1 1 M = 1 1 . 0 −2
1640
C. Habeck et al.
The matrix [M(M$ M)−1/2 ]$ Y is then submitted to SVD, yielding 2 singular images. These comparisons afford an independent verification that the intertask correlations are essential to maximizing the salience of activation patterns that express monotonic task-activity curves. As discussed before, the Helmert design matrix assigns pattern salience to activation patterns in a manner that weights intertask correlations negatively. Meantrend CVA does not capture subject differences at all and can therefore be expected to perform less well than OrT/CVA. For the Monte Carlo simulations of the worst-case scenario, we therefore anticipated the CVA of mean trend effects as well as CVA with the Helmert design matrix to yield a target recovery that is not only inferior to that of OrT/CVA, but also inferior to that of an analysis of the minimally transformed data YP (demonstrating the unfortunate impact of an ill-chosen design matrix). Figure 8 presents the results of two Monte Carlo simulations of (1) the worst-case scenario, in which the mean trends of the four nontargeted shadow process are equal in size to mean trends of the other three activation patterns, and (2) a less severe scenario, in which the mean trends of the shadow processes are zero. For each of the two simulations, the three CVA design matrices were applied to YP for each of 100,000 data sets Y. For the OrT and Helmert CVAs, the first four singular images were used to predict the simulated target pattern of regional activation in a multiple linear regression analysis. For the CVA mean trend analysis, its two singular images were used in the regression analysis. The cumulative distribution function of the regression R2 was tabulated for 100,000 data sets, for each CVA method. These R2 CDFs were compared with the R2 CDF computed using the first four eigen images of YP. The findings for the CVA mean trend analysis and Helmert CVA are presented in Figures 8A and 8C. Figure 8A depicts the findings for the worst-case scenario. The R2 CDF of the Helmert CVA is shifted to the left of the CDF of YP. The relative positions of these two CDFs indicate that the targeted activation pattern actually has diminished salience in the Helmert CVA approach. The R2 CDF of the mean trend CVA is also shifted to the left of the YP-CDF—albeit slightly more so than the CDF of the Helmert CVA. A similar ordering of the R2 CDFs was obtained for data sets in which the shadow processes exhibited no mean task differences. In Figure 8C, the Helmert R2 CDF is shifted slightly to the left of the CDF of the mean trend CVA, which is shifted to the left of the CDF for YP. OrT/CVA produced better results, which are depicted in Figures 8B and 8D. In Figure 8B, the R2 CDFs are computed for data sets in which the mean trends of the nontargeted shadow process are equal in size to mean trends of the remaining three activation patterns. The median R2 value of the OrT/CVA was 0.72, indicating that for half of the simulated data sets, 72% or more of the variance of the target’s regional pattern weights was
Ordinal Trend Canonical Variates Analysis
1641
(B)
(A)
Cumulative frequency
1
Matching mean trend
0.8
M
0.6
0.6
0.4
0.4
0.2
0.2 0
Cumulative frequency
0.8
I
H
0.2
0.4
0.6
0.8
1 1
0.8
0.8
I
Q
0.4
0.2
0.2 0.2
0.4
0.6
2
R
0.8
0.2
0.4
0.6
1
0.8
I
0.6
0.4
0
H M I
0
1
0.6
No mean trend
1
0
0.2
0.4
0.6
0.8
1
Q
1
2
R
Figure 8: OrT sensitivity to ordinal trends relative to that of a PCA on the reduced data matrix YP and two other CVAs—Helmert CVA and mean trend CVA. Target sensitivity charted as CDFs—Q, OrT; I, YP; H, Helmert; and M, mean trend—of the R2 regression statistic for two Monte Carlo simulations involving different shadow processes. (A) Four shadow processes with mean trends equal in size to that of the targeted component process. (B) Four shadow processes with no mean trend. Vertical lines indicate median and 5 percent R2 values for individual CDFs.
accounted for by the first four singular images. Fewer than 5 percent of the data sets produced R2 values below 0.38. The OrT CDF is shifted to the right of the R2 CDF of YP, indicating that the targeted activation pattern has markedly enhanced salience in the OrT approach. In this comparison, there is a 30% improvement in the median R2 value and a 65% improvement in the R2 value below which fewer than 5 percent of the data sets produced poorer predictions. Compared to the Helmert CVA, the OrT/CVA produced
1642
C. Habeck et al.
a 255% improvement in the median R2 value, and a 270% improvement at the 5 percent R2 value. An enhancement of target salience by OrT/CVA was also achieved in the data sets in which the shadow processes exhibited no mean task differences, as depicted in Figure 8D. The median R2 value of OrT/CVA is 0.87, indicating that for half of the simulated data sets, 87% or more of the variance of the target’s regional pattern weights was accounted for by the first four singular images. As before, the OrT CDF is shifted to the right of the R2 CDF of YP. In this comparison, there is a 10% improvement in the median R2 value, and a 20% improvement in the R2 value below which fewer than 5 percent of the data sets produced poorer predictions. Finally, compared to Helmert CVA, OrT/CVA produced a 45% improvement in the median R2 value and a 50% improvement at the 5 percent R2 value. Acknowledgments We thank Eric Zarahn and two anonymous reviewers for a critical reading of the manuscript for this article and many helpful questions and suggestions. This work was supported by federal grants NINDS R01 NS35069, NIA R01 AG16714 and NS02138. References Abbott, A. (2002). Alpine detector fails to confirm Italian sighting of dark matter. Nature, 417(6889), 575–576. Alexander, G. E., Mentis, M. J., Van Horn, J. D., Grady, C. L., Berman, K. F., Furey, M. L., Pietrini, P., Repoport, S. I., Schapiron, M. B., & Moeller, J. R. (1999). Individual differences in PET activation of object perception and attention systems predict face matching accuracy. Neuroreport, 10(9), 1965–1971. Baddeley, A. (1988). Cognitive psychology and human memory. Trends Neurosci., 11(4), 176–181. Baddeley, A. (2003). Working memory: Looking back and looking forward. Nat. Rev. Neurosci., 4(10), 829–839. Barbas, H. (2000). Connections underlying the synthesis of cognition, memory, and emotion in primate prefrontal cortices. Brain Res. Bull., 52(5), 319–330. Barbas, H., Ghashghaei, H., Dombrowski, S. M., & Rempel-Clower, N. L. (1999). Medial prefrontal cortices are unified by common connections with superior temporal cortices and distinguished by input from memory-related areas in the rhesus monkey. J. Comp. Neurol., 410(3), 343–367. Braver, T. S., Cohen, J. D., Nystrom, L. E., Jonides, J., Smith, E. E., & Noll, D. C. (1997). A parametric study of prefrontal cortex involvement in human working memory. Neuroimage, 5(1), 49–62. Cabeza, R., Anderson, N. D., Houle, S., Mangels, J. A., & Nyberg, L. (2000). Agerelated differences in neural activity during item and temporal-order memory
Ordinal Trend Canonical Variates Analysis
1643
retrieval: A positron emission tomography study. J. Cogn. Neurosci., 12(1), 197– 206. Cabeza, R., McIntosh, A. R., Tulving, E., Nyberg, L., & Grady, C. L. (1997). Agerelated differences in effective neural connectivity during encoding and recall. Neuroreport, 8(16), 3479–3483. DeFelipe, J., Elston, G. N., Fujita, I., Fuster, J., Harrison, K. H., Hof, P. R., Kawaguachi, Y., Martin, K. A. C., Kockland, K. S., Thomson, A. M., Wang, S. H., White, E. L., & Yuste, R. (2002). Neocortical circuits: Evolutionary aspects and specificity versus nonspecificity of synaptic connections: Remarks, main conclusions and general comments and discussion. J. Neurocytol., 31(3–5), 387– 416. Efron, B., & Tibshirani, R. J. (1994). An introduction to the bootstrap. New York: CRC Press. Eidelberg, D., Moeller, J. R., Antonini, A., Kazumata, K., Nakamura, T., Dhawan, V., Budman, C., & Feigin, A. (1998). Functional brain networks in DYT1 dystonia. Ann. Neurol., 44(3), 303–312. Engle, R. W., Conway, A. R. A., Tuholsky , S. W., & Shisler, R. J. (1995). A resource account of inhibition. Psychological Science, 6, 122–125. Felleman, D. J., & Van Essen, D. C. (1991). Distributed hierarchical processing in the primate cerebral cortex. Cereb. Cortex, 1(1), 1–47. Fernandez-Duque, D., Baird, J. A., & Posner, M. I. (2000a). Awareness and metacognition. Conscious Cogn., 9(2 Pt. 1), 324–326. Fernandez-Duque, D., Baird, J. A., & Posner, M. I. (2000b). Executive attention and metacognitive regulation. Conscious Cogn., 9(2 Pt. 1), 288–307. Friston, K. J., Fletcher, P., Josephs, O., Holmes, A., Rugg, M. D., & Turner, R. (1998). Event-related fMRI: Characterizing differential responses. Neuroimage, 7(1), 30– 40. Friston, K. J., Frith, C. D., Liddle, P. F., & Frackowiak, R. S. (1991). Comparing functional (PET) images: The assessment of significant change. J. Cereb. Blood Flow Metab., 11(4), 690–699. Friston, K. J., Frith, C. D., Liddle, P. F., & Frackowiak, R. S. (1993). Functional connectivity: The principal-component analysis of large (PET) data sets. J. Cereb. Blood Flow Metab., 13(1), 5–14. Friston, K. J., Holmes, A. P., Worsley, K. J., Poline, J. P., Frith, C. D., & Frackowiak, R. S. J. (1996). Statistical parametric maps in functional imaging: A general linear approach. Human Brain Mapping, 4(1), 58–73. Friston, K. J., Josephs, O., Zarahn, E., Holmes, A. P., Rouquette, S., & Poline, J. (2000). To smooth or not to smooth? Bias and efficiency in fMRI time-series analysis. Neuroimage, 12(2), 196–208. Fukuda, M., Mentis, M. J., Ma, Y., Dhawan, V., Antonini, A., Lang, A. E., Lozano, A. M., Hammerstad, J., Lyons, K., Koller, W. C., Moeller, J. R., & Eidelberg, D. (2001). Networks mediating the clinical effects of pallidal brain stimulation for Parkinson’s disease: A PET study of resting-state glucose metabolism. Brain, 124(Pt. 8), 1601–1609. Gerstein, G. L., Perkel, D. H., & Subramanian, K. N. (1978). Identification of functionally related neural assemblies. Brain Res., 140(1), 43–62.
1644
C. Habeck et al.
Ghilardi, M., Ghez, C., Dhawan, V., Moeller, J., Mentis, M., Nakamura, T., Antonini, A., & Eidelberg, D. (2000). Patterns of regional brain activation associated with different forms of motor learning. Brain Res., 871(1), 127–145. Grady, C. L., McIntosh, A. R., & Craik, F. I. (2003). Age-related differences in the functional connectivity of the hippocampus during memory encoding. Hippocampus, 13(5), 572–586. Habeck, C., Rakitin, B. C., Moeller, J., Scarmeas, N., Zarahn, E., Brown, T., & Stern, Y. (2004). An event-related fMRI study of the neurobehavioral impact of sleep deprivation on performance of a delayed-match-to-sample task. Brain Res. Cogn. Brain Res., 18(3), 306–321. Horwitz, B. (1991). Functional interactions in the brain: Use of correlations between regional metabolic rates. J. Cereb. Blood Flow Metab., 11(2), A114–120. Kosslyn, S. M., Cacioppo, J. T., Davidson, R. J., Hugdahl, K., Lovallo, W. R., Spiegel, D., & Rose, R. (2002). Bridging psychology and biology: The analysis of individuals in groups. Am. Psychol., 57(5), 341–351. Krakauer, J. W., Ghilardi, M. F., Mentis, M., Barnes, A., Veytsman, M., Eidelberg, D., & Ghez, C. (2003). Differential cortical and subcortical activations in the learning of rotations and gains for reaching: A PET study. J. Neurophysiol., 91(2), 924–933. Mayberg, H. S., Liotti, M., Brannan, S. K., McGinnis, S., Mahurin, R. K., Jerabek, P. A., Silva, J. A., Tekell, J. L., Lancaster, J. L., & Fox, P. T. (1999). Reciprocal limbic-cortical function and negative mood: Converging PET findings in depression and normal sadness. Am. J. Psychiatry, 156(5), 675–682. McIntosh, A. R. (1999). Mapping cognition to the brain through neural interactions. Memory, 7(5–6), 523–548. McIntosh, A. R., Bookstein, F. L., Haxby, J. V., & Grady, C. L. (1996). Spatial pattern analysis of functional brain images using partial least squares. Neuroimage, 3(3 Pt. 1), 143–157. McIntosh, A. R., & Gonzalez-Lima, F. (1994). Network interactions among limbic cortices, basal forebrain, and cerebellum differentiate a tone conditioned as a Pavlovian excitor or inhibitor: Fluorodeoxyglucose mapping and covariance structural modeling. J. Neurophysiol., 72(4), 1717–1733. McIntosh, A. R., Rajah, M. N., & Lobaugh, N. J. (1999). Interactions of prefrontal cortex in relation to awareness in sensory learning. Science, 284(5419), 1531–1533. Mellet, E., Tzourio-Mazoyer, N., Bricogne, S., Mazoyer, B., Kosslyn, S. M., & Denis, M. (2000). Functional anatomy of high-resolution visual mental imagery. J. Cogn. Neurosci., 12(1), 98–109. Naatanen, R., Tervaniemi, M., Sussman, E., Paavilainen, P., & Winkler, I. (2001). “Primitive intelligence” in the auditory cortex. Trends Neurosci., 24(5), 283–288. Nakamura, T., Ghilardi, M. F., Mentis, M., Dhawan, V., Fukuda, M., Hacking, A., Moeller, J. R., Ghez, C., & Eidelberg, D. (2001). Functional networks in motor sequence learning: Abnormal topographies in Parkinson’s disease. Hum. Brain Mapp., 12(1), 42–60. Ostriker, J. P., & Steinhardt, P. (2003). New light on dark matter. Science, 300(5627), 1909–1913. Petersson, K. M., Nichols, T. E., Poline, J. B., & Holmes, A. P. (1999). Statistical limitations in functional neuroimaging. I. Non-inferential methods and statistical models. Philos. Trans. R. Soc. Lond. B Biol. Sci., 354(1387), 1239–1260.
Ordinal Trend Canonical Variates Analysis
1645
Pochon, J. B., Levy, R., Fossati, P., Lehericy, S., Poline, J. B., Pillon, B., Le Bihan, D., & Dubois, D. B. (2002). The neural system that bridges reward and cognition in humans: An fMRI study. Proc. Natl. Acad. Sci. USA, 99(8), 5669–5674. Stern, Y., Habeck, C., Moeller, J. R., Scarmeas, N., Anderson, K. E., Hilton, H. J., Flynn, J., Sackeim, H., & van Heertum, R. (In press). Brain networks associated with cognitive reserve in healthy young and old adults. Cereb. Cortex. Sternberg, S. (1966). High-speed scanning in human memory. Science, 153(736), 652– 654. Sternberg, S. (1969). Memory-scanning: Mental processes revealed by reaction-time experiments. Am. Sci., 57(4), 421–457. Ungerleider, L. G., Doyon, J., & Karni, A. (2002). Imaging brain plasticity during motor skill learning. Neurobiol. Learn. Mem., 78(3), 553–564. Venables, W. N., & Ripley, B. D. (1999). Modern statistics with S-Plus (3rd ed.). New York: Springer-Verlag. Worsley, K. J., Poline, J. B., Friston, K. J., & Evans, A. C. (1997). Characterizing the response of PET and fMRI data using multivariate linear models. Neuroimage, 6(4), 305–319. Zarahn, E. (2000). Testing for neural responses during temporal components of trials with BOLD fMRI. Neuroimage, 11(6 Pt. 1), 783–796.
Received October 13, 2003; accepted December 6, 2004.