ISPRS Annals of the Photogrammetry, Remote Sensing and Spatial Information Sciences, Volume II-2/W2, 2015 Joint International Geoinformation Conference 2015, 28–30 October 2015, Kuala Lumpur, Malaysia
A NEW FRAMEWORK FOR GEOSPATIAL SITE SELECTION USING ARTIFICIAL NEURAL NETWORKS AS DECISION RULES: A CASE STUDY ON LANDFILL SITES Sohaib k. m. Abujayyab a, *, Mohd Sanusi s. Ahamad b, Ahmad Shukri Yahyac, Abdul-Malik H. Y. Saad d aSchool
of Civil Engineering, Engineering Campus, Universiti Sains Malaysia, 14300 Nibong Tebal, P. Pinang, Malaysiaa
[email protected], b
[email protected]; c
[email protected]
dSchool
of Electrical & Electronic Engineering, Universiti Sains Malaysia, Nibong Tebal, 14300 Penang,
[email protected]
KEY WORDS: Geospatial site selection, Decision rule, GIS, Artificial neural network, Landfill, suitability map.
ABSTRACT: This paper briefly introduced the theory and framework of geospatial site selection (GSS) and discussed the application and framework of artificial neural networks (ANNs). The related literature on the use of ANNs as decision rules in GSS is scarce from 2000 till 2015. As this study found, ANNs are not only adaptable to dynamic changes but also capable of improving the objectivity of acquisition in GSS, reducing time consumption, and providing high validation. ANNs make for a powerful tool for solving geospatial decisionmaking problems by enabling geospatial decision makers to implement their constraints and imprecise concepts. This tool offers a way to represent and handle uncertainty. Specifically, ANNs are decision rules implemented to enhance conventional GSS frameworks. The main assumption in implementing ANNs in GSS is that the current characteristics of existing sites are indicative of the degree of suitability of new locations with similar characteristics. GSS requires several input criteria that embody specific requirements and the desired site characteristics, which could contribute to geospatial sites. In this study, the proposed framework consists of four stages for implementing ANNs in GSS. A multilayer feed-forward network with a backpropagation algorithm was used to train the networks from prior sites to assess, generalize, and evaluate the outputs on the basis of the inputs for the new sites. Two metrics, namely, confusion matrix and receiver operating characteristic tests, were utilized to achieve high accuracy and validation. Results proved that ANNs provide reasonable and efficient results as an accurate and inexpensive quantitative technique for GSS. 1.
INTRODUCTION
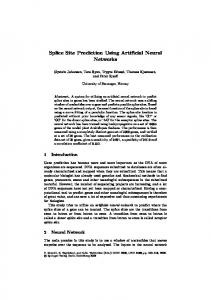
Geospatial site selection (GSS) has attracted increasing attention from experts because of the hazards and problems related to unsuccessful site selection. GSS is a framework that assists decision makers in evaluating available maps for the selection of sites according to their suitability for any specific spatial target Such as; landfills, schools, transportation stations, hazard zones, and new urban areas (Malczewski, 2004). The current framework used for determining suitable sites for any geospatial target is time consuming (Guiqin et al., 2009) and involves multifaceted procedures because of the incorporation of different geospatial data from several disciplines (Gorsevski et al., 2012). In addition, the requirements of current administrative systems and the need to reduce environmental, economic, social, and health costs must simultaneously be addressed (Nazari et al., 2012). Furthermore, the available areas that can be used for evaluation are limited, due to the “not in my back yard” phenomenon, particularly because locating hazardous sites such as landfills near residential areas is undesirable (Vasiljević et al., 2012). The application of GSS must thus consider all related criteria and variables (Ghobadi et al., 2013). GSS is a comprehensive representation of the collective stages of the overall framework for the selection of geospatial sites. In the present study, 75 models among the many existing models are reviewed (Ghobadi et al., 2013, Uyan, 2014, Guiqin et al., 2009, Saeed et al., 2012). The collective stages of these models are identified and subsequently summarized. Regardless of the singular variances among the different frameworks, the authors identify the five general stages of existing frameworks. (Figure
1): (1) criteria input (collection of spatial data, data derivation, and geo-processing), (2) reclassification (normalization of constraint maps and factors as exclusionary criteria), (3) selection of weights by evaluating them according to their attributes, (4) objective balancing, and (5) overlaying all inputs via decision rule algorithms. Aggregation is implemented by multiplying the criteria with their weights and summing up the results for each alternative (pixel in raster data format) to identify the suitability value or index for all areas. In the literature, geographic information system (GIS) has been employ in all of the stages, which involves in determination of the target locations. In the first stage, maps and criteria were prepare via GIS. In the second stage, the candidate criteria or maps are reclassified or normalized to consolidate the dimensions of the values between maps. In this stage, the suitability of the normalization method and its accuracy in comparison with that of the standardization method are ambiguous, possibly because of the limited GIS modeling software or spatial modules. In the third stage, maps should be ranked or weighted. Diverse quantitative and qualitative characteristics, such as ecosystem quality, infrastructure conditions, public acceptance, aesthetic quality, financial cost, and time consumption, affect the weighting operation. For this stage, weight selection techniques such as Delphi, conflicting bifuzzy preference relation, analytic hierarchy process (AHP), fuzzy logic, and expert knowledge (decision makers, experts, interest groups, questionnaires, and stakeholders) are widely used. However, the majority of previous methods are qualitative because its rely on human interference, which is prone to errors and constrains. In particular, humans
* Corresponding author
This contribution has been peer-reviewed. The double-blind peer-review was conducted on the basis of the full paper. doi:10.5194/isprsannals-II-2-W2-131-2015 131
ISPRS Annals of the Photogrammetry, Remote Sensing and Spatial Information Sciences, Volume II-2/W2, 2015 Joint International Geoinformation Conference 2015, 28–30 October 2015, Kuala Lumpur, Malaysia
ineffectively make quantitative estimates, although they can efficiently establish qualitative estimates. Moreover, individuals are susceptible to biased tendencies, such as in cases in which decision makers are required to perform statistical estimation or weighting. Given their dependence on human behavior, qualitative methods require high levels of knowledge and understanding of the nature of spatial data and the areas under assessment. In addition, these methods may lead to irrelevant generalizations, wastage of effort and time, and high costs because of the need to consult experts, which could be inefficient. In the fourth stage, the criteria and objectives must be balanced, the balance operation aims to provide multi scenarios in the output, thus it give more than one option for the decision makers. In addition, it provide flexible evaluation process in case of fast changes in requirements. In the fifth stage, the criteria are aggregate with a decision rule algorithm, which performs a vital function in the overall GSS framework. Decision rules are enable decision makers to evaluate the available alternatives (pixels) for selection on the basis for their suitability (Malczewski, 2004). In this stage, all the data are gathered to produce a suitability scale. Several studies have implemented various decision rules for GSS. Carrying out decision rules for GSS has been limited to rare, popular methods, such as Boolean logic, weighted linear combination (WLC), simple additive weighting, and ordered weighted averaging, all of which represent the concept of multicriteria decision analysis. Resent several studies utilized GIS and WLC technique as a hands-on mechanism for GSS Ghobadi et al., 2013, Uyan, 2014, Guiqin et al., 2009, Saeed et al., 2012), and Ahamad et al., 2011). Demesouka et al., 2013) proposed and developed a spatial decision support system to identify sites, which is proportionate to location appropriateness. Similarly, numerous studies have developed different methods for GSS (Ahamad et al., 2011). However, existing decision rules have certain limitations that lead to uncertainty and inaccurate results. These limitations include vagueness in testing the accuracy and validity of models. (Stage 1) Input criteria
(Stage 2) Reclassific ation
(Stage 3) Selection of weights
x1
f1
w1
x1
f2
w2
x2
f3
w3
x3
x4&c1
x5
c2
x6
c3
(Stage 4) Objective s
(Stage 5) Overlaying
o1 Suitability map o2
quantitatively deal with large number of unknown inputs to determine the significance of each criterion. ANNs perform a substantial role because they can easily and flexibly determine weights by quantity, especially under challenging conditions that involve uncertain and unavailable information on decision progression, ambiguous human recognition and feelings, and inefficient frameworks and qualitative methods. In general, an ANN is a non-linear method established by McCulloch and Pitts (1943). It is extensively used in classification and pattern recognition applications (García-Rodríguez and Malpica, 2010). Thus, the utilization of ANNs has caught the attention of various scholars, particularly because of their functions and capability of dealing with complicated decision-making problems. The goal of ANNs is to establish a network or software through the training and weighting operation. Thus, a network tool may be able to forecast outputs from input data (Lee et al., 2012). ANNs can be incorporated into the GSS process without the need to understand the nature of complex factors (Kia et al., 2012). Therefore, the broadened understanding of GSS models has given rise to the need to improve the tools for information use. Furthermore, ANNs can deal with unfamiliar data, multivariate diminution, non-linear relationships, and complicated interrelationships among criteria (García et al., 2008). ANNs are decision-making rules that can achieve accurate valuation in the classification of oversized samples. An ANN subjectively assigns weights to different conditioning factors with negligible human interference. The weights indicate the relative importance of the factors (Li et al., 2012). ANNs are influential tools that are applicable in classification, prediction, and pattern recognition applications (Kia et al., 2012). ANNs have been applied in several areas, such as in the prediction and classification of variables, because of their advanced computing performance (Tayyebi et al., 2011). Recently, ANNs have been employed to solve compound spatial problems in non-GSS solutions, such as the prediction of dissolved organic carbon, landslide susceptibility mapping (Quan and Lee, 2012) Pavel et al., 2008; Vahidnia et al., 2010, Conforti et al., 2014), mineral mapping, flood simulation (Kia et al., 2012) Rigol Sanchez et al., 2003). Additionally, Simulation of urban growth, karst water flow forecasting (Wu et al., 2008), groundwater prediction (Newcomer et al., 2013), and risk assessment of earth fractures (Wu et al., 2004). Therefore, ANNs can potentially be a new approach to improving the GSS framework, particularly its third and fifth stages (Li et al., 2012, Paraskevas et al., 2014). However, very rare studies has thoroughly investigated ANN for GSS particularly during the period since 2000 until 2015. The present study mainly aims to propose ANNs as new decision rules with a new framework to overcome human interference issues and the limitations of previous frameworks, as well as to improve the accuracy and validity of GSS models by upgrading the GSS framework, especially its third and fifth stages.
Figure 1. General stages of the GSS framework X = criterion, f = factor maps, c = constraint map, o = object
2. THEORETICAL REVIEW OF ARTIFICIAL NEURAL NETWORKS (ANNs)
Previous decision rules (stage 5) and weight selection (stage 3) are valuable in the GSS framework (Uyan, 2014). However, the considerable weaknesses and restrictions of the existing approach could reduce the accuracy of results (. These weaknesses can be solved efficiently and accurately with artificial neural networks (ANNs) (Quan and Lee, 2012, Jiang and Nan, 2006). ANN models first select the weights as the initial step and then implement, aggregate, and compare the results with target data according to certain metrics, such as coefficient of determination (R2), to determine their accuracy. In this way, ANN models
ANNs are mathematical models that mimic human behavior by emulating the operations and connectivity of organic neurons (Song et al., 2010). According to Li et al., 2012), an ANN is a “computerized instrument capable to obtain, represent and calculate maps from multidimensional space of data through specific dataset representing spatial data.” Several types of ANN architecture have been utilized in previous studies, the most popular one being the multilayer feed-forward network. Under such architecture, information is simply moved in a forward direction. Backpropagation is the most common algorithm employed to train the network.
This contribution has been peer-reviewed. The double-blind peer-review was conducted on the basis of the full paper. doi:10.5194/isprsannals-II-2-W2-131-2015 132
ISPRS Annals of the Photogrammetry, Remote Sensing and Spatial Information Sciences, Volume II-2/W2, 2015 Joint International Geoinformation Conference 2015, 28–30 October 2015, Kuala Lumpur, Malaysia
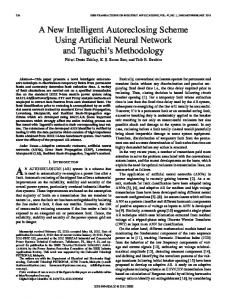
The implementation of ANNs to derive solutions to nongeospatial problems that involve different stages. in the from the literature, 107 articles cover several non-geospatial applications were reviewed, and The most common stages among them were extract, summarize and illustrated in Figure 2 (Conforti et al., 2014, Paraskevas et al., 2014). Regardless of the singular variances among the different frameworks, we explore the general frameworks (Figure 2), which can be divided into the following three stages: (1) data processing, (2) ANN modeling, and (3) evaluation or simulation. Data processing in this case includes specifying the input data, collecting spatial data, geoprocessing, extracting data, establishing the data set for ANNs, implementing standardization or normalization, implementing randomization, and dividing the data set into three sets for training, testing, and validation. ANN modeling includes the design of neural network architecture and parameters, training of the network using the training algorithm, and testing the network to ensure that the required RMS accuracy is met. In case of failure, the analyzer must change the ANN size (number of nodes in the first layer) or reselect the training sets. The final step in ANN modeling is the identification of the best neural network architecture for simulation or evaluation. In the last stage of the framework, the entire dataset is evaluated or simulated. This approach can be modified, upgraded, and developed to improve the suitability of ANN application in GSS.
framework. The proposed framework is focused on constructing a network using quantitative methods while avoiding human interference to reduce financial cost by canceling the expertbased weight selection stage. In this way, high accuracy is achieved in the calibration and validation tests. The proposed framework is present in Figure 4, which illustrates the flow of the new framework, including the four stages, namely, (1) criteria input, (2) data processing, (3) ANN modeling, and (4) evaluation and spatial visualization. The criteria input stage involves input data identification, spatial data collection, geoprocessing, and spatial data derivation. All the tasks at this stage can be performed in the ArcGIS software using different spatial tools for either input or output (target data). The input data comprise various criteria, such as slope, elevation, land use, geology, and soil. The output or target data include the desired existing sites, which could be a point or a polygon. The input and output data must be shaped and converted to raster format. In constructing the raster layer especially for the target data and input criteria, the analyzer must ensure that the cell size of the raster layer clearly represents the small landmarks or ground features, such as schools, landfills, hazard sites, and new urban areas. To achieve an overlaid target, all the data layers must be assigned with the appropriate coordinate systems and with the same cell size and degree (number of columns and rows must be identical between the layers). The TIFF format is also acceptable because of its compatibility with MATLAB. The data processing stage involves the establishment of the data set for the ANN, which is initiated by extracting raster data through a sample point. The sample point needs to be constructed in ArcGIS to represent the input and output data, as well as the target and non-target locations. For the target location, several sample points must be constructed to facilitate the next training stage. Finally, the non-target location can be determined randomly from the areas outside the target location with the same number of desired sample points. The primary table (input data and target data or binary data) is then extracted using the model builder function of ArcGIS and the Extract Multi Values to Points tool to construct the final data set. Figure 3 illustrates the data extraction process for establishing the ANN data set.
Figure 3. Data extraction process Figure 2. General stages of the ANN framework
3.
A NEW ANN FRAMEWORK FOR GSS
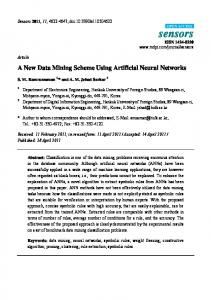
The ANN framework is aimed at constructing a module that is capable of evaluating and generalizing yields from inputs; such objective has yet to be realized (Lee et al., 2012). To construct and implement ANNs in GSS, we propose four comprehensive stages that are developed from the previous GSS and ANN
The primary table can be imported in MATLAB as a vector, including the input and target data, which require initial manipulation and implementation of the normalization process to unify the diminution scale among the input data while avoiding the over saturation of partial neurons (Jiang and Nan, 2006) and decreasing the difference in factorial magnitude (Song et al., 2010). Randomization must also be conducted to normalize the data distribution and feature selection via different statistical methods.
This contribution has been peer-reviewed. The double-blind peer-review was conducted on the basis of the full paper. doi:10.5194/isprsannals-II-2-W2-131-2015 133
ISPRS Annals of the Photogrammetry, Remote Sensing and Spatial Information Sciences, Volume II-2/W2, 2015 Joint International Geoinformation Conference 2015, 28–30 October 2015, Kuala Lumpur, Malaysia
Figure 4. A new framework for implementing ANN in GSS In the ANN modeling stage, the ANN toolbox in MATLAB used for the various tasks, which include dividing the data set into three, namely, the training, testing, and validation sets. ANN modeling also involves the design of the neural network architecture and its parameters (number of nodes or hidden layer size), followed by the training of the network using training algorithms (trainlm, trainbr, trainbfg, traingdm, traingd, etc.). Generally, trainlm is the quickest training function; it is the default function for training inputs in feed-forward networks, but it tends to be inefficient in substantial networks (with a large number of weights), given long computation time and large memory required in spatial networks. In addition, the trainlm function performs better in nonlinear issues than in classification and recognition issues. Meanwhile, the trainrp and trainscg functions are excellent choices for training pattern recognition networks that involve large data sets. The memory requirements of the two functions are generally minimal, and they are considerably faster than standard gradient descent algorithms. After the network training, the network is tested to determine whether it meets the target MSE accuracy. If the goal is not met, the analyzer needs to change the ANN size (number of nodes) or the training algorithm or reselect the training sets. Thereafter, the best neural network architecture for the final simulation is identified. The final stage involves the evaluation or simulation of the entire data set through the new network, the results of which ranges from 0 to 1 in one column. These results must be reshaped to generate the final map. The matrix is then saved as ASCII with consideration of the coordinate systems, number of rows and columns, and cell size. The suitability map is finally presented in the GIS software.
4. CASE STUDY: LANDFILL SITES This section is a practical implementation of section 3, to prove that ANN can be a new approach to improving the GSS framework. 4.1. Study area Perak is a state located northwest of Peninsular Malaysia (lat 4°42'23.589'' N, long 100°57’52.264" E (Figure 5).
Figure 5. Study area (Perak state) The total area of this state is nearly 21,035 km2, as shown in Figure 5. The Perak state area makes up 6.37% of the total area of Malaysia. In 2010, the total population in Perak was 2,258,428. Perak’s climate is sunny and warm. The annual rainfall reaches 3,218 mm, and the relative humidity regularly exceeds 82.3% with a constant
This contribution has been peer-reviewed. The double-blind peer-review was conducted on the basis of the full paper. doi:10.5194/isprsannals-II-2-W2-131-2015 134
ISPRS Annals of the Photogrammetry, Remote Sensing and Spatial Information Sciences, Volume II-2/W2, 2015 Joint International Geoinformation Conference 2015, 28–30 October 2015, Kuala Lumpur, Malaysia
temperature ranging from 23 °C to 33 °C. Nearly half of the state elevations are flat while the other half are sloped, with elevations ranging from 1 to 3,978m. 4.2. Stage 1 (criteria input and data collection) To develop the landfill GSS model, the relevant factors of landfill sites must be determined. These factors were determined according to the literature, including the Japan International Cooperation Agency Guideline 2005, the United Nations Environment Program, and the National Strategic Plan 2005. Thereafter, 32 input factors were identified to represent a variety of thematic layers (e.g., humidity, soil, geology, caves, dams, faults, aspect, slope, evapotranspiration, elevation, NDVI, land use, population, rivers, precipitation, production center, national roads, highways, local roads, schools, theatres, railways, museums, playgrounds, hospitals, natural parks, residential areas, airports, marine borders, coastline, local boundaries, and national boundaries). The data collection was separated into the input and target data. First, the input data were collected from different sources, such as the Malaysian Centre for Geospatial Data Infrastructure (MaCGDI) and the NASA website. Existing resources, such as those on slope and aspects, were also used to retrieve the input data. The data were Georeferenced according to the Malayan Rectified Skew Orthomorphic Projection. Second, the target data were collected and established from diverse sources, such as the MaCGDI. All the data gathered for the existing sites were treated, and the maps of the landfill sites (open and closed sanitation) were built thereafter. The maps were digitized as a polygon and then unified at the border in ArcGIS to develop the binary map (0 and 1, where 0 = non-landfill, 1 = landfill). The developed target map represented the target set for the ANN data set.
Third, all the data sets were randomized for random data distribution, which reduces the effect of regular data distribution and avoids bias in the training stage. All the data sets were randomized via a randomization function (randperm) (Allenmark et al., 2015). 4.4. Stage 3 (ANN modeling) First, the data set was divided into two parts: 70% for training and 30% for validation. The training data set was also divided as follows via the patternnet function: 70% for training, 15% for testing, and 15% for validation. Second, the neural network architecture and its parameters were design. The network created in MATLAB via the (nnstart) GUI patternnet function (neural network pattern recognition toolbox) (Garcia-Breijo et al., 2011). The patternnet network is a specialized version of the multilayer feed-forward neural network architecture. Third, the network was trained using the trainscg function, which is the default function in the patternnet toolbox. The trainscg function is a training network capable of adjusting the values of bias and weight according to the scaled conjugate gradient backpropagation algorithm. The training algorithm start via initializing weights, then summing the inputs multiply weights, then pass it to transfer function to extract the scaled value, then compare the compute resuilt with the actual output via MSE and if the accuracy is not satisfied the goal another iteration perform and so on till reaching to the best accuracy. This process wholly accomplished quantitatively, which in another way mean avoiding human interference and reduce financial cost by canceling the expert-based weight selection stage.
4.3. Stage 2 (ANN data set processing) ANN data set processing is the first step in generating ANNs. Data processing involves three steps. First, data were extracted from the geospatial raster data through a sample point, as required in ArcGIS. Each landfill was represented by a sample point per 30 m in the ground to ensure that the cell size of the raster layer clearly represented the landfill area. A total of 4,082 points representing the landfill locations (1) were observed in the landfill area. In addition, 4,082 points representing nonlandfill locations (0) were determined randomly using Hawth’s tools. In mining the data set, the thematic layer (input data and target data) was added to the ArcGIS model builder function. Afterward, the data set was extracted through the Multi Values to Points toolbox. The primary table of the data set was imported in MATLAB as a vector, including the input and target data. Second, the calculated normalized factors or non-dimensional parameters were scaled as continuous values ranging from 0 to 1 to ensure that all criteria are equally attended during the training stage and before the weighting process. The second stage was implemented through the following formula (Eq. 10):
where
𝑥𝑥𝑛𝑛𝑛𝑛𝑛𝑛𝑛𝑛 =
𝑥𝑥𝑖𝑖 − 𝑥𝑥𝑚𝑚𝑚𝑚𝑚𝑚 (10) 𝑥𝑥𝑚𝑚𝑚𝑚𝑚𝑚 − 𝑥𝑥𝑚𝑚𝑚𝑚𝑚𝑚
𝑥𝑥𝑛𝑛𝑛𝑛𝑛𝑛𝑛𝑛 = 𝑛𝑛𝑛𝑛𝑛𝑛𝑛𝑛𝑛𝑛𝑛𝑛𝑛𝑛𝑛𝑛𝑛𝑛𝑛𝑛 𝑣𝑣𝑣𝑣𝑣𝑣𝑣𝑣𝑣𝑣𝑣𝑣 𝑥𝑥𝑚𝑚𝑚𝑚𝑚𝑚 = 𝑚𝑚𝑚𝑚𝑚𝑚𝑚𝑚𝑚𝑚𝑚𝑚𝑚𝑚 𝑣𝑣𝑣𝑣𝑣𝑣𝑣𝑣𝑣𝑣 𝑜𝑜𝑜𝑜 𝑥𝑥𝑖𝑖 𝑥𝑥𝑚𝑚𝑚𝑚𝑚𝑚 = 𝑚𝑚𝑚𝑚𝑚𝑚𝑚𝑚𝑚𝑚𝑚𝑚𝑚𝑚 𝑣𝑣𝑣𝑣𝑣𝑣𝑣𝑣𝑣𝑣 𝑜𝑜𝑜𝑜 𝑥𝑥𝑖𝑖
Figure 6. Validation of training and testing data sets using the confusion matrix Fourth, we sought to acquire optimal accuracy by performing diverse experiments. The best network according to the evaluation was constructed by modifying
This contribution has been peer-reviewed. The double-blind peer-review was conducted on the basis of the full paper. doi:10.5194/isprsannals-II-2-W2-131-2015 135
ISPRS Annals of the Photogrammetry, Remote Sensing and Spatial Information Sciences, Volume II-2/W2, 2015 Joint International Geoinformation Conference 2015, 28–30 October 2015, Kuala Lumpur, Malaysia
the size of the hidden layers (number of neurons) via trial and error. The final number of neurons adapted by the high accuracy. the optimal set comprised 37 nodes. Finally, the established network for the landfill site was tested through a confusion matrix and receiver operating characteristic (ROC) curves. The accuracy of the analysis was established by comparing the output response and the actual response in the validation sets and training sets. A confusion matrix was computed to define the accuracy of the classification outcome. The overall accuracy was computed through an aggregate number of samples that were classified properly and divided according to the overall number of samples (Figure 6). The properly classified samples could be identified in the vertical and diagonal directions of the confusion matrix. The network outputs were extremely accurate, as indicated by the high number of appropriate reactions in the green squares and the low number of off-base reactions in the red squares. The blue squares in the lower right show the general accuracy. The ANN results showed overall accuracies of 93.3 for the training data set and 92.2 for the testing data set. The ROC curve is another metric to determine evaluation accuracy via the area under receiver operating characteristic (AUC or AUROC) curve (GarcíaRodríguez and Malpica, 2010, Conforti et al., 2014).
Figure 7. Combination of ROC curves for validation of training and testing data sets The AUC metric of discrimination indicates the capability of the ANN to categorize the samples properly and determine whether a site is suitable for landfill use. To determine the fit decision threshold, we illustrated via the ROC curve the performance of the ANN classifier, which defines model accuracy. This threshold metric of segregation between both classes takes values between 0.5 (no separation) and 1 (perfect separation). Hence, the upper left corner in the ROC figure depicts the perfect curve, which indicates the superior accuracy of the metric test and equivalent AUC (1); the area at the 0.5 point denotes inaccuracy. The following scales were employed to determine classifier accuracy: excellent = 0.9–1, good = 0.8–0.9, fair = 0.7–0.8, poor = 0.6–0.7, and fail 0.5–0.6 (Mehdi et al., 2011). Figure 7 shows that the resulting AUC of the ANN for the training data set is 0.979 while that for the testing data set is 0.975. These values reflect the high classification capability of ANNs. 4.5. Stage 4 (evaluation and spatial visualization) Immediately after the training and testing of the ANN model, the model evaluated each sample unit of the entire data set to generate the map of landfill suitability. Thus, the entire input data on Perak were clipped via the Mask tool (study area border) and converted into TIFF in
ArcGIS with a unified cell size of 30 m and an identical degree (number of columns and rows). Thereafter, the entire TIFF image was imported in MATLAB as matrices. Given the vector requirement of MATLAB for ANNs.
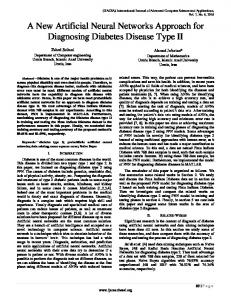
Figure 8. Landfill suitability map The entire input data set was normalized, and given the enormous amount of data for evaluation (42,996,291), the data set was divided to six sections, with each section having 15,000,000 pieces of data. Entire sections of the data sets were fed into the ANN model and evaluated. The resulting suitability value was represented via an index range between 0 and 1 and then saved as a vector with six sections. The sections were combined in one vector column and then reshaped into a matrix to establish the suitability map. The matrix was saved as an ASCII file with consideration of the number of rows, columns, coordinate systems, and cell size. The file was then converted to a GIS raster data file for spatial visualization. The results are shown in a suitability map in Figure 8. The stability index of Perak for landfill sites was divided into 10 groups with varying levels of suitability (best suitability = 1, less suitability = 0). 5.
CONCLUSION
The goal of this paper improve the past GSS through present a new efficient framework via ANNs for GSS issues using GIS tools. The efficient framework particularly present for: first, to be quantitative, overcome human interference issues and the limitations of previous frameworks, as well as to enhance the accuracy and validation. Second, to reduce the financial cost of previous models. A new framework were develop to producing suitability maps in the regional scale using ANN. multilayer feedforward neural network architecture with a Backpropagation learning algorithm were employing. A list of 32 factors utilized as input data set, which was integrate in GIS. Several Geo-processing and manipulation tasks were perform to prepare the final data set for ANN modeling. ANNs are advantageous because of their excellent data manipulation techniques, high tolerance to faults and failures as well as imprecise and fuzzy information, non-
This contribution has been peer-reviewed. The double-blind peer-review was conducted on the basis of the full paper. doi:10.5194/isprsannals-II-2-W2-131-2015 136
ISPRS Annals of the Photogrammetry, Remote Sensing and Spatial Information Sciences, Volume II-2/W2, 2015 Joint International Geoinformation Conference 2015, 28–30 October 2015, Kuala Lumpur, Malaysia
linearity, high parallelism, generalization, robustness, tolerance to noise information, and their capability of dealing with data sets quantitatively and efficiently. However, ANNs are a black box technique, particularly because of the limited understanding on how ANNs learn specific issues and implement rules different circumstances. The developed network was validate via a confusion matrix and ROC curves. Specifically, the existing target data and the evaluation target in the training data set and testing data set were compare. The results of the confusion matrix test showed overall accuracies of 93.3 for the training data set and 92.2 for the testing data set. The ROC curves showed an accuracy of 0.979 for the training data set, and the AUC for the testing data set was 0.975. The completion of the final landfill suitability map indicated that the ANN technique is successful in identifying new and suitable landfill sites. Finally, the results showed excellent reliability, particularly in terms of the use of the ANN technique to produce landfill suitability maps. The result of new framework revealed the applicability and efficiency of ANN modeling for GSS, especially its high modeling accuracy and capability of eliminating human interference with minimal cost. ACKNOWLEDGMENT The authors graciously acknowledge the funding support from the University Sains Malaysia (USM) through the USM Fellowship and University Sains Malaysia (RU Grant 814219). In addition, the authors graciously acknowledge the Ministry of Higher Education for their funding allocation under (FRGS grant 6071258). The authors also acknowledged the Solid Waste Management Cluster under Iconic Grant Scheme No. 1001/CKT/870023, Engineering Campus, Universiti Sains Malaysia. REFERENCES Ahamad, M., et al. 2011. Selection of Sustainable Incineration Site for Penang Island Using GIS Boolean and Fuzzy MCE Approach The Malaysian Surveyor, 46, 38-44. Allenmark, F., et al. 2015. Repetition priming results in sensitivity attenuation. Brain Research. Conforti, M., et al. 2014. Evaluation of prediction capability of the artificial neural networks for mapping landslide susceptibility in the Turbolo River catchment (northern Calabria, Italy). CATENA, 113, 236-250. Demesouka, O. E., et al. 2013. Suitability analysis for siting MSW landfills and its multicriteria spatial decision support system: method, implementation and case study. Waste Manag, 33, 1190-206. Garcia-Breijo, E., et al. 2011. A comparison study of pattern recognition algorithms implemented on a microcontroller for use in an electronic tongue for monitoring drinking waters. Sensors and Actuators A: Physical, 172, 570-582. García-Rodríguez, M., et al. 2010. Assessment of earthquake-triggered landslide susceptibility in El Salvador based on an Artificial Neural Network model. Natural Hazards and Earth System Science, 10, 1307-1315.
García, N., et al. 2008. ANN+GIS: An automated system for property valuation. Neurocomputing, 71, 733-742. Ghobadi, M., et al. 2013. Siting MSW landfills by combining AHP with GIS in Hamedan province, western Iran. Environmental Earth Sciences, 70, 1823-1840. Gorsevski, P. V., et al. 2012. Integrating multi-criteria evaluation techniques with geographic information systems for landfill site selection: a case study using ordered weighted average. Waste Management, 32, 287-296. Guiqin, W., et al. 2009. Landfill site selection using spatial information technologies and AHP: A case study in Beijing, China. Journal of Environmental Management, 90, 2414-2421. Jiang, Y., et al. (2006) Published. Integration of Artificial Neural Network with GIS in Uncertain Model of River Water Quality. Geoscience and Remote Sensing Symposium, 2006. IGARSS 2006. IEEE International Conference on, July 31 2006-Aug. 4 2006 2006 Denver, CO, USA 3386-3389. Kawaguchi, K. (2000). A multithreaded software model for Backpropagation Neural Network applications [Online]. The University Of Texas At El Paso Available: http://wwwold.ece.utep.edu/research/webfuzzy /docs/kk-thesis/kk-thesis-html/node22.html Master Of Science ]. Kia, M., et al. 2012. An artificial neural network model for flood simulation using GIS: Johor River Basin, Malaysia. Environmental Earth Sciences, 67, 251-264. Lee, S., et al. 2012. Spatial Prediction of Ground Subsidence Susceptibility Using an Artificial Neural Network. Environmental management, 49, 347-358. Li, Y., et al. 2012. Rainfall and earthquake-induced landslide susceptibility assessment using GIS and Artificial Neural Network. Natural Hazards and Earth System Science, 12, 2719-2729. Malczewski, J. 2004. GIS-based land-use suitability analysis: a critical overview. Progress in Planning, 62, 3-65. Mehdi, T., et al. 2011. Kernel Smoothing For ROC Curve And Estimation For Thyroid Stimulating Hormone. International Journal of Public Health Research, 239-242. Nazari, A., et al. 2012. Landfill site selection by decisionmaking tools based on fuzzy multi-attribute decision-making method. Environmental Earth Sciences, 65, 1631-1642. Paraskevas, T., et al. 2014. Use of artificial neural network for spatial rainfall analysis. Journal of Earth System Science, 123, 457-465. Quan, H.-C., et al. 2012. GIS-based landslide susceptibility mapping using analytic hierarchy process and artificial neural network in Jeju (Korea). KSCE Journal of Civil Engineering, 16, 1258-1266. Saeed, M. O., et al. 2012. An integrated AHP-GIS technique for landfill siting: A case study in Malaysia. Kuwait J. Sci. Eng, 39, 23-46. Song, S., et al. (2010) Published. Surface water quality forecasting based on ANN and GIS for the Chanzhi Reservoir, China. Information Science
This contribution has been peer-reviewed. The double-blind peer-review was conducted on the basis of the full paper. doi:10.5194/isprsannals-II-2-W2-131-2015 137
ISPRS Annals of the Photogrammetry, Remote Sensing and Spatial Information Sciences, Volume II-2/W2, 2015 Joint International Geoinformation Conference 2015, 28–30 October 2015, Kuala Lumpur, Malaysia
and Engineering (ICISE), 2010 2nd International Conference on, 2010. IEEE, 40944097. Tayyebi, A., et al. 2011. An urban growth boundary model using neural networks, GIS and radial parameterization: An application to Tehran, Iran. Landscape and Urban Planning, 100, 3544. Uyan, M. 2014. MSW landfill site selection by combining AHP with GIS for Konya, Turkey. Environmental Earth Sciences, 71, 1629-1639. Vasiljević, T. Z., et al. 2012. GIS and the analytic hierarchy process for regional landfill site selection in transitional countries: a case study from Serbia. Environmental management, 49, 445-458.
This contribution has been peer-reviewed. The double-blind peer-review was conducted on the basis of the full paper. doi:10.5194/isprsannals-II-2-W2-131-2015 138