1
A new library of surface patches - design and applications
Roi Gamliel1, Klara Kedem1, Rachel Kolodny2, and Chen Keasar1*
1
Computer Science Department, Ben-Gurion University 2
Computer Science Department, Haifa University
Technical report TR 09-10, Computer Science Department, Ben-Gurion University
*
[email protected]
2
Abstract Protein surfaces serve as an interface with the molecular environment and are thus tightly bound to proteins' function. On the surface, geometric and chemical complementarity to other molecules provides interaction specificity for ligand binding, docking of bio-macromolecules, and enzymatic catalysis. As of today, there is no accepted general scheme to represent protein surfaces. Furthermore, most of the research on protein surface focuses on regions of specific interest such as interaction, ligand binding and docking sites. We present here a more general approach for surface representation, as we wish to study the entire surface regardless of its functional roles. In this work we characterize protein surfaces using surface patches, which are small fractions of the surface of proteins. We define a heuristic distance measure between surface patches which is used to cluster the patches from a large set of non redundant proteins. The resulting set of cluster centers (centroids) provides representative surface patch structures and constitutes our surface patch library. To evaluate the biological significance of our method we examined the ability of the library to capture surface characteristics of native protein structures as opposed to those of decoy sets generated by state of the art prediction methods. To this end we compared the compatibility of native proteins and decoys to the library, and attempted to rank protein structure predictions. We found that the patches of the decoys were less compatible with the library than their corresponding native structures. Thus, we were able to use the patches to distinguish native models from models generated by servers. This trend, apparently, does not extend further to the decoys themselves as we failed to reliably rank decoys by their surface patches characteristics. We expect that this high-quality, generic surface patch library will add a new perspective to the description of protein structures and will improve our ability to predict them. Particularly, we expect that it will help improve the prediction of surface features that are apparently rather neglected by current techniques.
3 1. Introduction Protein surfaces serve as interfaces with the molecular environment and are thus tightly bound to proteins' function. On the surfaces, geometric and chemical complementarity to other molecules provides interaction specificity for ligand binding, docking of bio-macromolecules, and enzymatic catalysis. Further, catalysis itself is a surface phenomenon. Thus, surface analysis enables the discovery of functional relationships between proteins that are only distantly related or even unrelated evolutionarily. In their pioneering work Fischer et al. [36] were able to identify the active site residues of subtilisin and sulphydryl proteases by querying a large dataset with the catalytic triad of the (apparently) evolutionary unrelated trypsin. That work was later followed by similar ones that studied more subtle features of functional surface regions. Lin et al. [44] represented molecular surface as a limited number of critical points disposed at key locations over the surface. Using this representation, they were able to achieve accurate protein-protein and protein-small molecule docking. Norel et al. [45] adapted the geometric hashing paradigm, originally developed in the context of computer vision, for the docking problem, and by using an indexing approach based on a transformation invariant representation, they scanned groups of surface dots (or atoms) and detected optimally matched surfaces. Pickering at al. [15] matched functional features on protein surfaces thus showing functional relationships (NAD binding) between proteins where sequence alignment and fold comparison failed. Wolfson et al. [32] and Zhou et al. [43] found that shared patterns on protein surfaces reveal similarities between RNA dinucleotide binding sites of proteins with different overall sequences, folds and functions. Finally, Binkowski & Joachimiak [37] were able to identify Hem binding pockets in a variety of evolutionary unrelated proteins. A major characteristic of all these studies is that they took a supervised approach. They first identified and learnt a functional region within a dataset of proteins and then used the acquired knowledge to annotate other, evolutionary unrelated proteins. A prerequisite for the study of protein surfaces is a method for their identification and representation. Much work has been devoted to this issue over the years and several approaches have been suggested to address it. We will explore some of the developments in this area, but for a complete review of the subject we refer the reader to Via et al. [14]. The first to define the solvent accessible surfaces of proteins were Lee and Richards [25] in 1971. They developed a method to identify surface atoms and to differentiate them
4 from buried ones. The union of the surface atoms defined the accessible surface. In 1983 Connolly [27] introduced the first exact analytical method for computing the accessible surface area that smooth out the molecular surface by eliminating narrow cavities that cannot be reached by a spherical probe (typically having 1.4Ǻ radius, like a water molecule). Over the years this method has been improved, especially in terms of efficiency [34][35] and as for today it is the most widely used approach. New developments in computational geometry, in the field of alpha shape theory by Liang and Edelsbrunner [33], provide an accurate method to describe the topological structure of a molecule and to efficiently compute the solvent accessible surface. The complexity of these fine grained representations of the protein surface calls for coarse graining by some kind of abstraction of the intuitive concept of surface patches. In their pioneering work Jones and Thornton [5][6] used surface patches to identify potential sites for protein-protein interactions. They defined surface patches as overlapping, roughly circular, sets of proximate surface residues (the size of which depends on the type of the target interaction), and compared binding site patches with non-binding ones. The unique binding site features were used to derive an interaction propensity score for each patch, which was later implemented in a web based bioinformatics tool to predict potential protein-protein interaction sites [7]. A decade later Baldacci et al. [2][3][4] used a very different approach to surface patches to tackle a very different task, that of identifying structural similarity and plausible evolutionary connection between proteins. Their method aims to represent protein surfaces as graphs and thus, make them amenable for study using graph theoretic algorithms. To this end they determined, for each protein, a collection of variable size, non-overlapping surface patches, each of which included a set of homogenous and connected surface points. The patches were then classified to one of 12 predetermined types. Patches that were not compatible with any of these types ("gray" patches) were ignored. This strict reduction in complexity allowed the authors to represent protein surfaces by graphs whose nodes are patches and the edges are labeled with inter-patch distances. They found frequent sub-graphs of patterns of patches through data mining techniques and used these sub-graphs to classify the proteins. While very different, both applications are tightly tailored towards their specific aims and it is hard to see how they can be used in a different context.
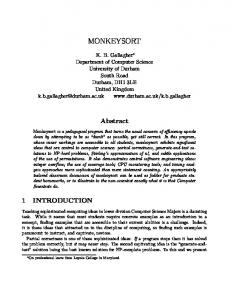
5 The high dependence of the above realizations of surface patches on the context in which they are applied is in sharp contrast to another common implementation of protein structure concept, namely fragments (i.e., continuous structural stretches along the protein chain). Since the introduction of fragments some twenty years ago by Jones et al. [8] they were used for a wide range of applications and had a profound impact on protein structural biology. The original work of Jones et al. [8] used the fragments for the interpretation of electron density maps. Later they were used to study sequence structure relationships by Unger et al. [9], Han & Baker [38] and Kolodny et al. [1]. Moreover, they were used for sequence alignment by Ye et al. [39], protein structure prediction by Levitt et al. [41], protein structure comparison and classification by Koehl et al. [42,] and for large scale mapping of the whole fold space of proteins by Friedberg and Godzik [40]. The cornerstone of all these studies is the use of clustering techniques to extract a limited number of representatives from the vast dataset of known protein fragments. The major motivation of our study is our belief that a similar approach may also benefit the study of protein surfaces and that a wide variety of applications may arise from a generic representation of surface patches. Accordingly, the current study presents a new approach to the identification of surface patches in proteins. We aim to study protein surfaces in an unsupervised way by building an unbiased library of representative surface patches. To obtain such a library we find for each β-carbon (pivot), which lays on the protein surface, a group of surface atoms that surround it within a certain radius. Thus, each pivot defines a surface patch (Figure 1.a) and neighboring patches may overlap. We developed a heuristic distance measure between surface patches and used it to cluster a large number of patches extracted from a non-redundant dataset of protein structures (Figure 1.b). Each cluster consists of similar patches and is represented by its centroid which is the patch that minimizes the intra-cluster distance. These centroids serve as representative surface patch structures (Figure 1.c) and constitute our surface patch library. To evaluate the biological significance of our method we examined the ability of the library to capture surface characteristics of native protein structures as opposed to those of decoy sets generated by state of the art prediction methods. To this end we examined the fit of native proteins and decoys to the library, tried to rank protein structure predictions of five leading servers taken from CASP8, and analyzed the composition of two patches in an exemplary cluster.
6 The rest of the paper is structured as follows. In Section 2 we define surface patches, the clustering framework used, data sets and the distance function. Section 3 reports the tests we carried out and their significance. Finally, in Section 4 we discuss the significance of these results and suggest future studies.
Patch Identification
●
●
●
●
●
15058 surface patches
(a)
Clustering
●
K Clusters
(b)
Finding the Centroids
●
●
●
K Centroids
(c)
Figure 1: An overview of the construction of the surface patch library. (a) – The surface patches extracted from the data set, the atoms are shown as small spheres in the patch. (b) – Grouping the patches into k clusters. The atoms of the patches in each cluster are superimposed on the cenroid. For clarity, we omitted the surfaces. (c) – The cluster centroids constitute the surface patch library.
7 2. Methods 2.1 Parameter assignment The methods outlined below require the assignment of quite a few free parameters that affect the results, sometimes in a rather unpredictable way (Table 4). Unfortunately, no rigorous theory exists regarding the choice of these parameters and an exhaustive search over all parameters space in unfeasible. Instead we had to do with a sparse local sampling of a single parameter at a time. In order to keep this document concise we have chosen not to elaborate on this parameter sampling process. Instead, the tested values as well as the current ones, which were used to produce the reported results, are summarized in Table 4 and we refer to this table whenever one of these parameters is mentioned. It should be stressed though that in all the experiments, with all parameter values tested we got qualitatively similar results and specifically statistically significant result. 2.2 Data Sets Our training set (Table 5), which is identical to the one used by Kolodny et al. [1], includes 200 unique and high quality domains from SCOP version 1.57 [19]. Specifically, each of these domains had the highest ranking SPACI scores [20] in its SCOP category, where the SPACI score is a measure of the reliability and precision of a crystallographically-determined structure in a PDB file. The structures were retrieved from the Protein Data Bank (PDB) [18]. The test set (Table 6) includes CASP8 single domain targets whose structures were solved by crystallography, and their respective models generated by the 5 best CASP8 servers (a total of 6 structures per target). Moreover, in the case of two servers (Baker and Zhang) we examined all the five models that they submitted for each of the above mentioned targets (additional 4*2 models per target). In order to ensure the independence of the training set and the test set we ran BLAST [48] search of the CASP8 targets against the training set. Targets with either an E-value below 0.0001 or more than 30% identity with any of the training set proteins were removed. After the removal of training set homologs the test set included 66 proteins.
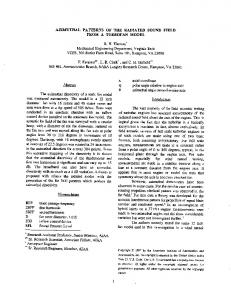
8 2.3 Surface identification The accessible surface area of each atom (measured in Å2) was computed using PROGEOM [12]. For the binary distinction between surface and buried atoms we introduced a threshold of surface area value for each atom type (e.g., alanine-Cα or lysine-Nζ). This threshold is based on the cumulative distribution of accessible surface area over all atoms of a specific type (Figure 2). We defined surf to be the area corresponding to the 99th percentile of the distribution and considered it the surface of a fully exposed atom. The highest values obtained were very noisy and we suspected that they may correspond to errors in the structures (e.g. missing side-chains that superficially expose backbone atoms). The threshold was defined as a fraction, surf*(1-α), of this value. The larger α, the less atoms are considered to be on the surface. Using small α values added atoms in cavities to the surface. Using a high α value resulted in a very scattered coverage of the surface. This work uses α=10% (Table 4).
Cumulative Percentage of Surface Area
CC
Value of surf for the Cysteinecarbonyl carbon is approximately 6Å2
Atom Surface Area (Å2) Figure 2: The estimation of surf - the maximal surface area of atoms of a given type. The cumulative surface area distribution of all the cysteine-carbonyl carbon atoms in the training set is plotted. We set surf to be the area in the 99th percentile of the
9 2.4 Patch definition A patch is defined by a central surface β-carbon, which we call pivot, and a radius R (see table 4). It includes the surface atoms that are at distance not greater than RÅ from the pivot. Under this definition neighboring patches on the protein surface typically overlap (Figure 3). The reasoning behind this somewhat arbitrary definition is that most β-carbons of surface residues are exposed, thus allowing a packed and uniform coverage of the surface. A different selection, such as αcarbon would have resulted in a scattered coverage of the surface, as the α-carbons are frequently buried. The patch radius R determines the patch’s size, area of coverage and number of atoms. This work uses R=7Å. Future work may incorporate several libraries, where each library is assembled for a different radius.
(a) Patch sphere
(b)
(c) Red spheres represent pivots
β-carbon pivot
Figure 3: Surface patch definition (PDB code 12as [58]) as an example. Atoms are rendered by their surface exposure (red = exposed, blue = buried). (a) A patch is defined by a central surface β-carbon and a sphere around it (green). (b) The surface of a single patch. (c) Neighboring patches on the protein surface typically overlap (red spheres represent pivots).
10 2.5 Definition of distance between patches Given two patches A and B such that A = {a1,…,an} and B = {b1,…,bm}, m ≤ n, we look for their optimal superposition both in terms of structure and of chemical properties. The distance value is the minimal root mean square deviation (RMSD) between the patches under a set of chemical constraints. If the compositions (see below) of the patches are too remote to allow meaningful superposition the distance is taken to be infinity. Formally: 1. Let T = {T1,…,TNtypes} be the set of atom types. 2. Let t: {set of all atoms} → T be a mapping so that for an atom a, t(a) is the atom's type. 3. Let A = {a1,…,an} and B = {b1,…,bm} be two sets of atoms to be superimposed. 4. Let the composition of patch A be TA = {T1A,…,TNtypesA} the vector of integers such that
∑T
iA
=n
and, for each i, TiA is the number of atoms of type Ti in set A. 5. The composition of patch B is similarly defined. 6. A and B are compatible if n − m < Φ 1 or if ∃i TiA − TiB < Φ 2 or if rg ( A) − rg ( B) < Φ 3 where rg(A) and rg(B) are the radii of gyration of sets A and B respectively and Φ1, Φ2, and Φ3 are threshold values for size difference, chemical difference, and radius of gyration difference, respectively. 7. Let F = {f1,…, fk} be the set of all proper mappings of A and B. A mapping is a bipartite graph whose disjoint sets are A and B. A proper mapping f satisfies f(a) = b iff f(b) = a and t(a) = t(b), i.e. a pairing is made between atoms of the same type. 8. Then, the distance between A and B is:
min D ( A, B ) = ∞
f ∈F
RMS ( A , B , f ) if A and B are compatible otherwise
Where RMS(A,B,f) is the optimal superposition of the atoms of A and B that are mapped by f. In practice, finding the optimal mapping is a hard combinatorial optimization problem, although the requirement for compatibility provides a filter that reduces the number of these calculations considerably. Thus, the use of the exact distance definition above might have rendered the calculation of numerous distances infeasible. Instead, we use a heuristic approximation that reduces the number of tested mappings.
11 To this end we define the inner sphere of a patch to be a sphere of radius r (see Table 4), r < R, centered at the pivot β-carbon (Figure 4.a). We then exhaustively enumerate all possible chemically valid mappings between the inner sphere of one patch and the inner sphere of the other patch (Figure 4.b). The RMSD is measured after optimal least-squares superposition [21]. If the RMSD between the inner spheres is below a given threshold, it serves as a seed to match the full patches A and B. If no seed was found, the distance between the patches is taken to be infinity. Otherwise, the transformation coupled with each RMSD that passed the threshold is applied to the full patches and each atom of A is matched according to proximity and chemical attributes to the best fitting atom in B. Now we have a matching between A and B for each seed. For each such matching we compute the RMSD between A and B and pick the matching that yields the lowest RMSD. This approximation is sensitive to the radius of the inner sphere. When the inner sphere has many atoms the runtime is very high. When, on the other hand, the inner sphere is almost empty we do not have enough points to compute the RMSD. Thus, we start each calculation with r=4Å and if the number of atoms within the sphere gets below 4 or exceeds 9 we resize the radius of the inner sphere by one Ångström.
12 (a)
(b)
(c)
Inner spheres possible matches
Patch A
Induced transformations
Inner sphere RMSD