Dec 10, 2017 - Tail-Means (ATM), which offers effective and robust optimization ..... (which employs these robust statistics) can in turn provide robust ...
Analysis-of-marginal-Tail-Means – a new method for robust parameter optimization arXiv:1712.03589v1 [stat.ME] 10 Dec 2017
Simon Mak∗ ‡ , C. F. Jeff Wu∗†‡ December 12, 2017
Abstract This paper presents a novel method, called Analysis-of-marginal-Tail-Means (ATM), for parameter optimization over a large, discrete design space. The key advantage of ATM is that it offers effective and robust optimization performance for both smooth and rugged response surfaces, using only a small number of function evaluations. This method can therefore tackle a wide range of engineering problems, particularly in applications where the performance metric to optimize is “black-box” and expensive to evaluate. The ATM framework unifies two parameter optimization methods in the literature: the Analysis-of-marginal-Means (AM) approach (Taguchi, 1986), and the Pick-the-Winner (PW) approach (Wu et al., 1990). In this paper, we show that by providing a continuum between AM and PW via the novel idea of marginal tail means, the proposed method offers a balance between three fundamental trade-offs. By adaptively tuning these trade-offs, ATM can then provide excellent optimization performance over a broad class of response surfaces using limited data. We illustrate the effectiveness of ATM using several numerical examples, and demonstrate how such a method can be used to solve two real-world engineering design problems.
Keywords: Analysis-of-marginal-Means, orthogonal arrays, Pick-the-Winner, response surface methodology, robust optimization, tail means.
∗
School of Industrial and Systems Engineering, Georgia Institute of Technology Corresponding author ‡ This work is supported by the U. S. Army Research Office under grant number W911NF-17-1-0007. †
1
1
Introduction
A key goal in engineering design is to find parameter settings which optimize some performance metric f over a large, discrete design space. Here, f can measure the quality of a final product, the productivity of a process, or the robustness of a system in the presence of noise factors. There are two challenges implicit in such a parameter optimization problem. First, the response surface of f over input parameters is typically “black-box”, in that an experimenter has little-to-no prior knowledge on the functional form or properties of f . Second, each evaluation of f is computationally or monetarily expensive, so only a limited number of function observations can be used for solving the desired parameter optimization problem. To this end, we propose in this paper a new method called Analysis-of-marginalTail-Means (ATM), which offers effective and robust optimization performance for both smooth and rugged response surfaces, using a limited number of function evaluations. The proposed method ATM, as well as its sequential implementation sel.atm, has important applications to a wide range of real-world engineering problems. One such application is to physical engineering problems, where the goal is to find control settings which jointly maximize product quality and enjoy robustness to noise factors (see Taguchi, 1986; Wu and Hamada, 2009 for details). For example, in designing an electric circuit, an engineer may be interested in finding an optimal configuration of capacitors and resistors, which (a) maximizes the power of such a circuit, and (b) minimizes its performance variability in the presence of uncontrollable environmental noise. This parameter design problem is equally important in the more recent field of computer experiments (Santner et al., 2013), which replaces physical experiments with deterministic simulations performed using computer code. There, the goal is to find an input setting x for which the computer simulation output optimizes some performance metric of interest. Our method also finds important applications in the area of combinatorial chemistry in the pharmaceutical industry (Mandal et al., 2006), where the aim is to design a molecular compound (from potentially millions of candidate compounds) which is most effective at treating a particular disease. All of these applications encounter the same two challenges mentioned earlier: the metric
2
of interest f is typically black-box, and each function evaluation can be quite expensive to generate. The proposed method offers a novel approach for jointly tackling these two challenges, and can provide more effective and robust optimization performance over existing techniques for the above applications. Over the years, there has been notable work in the literature on tackling this parameter optimization problem. One early technique, popularized by Taguchi (1986), is the Analysisof-marginal-Means (AM) method. The key idea in AM is to use, for each factor, its estimated marginal means to determine the optimal level setting for such a factor. Wu et al. (1990) pointed out several deficiencies with the AM method, and instead advocated for an alternate method called Pick-the-Winner (PW). In contrast with AM, which employs marginal means for optimization, the PW approach simply chooses from the observed parameter settings the one yielding the best performance (i.e., the “winner”). In the same paper, Wu et al. (1990) introduced an iterative optimization algorithm called Sequential-Eliminationof-Levels (SEL), which sequentially removes the worst-performing level from each factor using either the marginal mean or marginal minimum statistic. This SEL framework was further developed by Mandal et al. (2006) and Mandal et al. (2009), who employed genetic algorithms and Gaussian process modeling to guide this elimination procedure. While most of the subsequent literature following Wu et al. (1990) has been on improving the sequential elimination procedure, there has been little work on perhaps a more fundamental statistical problem: the prediction of the optimal parameter setting from limited function evaluations. Such a problem was briefly discussed in Section 3 of a technical report by Wu et al. (1987) when comparing the AM and PW methods, but to our knowledge, no paper has studied this topic further. In this paper, we show that AM and PW each perform well under certain conditions, but can yield poor results if such conditions are violated. This is quite troubling from a practitioner’s perspective, because one typically does not know a priori whether such conditions are satisfied for a black-box function. To this end, we introduce the proposed ATM method as a way to bridge the gap between AM and PW, and show that such an approach offers three fundamental trade-offs in optimization, concerning response surface smoothness, estimation accuracy of marginal statistics, and the dichotomy 3
between model-based and rank-based optimization. By using observed function evaluations to adaptive tune these trade-offs, ATM offers a more robust method for optimizing a broader class of response surfaces. We then introduce a sequential optimization procedure called sel.atm, which employs the ATM to sequentially eliminate sub-optimal factor levels. Using several simulations and real-world problems, we show that sel.atm provides more effective and robust optimization performance over existing parameter optimization methods. This paper is organized as follows. Section 2 outlines the parameter optimization problem and the use of marginal statistics for prediction. Section 3 introduces the novel ATM method, and highlights three fundamental trade-offs which contribute to its effectiveness in optimization. Section 4 presents the sequential procedure sel.atm, along with two computational tools for tuning and de-biasing marginal estimates. Sections 5 and 6 investigate the performance of ATM and sel.atm in several numerical simulations and real-world engineering problems. Section 7 concludes with several directions for future research.
2
Problem set-up and motivation
We first provide a brief overview of the parameter optimization problem at hand, then present a general framework for predicting the optimal setting via marginal statistics.
2.1
The parameter optimization problem
Suppose there are p parameter variables of interest, with the l-th variable (or factor) having Nl discrete levels, l = 1, · · · , p. We denote these levels as [Nl ] ≡ {1, · · · , Nl } throughout the paper. Let X = [N1 ] × [N2 ] × · · · × [Np ] be the full factorial space consisting of all feasible level combinations for parameters, and let f : X → R be the performance metric to be minimized. The parameter optimization problem can then be formulated as: x∗ ≡ Argmin f (x). x∈X
4
(1)
Here, x = (x1 , · · · , xp ) is a feasible parameter setting in X , and the goal is to find the optimal parameter setting x∗ which minimizes the performance metric f . There are two key challenges to solving the parameter optimization problem (1). First, the response surface f is typically a black-box function, in that an experimenter has littleto-no prior knowledge on either the functional form of f or its properties. In such situations, one must rely on evaluations from f to learn important features of the underlying response surface. A good parameter optimization algorithm should therefore adaptively incorporate sample information from f in estimating the optimal setting x∗ . Second, each evaluation of f can be computationally or monetarily expensive. One example is the computer experiment application in the Introduction: the evaluation of f at a single parameter setting x requires solving a system of complex partial differential equations, which can take days or weeks to compute (see, e.g., Mak et al., 2017)! Viewed this way, a good algorithm should provide excellent optimization performance using a small design of evaluated inputs Dn ⊆ X (with n ≡ #{Dn } � #{X }), so that a good parameter setting can be attained in practical time. Our goal in this paper is to tackle both challenges simultaneously – we will propose an effective method which yields robust optimization performance for both smooth and rugged choices of f , using a limited number of function evaluations.
2.2
Optimization using marginal statistics
We introduce next a general optimization framework using marginal statistics, which includes the existing AM and PW methods as special cases. For a factor l at level xl ∈ [Nl ], let Fl (xl ) ≡ {f (x−l ; xl ) : x−l ∈ X−l } be a function slice of f over the remaining l − 1 factors in X−l (the factorial space without factor l). Define the marginal statistic Ml which maps the function slice Fl (xl ) to a marginal characteristic of interest, and let: ml (xl ) ≡ Ml {Fl (xl )}
(2)
be the resulting marginal quantity for the xl -th level of the l-th factor. For example, the marginal mean statistic Mmean :
5
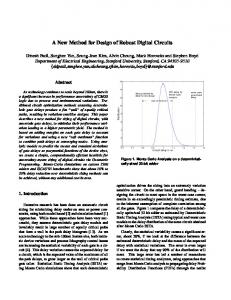
Figure 1: A visualization of the proposed optimization framework using marginal statistics.
ml (xl ) = Mmean {Fl (xl )} =
X 1 y #{Fl (xl )}
(3)
y∈Fl (xl )
returns the average of all function values in the xl -th level of the l-th factor. Likewise, the marginal minimum statistic Mmin : ml (xl ) = Mmin {Fl (xl )} = min{y : y ∈ Fl (xl )}
(4)
returns the smallest function value in the xl -th level of the l-th factor. Of course, not all function values in the full slice Fl (xl ) are observed as data, so in practice these marginal quantities are estimated by its sample analogues: m ˆ l (xl ) ≡ Ml {Fˆl (xl )},
(5)
where Fˆl (xl ) ≡ {f (x−l ; xl ) : x ∈ Dn } is the observed function slice from design Dn . The left part of Figure 1 visualizes the observed function slices Fˆl (xl ) and estimated marginal statistics m ˆ l (xl ) for a simple example with p = 2 factors, each having N1 = N2 = 5 levels. Here, the black grid corresponds to the feasible parameter settings in X , and the 6
red dots correspond to the evaluated settings for f . For a fixed choice of marginal statistic Ml , say the marginal mean in (3), the blue values along each column show the estimated marginal means m ˆ 1 (xl ) for each level xl ∈ [5] of the first factor. For example (see Figure 1), the estimated marginal mean for the first factor at level 5, m ˆ 1 (5), is computed by taking the mean of the observed slice Fˆ1 (5), which consists of two observed values in the fifth column. This provides an estimate of the true marginal mean m1 (5) – the mean of all five function values in the fifth column. Similarly, the green values along each row show the estimated marginal means m ˆ 2 (xl ) for each level xl ∈ [5] of the second factor. For example, the estimated marginal mean for the second factor at level 3, m ˆ 2 (3), is computed by taking the mean of Fˆ2 (3), which consists of two observations in the third row. Of course, one can similarly interpret this figure using a different choice of marginal statistic Ml , such as the marginal minimum in (4) or the novel marginal tail mean introduced later. With this in hand, we then use the estimated marginal quantities {m ˆ l (xl ) : xl ∈ [Nl ]} to predict x∗l , the optimal level of factor l in the parameter optimization problem (1). Since we are interested in minimizing f , it makes sense to select the level with the smallest marginal statistic, i.e.: xˆl ≡ Argmin m ˆ l (xl ),
(6)
xl ∈[Nl ]
as a predictor for the optimal level x∗l . The level combination: ˆ = (ˆ x x1 , · · · , xˆp ),
(7)
which consists of the level predictors for all p factors, therefore provides a reasonable predictor for the optimal setting x∗ . The right part of Figure 1 illustrates this marginal prediction procedure using the earlier p = 2 example. Suppose again that Ml is the marginal mean statistic in (3). Of the marginal mean estimates for factor 1 (in blue), the xˆl = 5-th level yields the smallest estimate; likewise, of the marginal mean estimates for factor 2 (in green), the xˆl = 3-rd level yields the smallest estimate. Using the marginal predictor in (6), ˆ = (5, 3). the resulting prediction of the optimal setting x∗ is x There are two important advantages in using this marginal optimization approach. First, 7
n = 25 AM PW
2.13 5.33
Friedman n = 50 n = 75 1.95 4.21
1.87 4.14
n = #{X } 1.81 1.81
DetPep10 n = 25 n = 50 n = #{X } 11.45 11.22
11.42 10.98
11.41 10.83
Table 1: The predicted minimum f (ˆ x) (averaged over 100 randomly-permutated OAs of run size n) using AM and PW, for the Friedman and DetPep10 functions. Bolded values indicate the better method between AM and PW.
even when data is expensive to collect, one can still reliably estimate certain marginal quantities (e.g., means) for a response surface, particularly if a design with good projective properties (e.g., the maximum projection design in Joseph et al., 2015, or its variants in Mak and Joseph, 2017) is used. With these reliable estimates in hand, it makes sense to use such quantities for guiding the optimization procedure. To ensure that each level of each factor receives the same number of function evaluations, we will use orthogonal arrays (OAs; Wu and Hamada, 2009) as the design of choice for Dn . Second, the use of one-dimensional marginal statistics for Ml yields a simple and uniquely-defined predictor in (7) for the optimal setting. To contrast, the ranking of two or three-dimensional marginal statistics may not yield such a simple form for prediction, and also cannot be reliably estimated from limited data. The challenge is then to choose a good 1-d marginal statistic Ml for each factor l, so that (a) Ml can be well-estimated using limited function evaluations, and (b) ˆ provides an effective and robust estimate of x∗ for a broad class of the resulting predictor x response surfaces.
2.3
Analysis-of-marginal-Means (AM) and Pick-the-Winner (PW)
The above marginal optimization framework includes the Analysis-of-marginal-Means method (Taguchi, 1986) and the Pick-the-Winner method (Wu et al., 1990) as special instances. To see this, set the marginal statistic Ml as the marginal mean Mmean in (3) ˆ then selects, for each factor, the for all factors l = 1, · · · , p. The marginal predictor x level which minimizes the estimated marginal means. This is precisely the AM method 8
popularized by Taguchi (1986), which employs marginal mean estimates to choose the optimal level setting for each factor. Likewise, setting Ml as the marginal minimum Mmin ˆ selects, for each factor, the level with the smallest observed in (4), the marginal predictor x function value. However, because the smallest observed value over all levels is the smallest ˆ picks the setting corresponding to the smallest observed observed value in the design, x function evaluation. This then reduces to the PW method advocated by Wu et al. (1990). Both AM and PW have their strengths and deficiencies; one can fail miserably in certain situations, while the other can perform poorly in other situations. We illustrate this using the following two test functions: the 5-d Friedman function (Friedman et al., 1983): f (x) = 10 sin(πx1 x2 ) + 20(x3 − 0.5)2 + 10x4 + 5x5 ,
x ∈ [0, 1]5 ,
(8)
which is composed of several 1-d additive terms and an interaction term, and the curved 3-d DetPep10 function: √ f (x) = 4(x1 − 2 + 8x2 − 8x22 )2 + (3 − 4x2 )2 + 16 x3 + 1(2x3 − 1)2 ,
x ∈ [0, 1]3 ,
(9)
taken from the original 8-d function in Dette and Pepelyshev (2010). For both functions, Nl = 5 levels are used for each factor, with levels set at the middle of equi-spaced intervals on [0, 1]. Table 1 shows the predicted minimum f (ˆ x) using AM and PW (averaged over 100 replications), with the underlying designs Dn set as orthogonal arrays with randomized level permutations. For the Friedman function, AM provides considerably improved minimization performance to PW when the number of function evaluations n is small. When n = #{X } (i.e., all settings are observed in X ), both methods arrive at the global minimum of 1.81. Conversely, for the DetPep10 function, PW offers noticeable improvements to AM for all sample sizes n; indeed, even when all settings are observed in X , AM returns a solution which is far away from the global minimum of 10.83! These two examples nicely motivate the need for a more robust optimization method – one which incorporates the advantages of both AM and PW to effectively minimize a
9
broad class of response surfaces, including the Friedman and DetPep10 functions. This robustness is crucial in practical applications, because a practictioner typically has little prior knowledge on a response surface, and would prefer a method which performs well in all situations. To this end, we present next a novel method which bridges the gap between AM and PW to achieve this desired robustness in optimization.
3
Analysis-of-marginal-Tail-Means (ATM)
We now present the proposed optimization method, called Analysis-of-marginal-Tail-Means, which employs the so-called conditional tail means as the marginal statistic of choice for Ml . We first provide a brief overview of conditional tail means, then present several inherent trade-offs which justify why such a choice of marginal statistic offers more robust optimization performance than both AM and PW.
3.1
Conditional tail means as marginal statistics
The idea of conditional tail means was first popularized in the risk management literature, and is widely used as a measure of risk for potential financial losses. For a scalar random factor X ∼ F with finite mean, the conditional tail mean of X at percentile α ∈ [0, 1] is typically defined as E{X|X > Qα (F )}, the expected value of X given it exceeds its α-th quantile Qα (F ) (Hardy, 2006). When X represents an uncertain financial loss to be incurred, the conditional tail mean of X can be interpreted as the expected incurred loss in the worst-case 100(1 − α)% event – the event that this loss falls within the upper 100(1 − α)% of its distribution. These conditional tail means have been used extensively for risk analysis in a variety of fields, including the valuation of life insurance portfolios (Hardy, 2006), the pricing of financial options (Barone Adesi, 2016), and as a standard for regulatory capital measurement (Baker and Filbeck, 2014). For brevity, we refer to conditional tail means as simply “tail means” from here on. We employ a modified version of these tail means as marginal statistics within the optimization framework in Section 2.2. Again, let Fˆl (xl ) = {f (x−l ; xl ) : x ∈ Dn } be the 10
observed function slice at level xl of factor l, with m = #{Fˆl (xl )} the number of samples in this function slice, and y(1) , · · · , y(m) the sorted observations (from smallest to largest). (Note that each level of each factor receives an equal sample size m, because an orthogonal array is used for Dn .) Suppose each factor l is assigned a percentile αl ∈ [0, 1], l = 1, · · · , p. The marginal tail mean for factor l at level xl is then defined as:
m ˆ αl (xl ) ≡ Mtail,αl {Fˆl (xl )} =
1 dmαl e
Pdmαl e r=1
y(1) ,
y(r) , αl ∈ (0, 1],
(10)
αl = 0,
where d·e is the ceiling function. In other words, m ˆ αl (xl ) = Mtail,αl {Fˆl (xl )} returns the mean of the function values in Fˆl (xl ), conditional on such values being on or below the αl -th quantile of Fˆl (xl ). This is slightly different from the earlier financial definition of tail means; here, the interest lies in the lower tail of the distribution. With this in hand, define now the marginal predictor using tail means: ˆ α ≡ (ˆ x x1 , · · · , xˆp ),
xˆl = Argmin m ˆ αl (xl ),
α = (α1 , · · · , αp ),
(11)
xl ∈[Nl ]
which is precisely the marginal predictor in (7) with tail means as the marginal statistic ˆ α is that it offers a of choice. One nice property of the marginal tail mean predictor x continuum of predictors for the optimal setting x∗ , with AM on one end of the spectrum and PW on the other. To see this, suppose the percentiles αl are all set at 1, in which case dmαl e = m for all l = 1, · · · , p. The tail mean in (10) then reduces to the (unconditional) ˆ α becomes the AM predictor. mean for all factors, meaning the marginal tail mean predictor x Likewise, suppose αl equals 0, in which case the tail mean in (10) reduces to the minimum ˆ α then matches that statistic. Following Section 2.2, the marginal tail mean predictor x for PW. Choosing the percentile αl ∈ (0, 1) therefore yields a trade-off between the AM and PW methods. Indeed, the marginal tail mean in (10) can be viewed more generally as an L-estimator (Huber, 2011) – a linear combination of order statistics, which have been extensively used as robust statistics. In this sense, we demonstrate how the predictor in (11)
11
Figure 2: Three fundamental trade-offs between the AM and PW methods.
(which employs these robust statistics) can in turn provide robust optimization performance. It is still unclear what specific properties are being traded off between AM and PW. To this end, we present below three fundamental trade-offs concerning response surface smoothness, the estimation accuracy of marginal quantities, and the dichotomy of modelbased vs. rank-based optimization (see Figure 2 for a visualization), and show how the proposed tail means in ATM nicely parameterize such trade-offs.
3.2 3.2.1
Three fundamental trade-offs Trade-off 1: Response surface smoothness
Recall the DetPep10 function in Section 2.3, where AM fails to select the optimal setting x∗ even when all settings have been observed in X . This nicely motivates the first trade-off between AM and PW, concerning which response surfaces can be optimized well under each method. Consider the following proposition, which provides sufficient conditions on when AM is guaranteed to converge to x∗ : Proposition 1 (Convergence guarantee of AM). Let Ml be the marginal mean Mmean in ˆ = (ˆ (3), and let x x1 , · · · , xˆp ) be the corresponding AM predictor (where xˆl is defined in (6)). Suppose Dn = X , i.e., all parameter settings have been observed. If f satisfies: f (ˆ xl ; x−l ) ≤ f (xl ; x−l ),
for all x−l ∈ X−l , xl ∈ [Nl ] and l = 1, · · · , p,
ˆ equals the true optimal setting x∗ . then the AM predictor x 12
(12)
Figure 3: A visualization of when the marginal-conditional requirement in (12) is satisfied, and when it is violated.
ˆ arrives at the true optimal In other words, under the condition in (12), the AM predictor x setting x∗ when all settings have been observed. While the requirement in (12) may seem complicated, its implications are quite simple and intuitive. To see this, choose a particular factor l = 1, · · · , p, and some level combination x−l for the remaining l − 1 factors. Equation (12) requires that, for each factor l, every conditional function slice with fixed x−l (namely, the set of Nl values in {f (xl ; x−l ), xl ∈ [Nl ]}) is minimized at the level with the smallest marginal mean (i.e., xˆl ). Figure 3 visualizes this using the earlier example with p = 2 factors. Here, suppose the first factor has the lowest marginal mean at level 3, meaning xˆ1 = 3. The two plots on the right-hand side show two possible scenarios for the conditional function slices taken at levels x−1 = 1 and x−1 = 3 of the second factor. For the first conditional slice (top), we see that its minimum is found at level 3 of the first factor, which corresponds to the level with smallest marginal mean xˆ1 = 3. For the second conditional slice (bottom), its minimum is found at level 2 of the first factor, which is not in line with xˆ1 = 3. The first function slice therefore satisfies condition (12), while the second does not. The convergence condition for AM requires that, for all factors, the level which minimizes each conditional function slice must be the level which minimizes the marginal mean; we will call (12) the marginal-conditional requirement (MCR) from here on.
13
Figure 4: Conditional function slices {f (x1 ; x−1 ), x1 ∈ [5]} for the Friedman and DetPep10 functions over all possible choices of x−1 ∈ X−1 . Dotted gray lines indicate that the MCR condition in (12) is satisfied, and solid red lines indicate a violation.
When f is composed of only main effects and perhaps some minor interaction effects, it is clear that the MCR condition holds. However, when a sufficiently large interaction is present, MCR can easily be violated. As a brief remark, MCR can be viewed as a more general (and perhaps more intuitive) characterization of a result in Wu et al. (1987), which showed that AM converges to the optimal setting x∗ if f can be written as a monotone function of main effects. Proposition 1 shows that AM can still perform well in the presence of interaction effects, as long as such interactions are minor compared to main effects. PW, on the other hand, has no such function restrictions, as the following result shows: Proposition 2 (Convergence guarantee of PW). Let Ml be the marginal minimum Mmin ˆ be the corresponding PW predictor from (6) and (7). Suppose Dn = X , in (4), and let x ˆ = x∗ for any choice of f . i.e., all parameter settings have been observed. Then x ˆ always arrives at the true In other words, for all response surfaces f , the PW predictor x optimal setting x∗ when all settings have been observed. This shows that PW enjoys a much stronger optimization guarantee than AM with regards to response surface smoothness. The motivating examples in Section 2.3 nicely illustrate this smoothness trade-off between AM and PW. For the l = 1-st factor of both the Friedman and DetPep10 function, Figure 14
Figure 5: (Left) The Beta(5, 5) density for simulating function values. (Right) The sampling distributions for the sample mean, sample minimum and sample tail mean with percentile α = 0.2. Dotted red lines indicate the parameters of interest. The corresponding MSE of each estimator is shown on the bottom.
4 shows the conditional function slices {f (x1 ; x−1 ), x1 ∈ [5]} for all possible choices of the remaining variables x−1 ∈ X−1 , with xˆ1 = 1 for Friedman, and xˆ1 = 4 for DetPep10. Gray lines indicate that MCR is satisfied for that particular function slice, while red lines indicate MCR is violated for that slice. For the Friedman function, we see that there are no violations of MCR, despite this function having the small interaction term 10 sin(πx1 x2 ) in (8). This, along with Proposition 1, explains the excellent performance of AM for such a function (see Table 1). For the DetPep10 function, however, many of these conditional slices violate MCR, in that the minimum level of such slices are not in line with the minimum marginal level xˆ1 = 4. This, along with Propositions 1 and 2, explains why AM performs poorly for DetPep10 and why PW performs well. The proposed ATM method, by employing tail means as marginal statistics, offers a transition from the restrictive function space for AM to the unrestrictive space for PW. 3.2.2
Trade-off 2: Estimation accuracy of marginal quantities
If PW offers the best optimization guarantees, why then does AM perform better than PW for the Friedman function? The second trade-off offers an answer to this question: the marginal means in AM can be estimated more accurately than the marginal minima in PW. To see this, suppose the marginal samples in Fˆl (xl ) are sampled uniformly-at-random 15
from the function slice Fl (xl ), with the function values in Fl (xl ) randomly sampled from a Beta(5, 5) distribution (this ensures values are concentrated near the median; see left plot in Figure 5). The right plots in Figure 5 shows the sampling distributions of the estimated marginal quantity m ˆ l (xl ) for the mean, minimum and tail mean (with α = 0.2), using m = 20 samples. The dotted red lines indicate the true marginal quantity ml (xl ) (i.e., mean, minimum or tail mean), with the corresponding mean-squared-errors (MSE) of the sampling distributions shown below. For the marginal mean, we see that the sample estimator m ˆ l (xl ) is unbiased, and enjoys low estimation error in terms of MSE. For the marginal minimum, however, the sample estimator m ˆ l (xl ) has a large positive bias and high variance, thereby yielding poor estimation in terms of MSE. The proposed tail mean estimator strikes a compromise between the excellent estimation of the marginal mean with the poor estimation of the marginal minimum. This trade-off on estimation accuracy, along with the earlier trade-off on function smoothness, nicely demonstrates why the proposed ATM method can offer more robust and effective optimization than both AM and PW. On one hand, when a response surface is sufficiently smooth (i.e., satisfies the MCR condition), AM can leverage its excellent estimation of marginal means to effectively guide the optimization procedure. This is clearly seen in the excellent performance of AM over PW in the Friedman function (see Table 1). On the other hand, when a response surface is rugged (i.e., violates MCR), the excellent estimation of marginal means is rendered useless by the fact that AM does not converge to the correct solution (see Proposition 1)! For such functions, PW can offer much better performance than AM, despite the poor estimation accuracy of marginal minima. The proposed ATM method provides an adaptive way to optimally trade-off between function smoothness and estimation accuracy (more on this adaptive procedure in Section 4), which then allows for effective and robust optimization for a broad range of functions. 3.2.3
Trade-off 3: Model-based vs. rank-based optimization
Lastly, the proposed ATM approach also reveals an insightful trade-off between AM and PW in terms of a model-based vs. rank-based approach to optimization. Indeed, one way of 16
viewing the AM method is that it first fits a multi-way main-effects model for the response surface f over the full space X , then predicts the optimum setting based on this fitted model. PW, on the other hand, is a purely rank -based approach; it predicts the optimal setting x∗ using only the ranking of the observed function evaluations. As noted in Wu et al. (1990), this rank-based approach can out-perform model-based methods when the response surface f is rugged, because an empirical model which fits the observed data well may not yield a good approximation of f . This corroborates the results observed in Table 1. In this light, the proposed ATM approach offers a bridge between the model-based approach in AM and the rank-based approach in PW. To see this, suppose the percentiles αl are set at 0.5 for all factors l = 1, · · · , p. ATM can then be interpreted as first removing the largest 50% of observations within each marginal slice, then fitting a main-effects model using the remaining observations. Put another way, the proposed method first uses a rank-based approach for truncating the data to only the smallest observations of interest, then employs a model-based approach to predict the optimal setting using this truncated dataset. A larger amount of truncation (corresponding to a smaller choice of αl ) results in a better fit for the resulting main-effects model, but comes at a cost of poorer estimation of tail means. By adaptively trading off between model-based and rank-based methods, ATM offers more robust optimization performance to both AM and PW.
3.3
Back to motivating examples
With these trade-offs in mind, let us return to the earlier motivating examples of the Friedman and DetPep10 functions. Consider here the simple case where αl = α, i.e., the same percentile α is used for the marginal tail means Mtail,αl over all p factors. Figure 6 ˆ α in (11) at different choices shows the predicted minimum f (ˆ xα ) using the ATM predictor x of α ∈ (0, 1), with designs chosen as n = 25-run OAs with randomized level permutations (results averaged over 100 replications). Again, the ATM predictor with α = 1 corresponds to AM, and the ATM predictor with α = 0 corresponds to PW. For the Friedman function, ATM provides better performance as α increases, with α = 1 (namely, AM) yielding the best
17
Figure 6: The predicted minimum f (ˆ xα ) using ATM, averaged over 100 randomly-permutated OAs with n = 25 function evaluations. The blue and red dotted lines indicate the minimum estimates using AM (ATM with α = 1) and PW (ATM with α = 0), respectively.
estimate of the optimal setting x∗ . This is not at all surprising given the earlier trade-offs, because the Friedman function satisfies the MCR condition in (12), so a larger choice of α provides better estimation of marginal quantities and thereby better minimization. For the DetPep10 function, a more curious phenomenon occurs. While ATM with α = 0 (i.e., PW) performs better than ATM with α = 1 (i.e., AM), a choice of α ≈ 0.3 yields an improvement over both AM and PW! This illustrates a key advantage of ATM: when MCR is violated for the response surface f , ATM offers a way to trade-off between function smoothness and estimation accuracy via the choice of percentiles α, with the optimization performance from an optimal choice of α potentially better than both AM and PW.
4
Implementation of ATM
A practical problem still remains: how does one tune for an optimal choice of percentiles α, using only the data observed at design Dn ? We present in this section an effective tuning method which makes use of a fitted surrogate model on f , then introduce a sequential implementation of ATM which employs bootstrapping and level elimination to guide the optimization procedure.
18
4.1
Tuning the ATM percentiles α
Recall the two contrasting scenarios in Figure 6: the excellent performance of ATM with αl = α = 1.0 (i.e., AM) for the Friedman function, and the optimal trade-off of αl = α ≈ 0.3 for the DetPep10 function. We want to use the observed function evaluations to distinguish between these scenarios, namely, (a) to determine if the MCR condition (12) is violated, and if so, (b) how to tune for an optimal trade-off via the ATM percentiles α? Note that the employed OA design allows for preliminary modeling of f – it offers reliable estimates of main effects, while also providing a glimpse of significant interactions. The proposed tuning method, called tune.alpha, exploits this modeling advantage of OAs by using a fitted response surface to answer questions (a) and (b). The logic behind tune.alpha is as follows. We wish to use the main effect and interaction estimates from the OA design to fit a surrogate surface fˆ, then use fˆ to tune for a good choice of percentiles in ATM. To disentangle the partially-aliased interaction effects, we employ a state-of-the-art method called hierNet (Bien et al., 2013), which uses convex programming to select a fitted model fˆ satisfying the principle of (weak) effect heredity (Wu ˆ = (ˆ and Hamada, 2009). With fˆ in hand, our strategy is to find the percentiles α α1 , · · · , α ˆp) which, when used within ATM, yields the smallest function value for the fitted surface ˆ αˆ (with tuned percentiles α) ˆ is then used to estimate fˆ. The tuned ATM predictor x the minimum setting for the true surface f . The rationale here is that the fitted surface fˆ (specifically, its fitted main effects and interactions from hierNet) allows us to detect whether MCR is violated for the true surface f ; if a violation is likely, fˆ is then used as a proxy for f to calibrate an optimal trade-off via the ATM percentiles α. Implementation-wise, tune.alpha performs the following three steps. First, using the function evaluations from design Dn , we fit a surrogate surface fˆ using hierNet, which identifies and estimates important main effects and interactions in f using convex ˆ from a grid of candidate programming. Next, using fˆ, we search for the optimal percentiles α percentiles G, so that fˆ(ˆ xαˆ ) ≤ fˆ(ˆ xα ) for all candidate percentiles α ∈ G. Finally, the tuned ˆ are then incorporated into the ATM predictor x ˆ αˆ for estimating x∗ . The percentiles α
19
Algorithm 1 tune.alpha(y, Dn , NG ): Tuning the tail mean percentiles α in ATM • Fit the surrogate response surface fˆ ← hierNet(y, Dn ). . y ≡ f (Dn ) • Form a grid of candidate percentiles G = ×pl=1 ([NG ] − 1)/(NG − 1). . NG – desired number of grid levels ˆ ← argminα∈G fˆ(ˆ • Estimate the optimal percentiles α xα ). ˆ • Return α. details for tune.alpha are provided in Algorithm 1. To understand why tune.alpha is an effective tuning procedure, consider first the case where MCR is satisfied for the true function f (e.g., the Friedman function). For such functions, interaction effects are weak relative to main effects (see Section 3.2.1). If the fitted interaction effects in fˆ are also weak relative to fitted main effects, then the tuned ˆ returned by tune.alpha must all be close to 1.0, because with fˆ satisfying percentiles α ˆ offers the most accurate estimation of marginal MCR (trade-off 1), such a choice of α quantities (trade-off 2). Conversely, when MCR is violated for the true function f (e.g., the DetPep10 function), there must exist interactions which are strong compared to main effects. In such a case, we rely on hierNet to detect and incorporate these strong interactions in ˆ will shift closer to 0, in the fitted surface fˆ; when this happens, the tuned percentiles α order to balance the MCR violation (trade-off 1) with estimation accuracy (trade-off 2). Of course, more data are needed to detect significant interactions, so tune.alpha tends to choose larger choices of α for smaller designs. ˆ αˆ (tuned with tune.alpha), We mention a key distinction between the ATM predictor x and a direct minimization of the fitted model fˆ. The former uses the fitted interactions in fˆ to tune for an optimal choice of percentiles within the ATM prediction framework, whereas the latter employs the fitted surface fˆ to directly predict the optimal setting x∗ . As noted in Wu et al. (1990), the direct optimization of fˆ can yield poor results when the true surface f is non-smooth, because fˆ gives a poor fit to f from limited data. To contrast, tune.alpha makes use of the relative strength of interactions to main effects (which can be more reliably estimated from OAs) to tune for an optimal trade-off via the ATM percentiles α. This allows the proposed method to adaptively optimize a broad class of smooth and
20
rugged functions, as we show later in numerical examples.
4.2
De-biasing tail mean estimates via bootstrapping
Recall now the earlier trade-off in estimation accuracy (Section 3.2.2) offered by the marginal tail mean. Taking a closer look at the right-most plot in Figure 5, we see that the sample tail mean m ˆ α (xl ) (with α = 0.2) is positively biased for the true tail mean, in that its sampling distribution is centered to the right of the dotted red line. Indeed, using a well-known result in robust statistics (Rychlik, 1998), one can show that for any distribution F , the sample tail mean in (10) is always positively biased for the true tail mean, with this bias growing larger for smaller percentiles α. The concern is that, whenever the function values in Fl (xl ) have different degrees of variability between different levels xl ∈ [Nl ], each level can experience varying degrees of bias: some levels can have larger biases, while other levels can have smaller biases. These varying biases can affect the marginal level predictor xˆl in ˆα. (11), which then greatly skew the ATM predictor x From actuarial science literature, an effective method for de-biasing tail mean estimates is via bootstrapping (Kim and Hardy, 2007). Applied here, such a method makes use of resampling from the observed marginal slice Fˆl (xl ) to estimate the bias for each tail mean estimator m ˆ αl (xl ), xl ∈ [Nl ]. However, since the “population” here (namely, the full marginal slice Fl (xl )) is finite, a modification to the usual bootstrap is needed to account for the dependence structure in finite-population sampling. To this end, we apply the superpopulation bootstrap introduced in Presnell and Booth (1994) and Booth et al. (1994), which builds upon several key ideas on finite population sampling and bootstrapping (see, e.g., Bickel and Freedman, 1984; Rao and Wu, 1988). For each factor l = 1, · · · , p and each level xl ∈ [Nl ], our implementation of the superpopulation bootstrap (called super.boot) can be applied as follows. First, using the observed slice Fˆl (xl ), a so-called “superpopulation” F ∗ (xl ) is sampled with replacement from l
Fˆl (xl ), with the size of Fl∗ (xl ) matching the population Fl (xl ). Next, a bootstrap sample Fˆ ∗ (xl ) is sampled without replacement from the superpopulation F ∗ (xl ), with the size of l
l
21
Algorithm 2 super.boot(Fˆl (xl ), Mtail,αl , Rboot ): De-biasing marginal tail mean estimates for r = 1, · · · , Rboot do . Rboot – desired number of bootstrap samples • Obtain the superpopulation Fl∗ (xl ) by sampling Fˆl (xl ) with replacement, with #{Fl∗ (xl )} = #{Fl (xl )}. • Obtain the bootstrap sample Fˆl∗ (xl ) by sampling Fl∗ (xl ) without replacement, with #{Fˆl∗ (xl )} = #{Fˆl (xl )}. • Set b∗r ← Mtail,αl {Fˆl∗ (xl )} − Mtail,αl {Fˆl (xl )}. P boot ∗ • Return the de-biased tail mean estimate Mtail,αl {Fˆl (xl )} − (1/Rboot ) R r=1 br . Fˆl∗ (xl ) matching the observed slice Fˆl (xl ). Finally, using the superpopulation bootstrap sample Fˆ ∗ (xl ), the bias of the marginal tail mean estimator m ˆ α (xl ) can be estimated as: l
l
b∗ = Mtail,αl {Fˆl∗ (xl )} − Mtail,αl {Fˆl (xl )}.
(13)
Repeating this procedure, the average bootstrapped bias from (13) then yields a good estimate of the bias for m ˆ αl (xl ). Algorithm 2 summarizes the above steps for super.boot. We make a final remark on when this de-biasing method should be used. It is well-known (see, e.g., Hall, 2013) that when the original sample is very small, the resulting bootstrapped estimates may be unreliable due to the limited number of unique bootstrap resamples. This means super.boot can yield unreliable bias corrections whenever (a) the number of marginal observations m is too small (see (10)), or (b) the percentile αl is too close to 0. Because of this, we implement super.boot only when mαl ≥ 3Nl , where Nl is the number of levels for factor l. This rule works well in practice, as we see later in numerical examples.
4.3
sel.atm – Sequential-Elimination-of-Levels (SEL) using ATM
Combining these ingredients together, we now introduce a sequential optimization algorithm called sel.atm, which iteratively applies ATM to predict the optimal setting x∗ . This can be viewed as a special instance of the Sequential-Elimination-of-Levels method in Wu et al. (1990), which sequentially eliminates the worst level from each factor using a given marginal statistic. However, instead of using the marginal mean or minimum (as investigated in Wu et al., 1990), we employ the novel marginal tail mean estimator (tuned using tune.alpha) 22
Algorithm 3 sel.atm(Telim , Rboot , NG ): Sequential-Elimination-of-Levels using ATM • Initialize empty design Dn = ∅. for t = 1, · · · , Telim do Q • Add to Dn the smallest OA with levels pl=1 (Nl − t + 1), and update y ← f (Dn ). ˆ ← tune.alpha(y, Dn , NG ). • Tune the ATM percentiles α for l = 1, · · · , p and xl ∈ [Nl ] do . For each factor l and each level xl ... • Obtain the de-biased estimates m ˆ αˆ l (xl ) ← super.boot(Fˆl (xl ), Mtail,αˆ l , Rboot ). ˆ αˆ using (11). • Predict the optimal setting x for l = 1, · · · , p do . For each factor l... • Remove level xl with largest marginal tail mean estimate m ˆ αˆ l (xl ). ˆ αˆ . • Return the predicted optimal setting x as the marginal statistic of choice for performing this level elimination. The proposed sequential algorithm sel.atm consists of the following three steps. First, function evaluations are collected on f using an initial OA design. Next, the tail mean percentiles α are tuned using tune.alpha, and the corresponding marginal estimates m ˆ αˆ l (xl ) ˆ αˆ is obtained from are de-biased using super.boot. Finally, the predicted optimal setting x (11), and the level xl with the largest tail mean estimate m ˆ αˆ l (xl ) is eliminated for each factor l. These three steps are then repeated iteratively for a fixed number of times Telim , or until a unique level combination remains. Algorithm 3 summarizes these steps for sel.atm. The original motivation behind the SEL method is that one can make use of marginal statistics, such as the mean or the minimum, to sequentially eliminate unwanted factor levels. However, from Section 3.2, we know that SEL using the marginal mean can eliminate the wrong levels when f violates MCR; likewise, SEL with the marginal minimum can erroreously remove levels due to poor marginal estimation. Viewed this way, sel.atm offers an adaptive scheme which uses the observed data to tune an optimal trade-off between function smoothness and estimation accuracy, thereby providing a more effective and robust level elimination method for optimizing both smooth and rugged response surfaces.
23
5
Numerical examples
We now investigate the optimization performance of sel.atm for several test functions: the earlier Friedman and DetPep10 functions, the 6-d Griewank function (Griewank, 1981): � � 6 6 X Y x2l xl f (x) = − cos √ + 1, 4000 l=1 l l=1
x ∈ [−5, 5]6 ,
(14)
and the 5-d Rosenbrock function (Rosenbrock, 1960): f (x) =
4 X �
� 100(xl+1 − x2l )2 + (xl − 1)2 ,
x ∈ [−2.048, 2.048]5 .
(15)
l=1
All four functions are common test problems in the optimization literature. For the Friedman and DetPep10 functions, Nl = 5 levels are used for each factor; for Griewank, Nl = 4; and for Rosenbrock, Nl = 6. Here, we compare the proposed method sel.atm (with and without the bias adjustment super.boot) with SEL using marginal means (or sel.mean) and SEL using marginal minima (or sel.min). The latter two methods sequentially eliminate the level with the highest marginal mean and minimum, respectively. To provide a measure of variability, we replicate these four methods for 250 trials. Figure 7 shows the boxplots of the predicted minimum values f (ˆ x) using these four methods. Consider first the boxplots with no level eliminations (the left-most plot for each function), in which case sel.mean reduces to AM, sel.min reduces to PW, and sel.atm reduces to ATM (with percentiles tuned via tune.alpha). For the Friedman function, AM performs much better than PW, which is expected because this function satisfies the MCR condition (see Figure 4). Moreover, ATM provides very comparable performance to AM, which shows that tune.alpha can indeed detect the smoothness of f from observed function evaluations, and choose an appropriate percentile αl ≈ 1 to maximize estimation accuracy. For the remaining three functions, PW yields better performance to AM, which is unsurprising because such functions are more rugged and violate MCR. Here, ATM offers noticeably improved results to AM, and slightly worse performance to PW. In light of Section 4.1, this makes perfect sense: while the observed data provide some evidence
24
Figure 7: Boxplots of predicted minimum values f (ˆ x) using sel.min, sel.mean, sel.atm without super.boot (NSB), and sel.atm with super.boot (SB). Rows correspond to different test functions, and columns correspond to the number of levels sequentially eliminated. Dotted red lines indicate the global minimum f (x∗ ).
for significant interactions, the first-round design is too small to make such a conclusion definitively, hence tune.alpha selects percentiles which are slightly larger than the optimal choice. Altogether, these results show that the tuned ATM procedure indeed provides more robust optimization performance than AM and PW for a broader range of functions. Consider next the boxplots after one and two rounds of level elimination (the middle and right-most plots for each function in Figure 7). For the latter three functions, sel.min yields the best performance in each round, which is expected because these functions are rugged with significant interactions. The proposed method sel.atm provides increasingly comparable results to the gold standard of sel.min as more levels are eliminated (with nearly identical boxplots after the second round), and offers considerable improvements over sel.mean. This nicely illustrates the effectiveness of tune.alpha in adaptively adjusting 25
OTL circuit
Piston
Input variables (units)
Design boundaries
Input variables (units)
Design boundaries
Resis. B1 (Ohms) Resis. B2 (Ohms) Resis. F (Ohms) Resis. C1 (Ohms) Resis. C2 (Ohms) Current gain (Amps)
Rb1 ∈ [50, 150] Rb2 ∈ [25, 70] Rf ∈ [0.5, 3] Rc1 ∈ [1.2, 2.5] Rc2 ∈ [0.25, 1.2] β ∈ [50, 300]
Piston weight (kg) Piston surface area (m2 ) Initial gas volume (m3 ) Spring coef. (N/m) Ambient temp. (K) Filling gas temp. (K)
M ∈ [30, 60] S ∈ [0.005, 0.02] V0 ∈ [0.002, 0.01] k ∈ [1000, 5000] Ta ∈ [290, 296] T0 ∈ [340, 360]
Table 2: Input variables and design boundaries for the OTL circuit and piston functions.
to smaller percentiles for αl as more data are collected. For the Friedman function, a more curious phenomenon occurs. While sel.mean provides better performance to sel.min, sel.atm offers considerable improvements over both as more levels are eliminated. One explanation is that sel.atm employs an optimal trade-off between model-based and rankbased optimization (trade-off 3), which compared to purely model-based or rank-based approaches, allows for improved elimination of unwanted levels and thereby better prediction of x∗ . Again, sel.atm not only offers a more robust method (compared to sel.min and sel.mean) for optimizing a broad range of functions, but can also yield improved optimization performance over these two methods. Lastly, from Figure 7, sel.atm with the de-biasing adjustment super.boot provides noticeably better results for DetPep10 and Griewank, but yields little-to-no improvements for Friedman and Rosenbrock. Such a result is not too surprising, because super.boot is most effective whenever the response surface f experiences differing variability between different marginal levels (see Section 4.2), as is the case for the former two functions. However, even for the latter two functions, this adjustment does not appear to provide worse performance; we therefore suggest that super.boot be always used within sel.atm.
26
6
Applications
Finally, we compare the performance of the proposed method sel.atm with the existing methods sel.min and sel.mean for two real-world parameter optimization problems. The first is the 6-d OTL circuit function in Ben-Ari and Steinberg (2007): Vm (x) =
11.35Rf 0.74Rf β(Rc2 + 9) 12Rb2 (Vb1 + 0.74)β(Rc2 + 9) , Vb1 = + + , β(Rr2 + 9) + Rf β(Rc2 + 9) + Rf (β(Rc2 + 9) + Rf )Rc1 Rb1 + Rb2 (16)
which models the midpoint voltage Vm (in Amperes) of a transformer-less push-pull circuit. The engineering specification of the six input variables is provided in Table 2. The second is the 7-d piston function, also found in Ben-Ari and Steinberg (2007): v u u C(x) = 2π t
M
S � � ,V = � T P V 2k 0 k + S2 0 0 T0
! P V kV0 0 0 A2 + 4k Ta − A , A = P0 S + 19.62M − , T0 S
r
V2
(17)
which models the cycle time C (in seconds) for the circular motion of a piston without a cylinder. The specification for the seven inputs is provided in Table 2. For both functions, Nl = 4 levels are used for each factor. We consider here two types of parameter design problems. The first is the so-called smaller-the-better problem (Wu and Hamada, 2009), which aims to find an optimal input setting which minimizes the output response (e.g., midpoint voltage or cycle time). The second is the so-called nominal-the-best problem (Wu and Hamada, 2009), which tries to find an input setting which achieves a target output value f ∗ . For this nominal-the-best problem, we also want the input setting to be a robust parameter design (Taguchi, 1986), in that it provides outputs which are close to the target f ∗ , even when actual inputs deviate slightly from an intended setting. Such a design offers reliable performance in presence of noise, with the noise factors being deviations from an intended input setting. The following objective function accounts for both of these goals in the nominal-the-best problem: f˜(x) = max |f (x + t) − f ∗ |. t∈T
27
(18)
x) using sel.min, sel.mean, sel.atm Figure 8: Boxplots of predicted minimum values f (ˆ without super.boot (NSB), and sel.atm with super.boot (SB). (Left) The two smaller-the-better parameter design problems; (Right) the two nominal-the-best robust parameter design problems. Dotted red lines indicate the global minimum f (x∗ ).
Here, f is the output response, and T ⊆ Rp is the tolerance set of deviances for input settings. An optimal setting x∗ which minimizes f˜(x) does not deviate too much from the target f ∗ over the tolerance set T , which is the desired goal. In total, four parameter optimization problems are considered here – two smaller-thebetter problems (one for each function) and two nominal-the-best problems (one for each function). For the nominal-the-best problems, we approximate the maximization over the tolerance set T in (18) using the smallest OA design with 5p levels – a so-called “noise array” (Taguchi, 1986). For the OTL and piston functions, the target output f ∗ set as 3.4 and 0.25, respectively, with T set as the factorial space ×6l=1 [−0.025∆l , 0.025∆l ] and ×7l=1 [−0.01∆l , 0.01∆l ], where ∆l is the design range of the l-th factor (see Table 2). Each of the four optimization algorithms are replicated for 250 trials. Consider first the left part of Figure 8, which shows the boxplots of the predicted minimum 28
x) for the two smaller-the-better problems. Here, sel.mean provides better values f (ˆ performance to sel.min, which is not surprising because both functions are quite smooth with only minor interaction effects. sel.atm (with super.boot) also yields considerable improvements over sel.min, and provides very comparable performance to sel.mean, even outperforming this method for the OTL circuit function. Consider next the right part of Figure 8, which show the boxplots for the two nominal-the-best robust design problems. Here, sel.min offers sizable improvements over sel.mean, which is expected because the noise function f˜ in (18) is more rugged than the original function f . The proposed method sel.atm (with super.boot) appears to be quite effective in adaptively adjusting to the ruggedness of f˜ as more data are collected, and provides comparable or improved performance to sel.min after two rounds of level elimination. These results nicely illustrate the two-fold advantage of the proposed method sel.atm. First, this method offers robust optimization over a broad range of smooth and rugged response surfaces, whereas the existing methods sel.min and sel.mean can perform poorly for smooth and rugged surfaces, respectively. This is in large part due to the tuning algorithm tune.alpha, which makes use of fitted main effects and interactions to determine an optimal compromise between three important optimization trade-offs (see Section 3.2). Second, by exploiting these trade-offs, sel.atm can outperform both sel.min and sel.mean, particularly in later rounds of the sequential elimination procedure.
7
Conclusion
In this paper, we present a new method called Analysis-of-marginal-Tail-Means (ATM), which provides effective parameter optimization for a broad range of smooth and rugged response surfaces, using a limited number of function evaluations. This proposed approach unifies two popular methods in the literature: the Analysis-of-marginal-Means (AM) approach (Taguchi, 1986) – which predicts the optimal parameter setting using estimated marginal means, and the Pick-the-Winner (PW) approach (Wu et al., 1990) – which predicts the optimal setting as the best observed parameter setting. The key innovation in ATM 29
is the use of conditional tail means as the marginal statistic of choice for optimization; by shifting the percentiles for these tail means between 0 to 1, ATM provides a bridge between the PW and AM methods. We show in the paper how such a bridge offers three fundamental trade-offs in optimization, concerning response surface smoothness, estimation accuracy of marginal quantities, and the dichotomy between model-based and rank-based optimization. We then introduce the adaptive tuning procedure tune.alpha, which uses a fitted surrogate model fˆ to tune for an optimal trade-off via the ATM percentiles; this is a crucial ingredient for the effectiveness of ATM. Because tail mean estimates are inherently biased, we propose the bootstrap method super.boot for de-biasing the marginal tail mean estimates in ATM. Combining everything together in a novel level elimination algorithm called sel.atm, we demonstrate using simulations and real-world applications how sel.atm offers more effective and robust performance over existing parameter optimization methods. Looking forward, there are several research directions to pursue next. One such direction is to further improve the proposed algorithm sel.atm using recent developments on the sequential level elimination method, including the genetic algorithm and Gaussian process modifications in Mandal et al. (2006) and Mandal et al. (2009), respectively. Another potentially fruitful direction is to apply the methods in this paper for warm-starting and accelerating large-scale integer programming problems. Lastly, the conditional nature of the MCR condition in (12) appears to have some connections to recent work on conditional main effects (Wu, 2015; Su and Wu, 2017; Mak and Wu, 2017), and it would be interesting to see whether an alternate modeling approach from this body of work can yield improved optimization performance for sel.atm.
References Baker, H. K. and Filbeck, G. (2014). Investment Risk Management. Oxford University Press. Barone Adesi, G. (2016). VaR and CVaR implied in option prices. Journal of Risk and Financial Management, 9(1):2. Ben-Ari, E. N. and Steinberg, D. M. (2007). Modeling data from computer experiments: an empir-
30
ical comparison of kriging with MARS and projection pursuit regression. Quality Engineering, 19(4):327–338. Bickel, P. J. and Freedman, D. A. (1984). Asymptotic normality and the bootstrap in stratified sampling. The Annals of Statistics, 9(6):470–482. Bien, J., Taylor, J., and Tibshirani, R. (2013). A lasso for hierarchical interactions. The Annals of Statistics, 41(3):1111–1141. Booth, J. G., Butler, R. W., and Hall, P. (1994). Bootstrap methods for finite populations. Journal of the American Statistical Association, 89(428):1282–1289. Dette, H. and Pepelyshev, A. (2010). Generalized Latin hypercube design for computer experiments. Technometrics, 52(4):421–429. Friedman, J. H., Grosse, E., and Stuetzle, W. (1983). Multidimensional additive spline approximation. SIAM Journal on Scientific and Statistical Computing, 4(2):291–301. Griewank, A. O. (1981). Generalized descent for global optimization. Journal of Optimization Theory and Applications, 34(1):11–39. Hall, P. (2013). The Bootstrap and Edgeworth Expansion. Springer Science & Business Media. Hardy, M. R. (2006). An introduction to risk measures for actuarial applications. SOA Syllabus Study Note. Huber, P. J. (2011). Robust statistics. In International Encyclopedia of Statistical Science, pages 1248–1251. Springer. Joseph, V. R., Gul, E., and Ba, S. (2015). Maximum projection designs for computer experiments. Biometrika, 102(2):371–380. Kim, J. H. T. and Hardy, M. R. (2007). Quantifying and correcting the bias in estimated risk measures. ASTIN Bulletin, 37(2):365–386. Mak, S. and Joseph, V. R. (2017). Projected support points, with application to optimal MCMC reduction. arXiv preprint arXiv:1708.06897. Mak, S., Sung, C. L., Wang, X., Yeh, S. T., Chang, Y. H., Joseph, V. R., Yang, V., and Wu, C. F. J. (2017). An efficient surrogate model for emulation and physics extraction of large eddy simulations. Journal of the American Statistical Association. To appear. Mak, S. and Wu, C. F. J. (2017). cmenet: a new method for bi-level variable selection of conditional main effects. arXiv preprint arXiv:1701.05547. Mandal, A., Ranjan, P., and Wu, C. F. J. (2009). g-selc: Optimization by sequential elimination of level combinations using genetic algorithms and Gaussian processes. The Annals of Applied
31
Statistics, 3(1):398–421. Mandal, A., Wu, C. F. J., and Johnson, K. (2006). SELC: Sequential elimination of level combinations by means of modified genetic algorithms. Technometrics, 48(2):273–283. Presnell, B. and Booth, J. G. (1994). Resampling methods for sample surveys. Technical Report No. 470, Department of Statistics, University of Florida. Rao, J. N. and Wu, C. F. J. (1988). Resampling inference with complex survey data. Journal of the American Statistical Association, 83(401):231–241. Rosenbrock, H. (1960). An automatic method for finding the greatest or least value of a function. The Computer Journal, 3(3):175–184. Rychlik, T. (1998). Bounds for expectations of L-estimates. Handbook of Statistics, 16:105–145. Santner, T. J., Williams, B. J., and Notz, W. I. (2013). The Design and Analysis of Computer Experiments. Springer Science & Business Media. Su, H. and Wu, C. F. J. (2017). CME analysis: a new method for unraveling aliased effects in two-level fractional factorial experiments. Journal of Quality Technology, 49(1):1–10. Taguchi, G. (1986). Introduction to Quality Engineering: Designing Quality into Products and Processes. Quality Resources. Wu, C. F. J. (2015). Post-Fisherian experimentation: from physical to virtual. Journal of the American Statistical Association, 110(510):612–620. Wu, C. F. J. and Hamada, M. S. (2009). Experiments: Planning, Analysis, and Optimization. John Wiley & Sons. Wu, C. F. J., Mao, S. S., and Ma, F. S. (1987). An investigation of OA-based methods for parameter design optimization. Technical Report No. 24, Center for Quality and Productivity Improvement, University of Wisconsin-Madison. Wu, C. F. J., Mao, S. S., and Ma, F. S. (1990). SEL: A search method based on orthogonal arrays. In Statistical Design and Analysis of Industrial Experiments (S. Ghosh, ed.), pages 279–310. Marcel Dekker.
32
Appendices A
Proof of Proposition 1
Proof. Let x ∈ X be an arbitrary parameter setting. Note that: f (x) = f (x1 , x2 , · · · , xp ) ≥ f (ˆ x1 , x2 , · · · , xp )
(by the MCR condition in (12))
≥ f (ˆ x1 , xˆ2 , · · · , xp ) .. .
(again, by (12))
≥ f (ˆ x1 , xˆ2 , · · · , xˆp ) = f (ˆ x). ˆ must be an optimal setting satisfying x) for any x ∈ X , which means x Hence, f (x) ≥ f (ˆ (1). This proves the proposition.
B
Proof of Proposition 2
Proof. This can easily be shown using first principles. Fix a particular factor l = 1, · · · , p, and let Ml be the marginal minimum statistic Mmin . Note that: � xˆl = Argmin m ˆ l (xl ) = Argmin xl ∈[Nl ]
xl ∈[Nl ]
� min y
y∈Fl (xl )
= x∗l ,
where the last step follows because the double minimum over level xl ∈ [Nl ] and marginal slice Fl (xl ) returns the smallest function value of f on X . Repeating this argument for every factor l ∈ 1, · · · , p proves the statement.
33