Clinical Chemistry 51:7 1232–1240 (2005)
Laboratory Management
The REALAB Project: A New Method for the Formulation of Reference Intervals Based on Current Data Enzo Grossi,1 Roberto Colombo,2 Silvio Cavuto,3 and Carlo Franzini4*
Background: In a primary healthcare center concerned more with maintaining wellness than with diagnosing and monitoring illness, it is particularly important to compare patients’ results with reference intervals derived from a matched population by use of defined statistical methods. Methods: Laboratory results over a 3-year period (⬃15 000 000 records; 197 350 individuals) were retrieved from our laboratory information system. An inclusion/ exclusion procedure for individual patients was applied based on (a) presence of at least 1 of 23 previously defined “basic tests”; (b) only 1 measurement per test by the laboratory over the 3-year period; (c) for each test, absence of any abnormality in the correlated tests. Before the third step, correlations among quantities were assessed by a Spearman correlation matrix, comparing each of the 23 basic tests with all remaining tests by use of a novel multivariate algorithm. Results: The initial sample group (n ⴝ 197 350) was reduced stepwise by the selection criteria outlined above to 166 027, then to 93 649, and finally to 61 246 individuals constituting our reference sample group. Results from the last 2 groups were used to calculate sex-specific, and in some cases age-related, reference limits for the 23 basic tests and for 13 additional quantities. Reference limits were calculated throughout this study by nonparametric estimation of percentiles. Conclusion: Reference values derived by retrospective
1 Research & Development and 2 Central Laboratory, Centro Diagnostico Italiano, Milan, Italy. 3 Lombardy Cancer Registry and Environmental Epidemiology, National Cancer Institute, Milan, Italy. 4 Department of Clinical Sciences Luigi Sacco, Universita` degli Studi di Milano, Milan, Italy. *Address correspondence to this author at: Dipartimento di Scienze Cliniche L. Sacco, Via G.B. Grassi 74, 20157 Milan, Italy. Fax 39-02-3564-018; e-mail
[email protected]. Received January 3, 2005; accepted April 22, 2005. Previously published online at DOI: 10.1373/clinchem.2005.047787
analysis of large samples of data obtained at a given institution are particularly suitable for the evaluation of results for the presenting patient population at that institution. © 2005 American Association for Clinical Chemistry
Despite progress in the conceptual aspects of reference values (1–7 ), in practice their use is still not entirely satisfactory (8, 9 ). There are two major reasons for this unsatisfactory situation. One factor is the metrologic uncertainty of measurements, particularly with regard to their trueness and method dependence. This uncertainty jeopardizes the transferability of reference values over time and between laboratories, despite proposed biological variation-derived analytical accuracy goals aimed at achieving acceptable transferability of both gaussian- (10 ) and nongaussian-distributed (11 ) reference values. Examples of multicentric reference values have also been reported (12, 13 ). The second difficulty involves comprehensively defining a reference population appropriately matching the specific patient(s) referred to the laboratory and extracting from such a population a numerically consistent sample group of individuals to be enrolled as “reference individuals”. The establishment of a suitable reference population is essential (14 ) but difficult (8 ), and there are still cases in which unrepresentative reference populations— medical students, hospital employees, blood donors or other volunteers, variably classified as “healthy”— have been used. Attempts have been made to overcome these difficulties by using hospital or primary healthcare patients and applying different criteria in the detection of outlying data values and the identification of nondiseased individuals (15–18 ). The definition of reference values consistent with the underlying patient population and with the analytical methodology has been considered for fulfillment of Inter-
1232
Clinical Chemistry 51, No. 7, 2005
national Organization for Standardization (ISO)5 accreditation requirements (19 ). Accurate definition of reference intervals is particularly important in laboratories, such as our diagnostic center, expecting to encounter a sizeable number of healthy individuals among the presenting patient population and/or a small deviation from normality of test results. This is the situation of our diagnostic center. We addressed this situation by developing an original approach, applicable to large databases, to select nondiseased individuals. Such individuals constitute the reference sample group for computing “internal” reference intervals, specific for the presenting patient population and for the analytical technology.
Participants and Methods participants The study was carried out at Centro Diagnostico Italiano (CDI) in Milan, the largest private Italian medical center for outpatient care. The CDI Central Laboratory was certified by Lloyds Register Certification under ISO 9002 in 1997. The overall quality at CDI is assessed periodically and certified by an independent organization. Approximately 15 000 000 records related to 197 350 individuals, stored in the laboratory information system (LIS) of CDI over a 3-year period (1997–1999), were retrieved to constitute the original database for this study (sample group 1). This sample group included 97 895 females and 99 455 males. For each test and for each sex, the number of available test results ranged from 3342 (IgA; females) to 120 256 [alanine aminotransferase (ALT); males], with the exception of folate, for which only 574 values (males) and 885 values (female) were available.
assay methods All assays were performed on serum samples obtained from blood collected in plain glass test tubes, clotted, and centrifuged within 2 h of collection; stored at 4 °C; and assayed within 4 h. Measurements were performed with accepted and widely used analytical methods, implemented on automated analyzers. The following instruments were used: AU2700 (Olympus); Architect (Abbott); and Immulite 2000 (Medical Systems). For each instrument, reagents and calibrators were from the same manufacturer; instrument operation and calibration followed the instructions from specific manufacturers.
current reference intervals The current reference intervals in use at CDI were derived mainly from manufacturer suggestions, in some cases modified according to literature data or practical experi-
5 Nonstandard abbreviations: ISO, International Organization for Standardization; CDI, Centro Diagnostico Italiano; LIS, laboratory information system; ALT, alanine aminotransferase; EQAS, external quality assessment scheme; GGT, ␥-glutamyltransferase; AST, aspartate aminotransferase; CRP, C-reactive protein; and PSA, prostate-specific antigen.
1233
ence. Neither the original population nor the statistical treatment of data were known in detail.
control of analytical quality Daily internal quality control and participation in external quality assessment schemes (EQAS) were carried out according to the specifications of our certified quality system. Briefly, internal quality control was performed by daily assay of commercial lyophilized sera at 2 or 3 concentrations of the different quantities. Results were evaluated immediately by multiple decision rules for acceptance/rejection of the daily analytical series and for the assessment of any possible drift. Monthly means and SDs were computed and plotted to evaluate performance and medium- and long-term stability of the analytical systems. Participation in EQAS included several programs, according to the different quantities, organized either from the public health authority (mandatory EQAS of the Regione Lombardia) or from scientific associations and from companies. Results were compared with expected values (generally consensus means or systemspecific participant means) to assess the maintenance of state-of-the-art analytical quality (trueness).
selection of nondiseased individuals As a first approach, we selected 23 basic tests representing quantities of primary medical interest (Table 1). Of the 197 350 individuals in the original sample group, 166 027 (78 955 females and 87 072 males) had had at least one of these basic tests performed once or more during the study period, and this group of 166 027 was our sample group 2. The first selection criterion for identifying nondiseased individuals was the absence of repeated performance of a given test on the same person over the 3-year observation period, independent of the number of tests performed on that occasion. The inclusion criterion was the presence of a single laboratory measurement per test, so that persons with repeated measurements for a given test would not contribute in any subsequent computation concerning that test. This approach assumed that persons with repeated testing had a higher chance of being diseased. At this stage, we applied the multivariate algorithm described below to select, for each of the 23 basic tests, a subgroup of individuals suitable for computing the relevant reference limits. In a preliminary procedure for this selection step, the algorithm looked for the occurrence of any statistically significant correlation between each quantity and all others, using a Spearman correlation matrix based on the first test for each quantity in the observation period. The Spearman nonparametric linear correlation coefficient was used because some test results displayed a nongaussian distribution. Two quantities were considered correlated if the Spearman correlation coefficient was statistically significant (P ⬍0.001). We then used the algorithm to scrutinize each test result for each person, examining all correlated test results obtained for that person on the
1234
Grossi et al.: Formulation of Reference Intervals from Current Data
same occasion. If all correlated test results available fell within the current reference intervals, then the test result under scrutiny was considered eligible as a reference value. For example, suppose that ␥-glutamyltransferase (GGT) in males was shown to significantly correlate to conjugated bilirubin, ALT, and aspartate aminotransferase (AST); any single value of GGT was included in the set of the reference values for GGT only if the total bilirubin, ALT, and AST values measured in the same blood sample from the same person fell within the appropriate current reference intervals. Conversely, if 1 of the values of the 3 correlated quantities was not normal, then the GGT value was not included in the set of values selected for the production of the new reference interval. As another example, to stress the role of correlated tests in the algorithm, suppose on the contrary that a person had a abnormally high GGT but total bilirubin, ALT, and AST were all within the current reference intervals. In this case, the bad GGT value was retained for computation of a new reference interval, but the good bilirubin, ALT, and AST values would be omitted from reference interval computations. This event actually occurred in our data. The algorithm is described in Table 1 of the Data Supplement that accompanies the online version of this article at http://www.clinchem.org/content/vol51/issue7/. The rationale of this approach is based on the fact that there are clusters of tests that, because they explore the same body function/system, are expected to have correlated results and usually are requested by the physician to be performed together in a given test subject. It is therefore very unusual to find a single quantity without its companion test quantities; thus, it is possible to build up a cross-validation scheme relevant to the vast majority of individuals. When this approach is used, the contribution of test subjects with a high number of test results belonging to an appropriate set is maximized. In the unusual case that the set of test results available at the same date for a given individual was such that no significant correlation was possible (e.g., low number of analytes or unusual combination of tests), these results would be classified according to the current reference intervals only. The algorithm was applied separately for each sex, eventually leading to the operative definition of the reference sample groups for each basic test. The number of useful results in each sample group was variable, and these results are displayed in the second column of Table 1. The new reference limits for the ith test of the set of 23 basic tests were defined as 2.5%–97.5% nonparametric percentiles of the distribution in the sample group for that specific test, computed by the nonparametric rank-based method (6 ). Alternatively, we chose to define only the upper or the lower reference limit when the expected variations of the quantity were only (or mainly) in one direction (increase or decrease), thereby generating a
markedly skewed distribution on the relevant side of the frequency histogram. In these cases, the 95% or 5% nonparametric percentile was chosen as the upper or lower limit, respectively. For these quantities (e.g., the 2 aminotransferases), the accurate definition of the alternative limit has no medical relevance. The current reference limit, either lower or upper, was therefore maintained. The next step was the selection of the persons who had a single occasion of laboratory measurement for any of the 23 basic tests during the 3-year period. The number of persons satisfying this criterion was 93 649 (41 576 females and 52 073 males), and this group constituted our sample group 3. The application of the described multistep selection procedure to the 23 basic tests led to the definition of a sample group (sample group 4; n ⫽ 61 246) for whom the available results for the 23 basic tests all fell within the newly defined reference limits, that is, were nondiseased according to these multiple criteria. The availability of measurement results of additional quantities in this sample group allowed reference intervals to be defined for 13 additional quantities (Table 2).
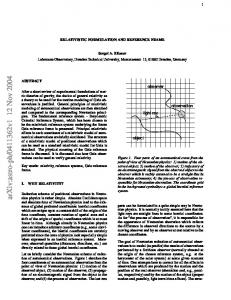
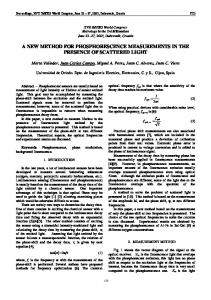
Results The Spearman correlation matrices for the 23 basic tests are shown in Table 2a (females) and Table 2b (males) of the online Data Supplement. The flow chart of the described multistep selection procedure is shown in Fig. 1. As shown, the stepwise application of different exclusion/inclusion criteria progressively restricted the initial sample group of 197 350 persons to a final sample group (sample group 4) of 61 246 nondiseased individuals (29 080 females and 32 166 males). Reduction in sample size was accompanied by narrowing of the reference interval, with particular lowering of the upper limit for those quantities characterized by prevailing increase in disease. A few examples of the effect of the algorithm in reducing reference intervals included ferritin in females (from 4.0 – 478 to 8.0 –257 g/L), glucose in females ⬍48 years (from 4.44 –9.82 to 4.05–5.88 mmol/L), C-reactive protein (CRP) in males (from 0 – 69 to 0 –35 mg/L), and prostate-specific antigen (PSA) in males ⬎45 years (from 0 – 8.9 to 0 –3.7 g/L). The frequency distribution by age and sex of individuals in sample group 4 is shown in Fig. 2. The descriptive statistics of the 36 quantities measured in the individuals (females and males) belonging to this sample group are shown in Tables 3 and 4 of the online Data Supplement. The median number of tests per person in sample group 4 was 5 for both males and females and for sample group 1 was 5 for males and 6 for females. New and current reference limits for females and males are compared in Tables 1 (23 basic tests) and 2 (13 additional quantities). For some quantities, age had a marked effect on values; we therefore computed the reference intervals for specified age groups for glucose (⬍48 years and ⬎48 years), alkaline phosphatase (⬎16
Clinical Chemistry 51, No. 7, 2005
1235
Fig. 1. Flow chart of the multistep inclusion/exclusion procedure.
Fig. 2. Distribution by age classes and sex of the 61 246 individuals (29 080 females and 32 166 males) in sample group 4.
years), creatinine (⬎11 years), PSA (⬎45 years), and transferrin (females ⬎50 years and males ⬎30 years). For 23 tests, the new reference intervals were narrower than or similar to the current reference intervals, whereas for the remaining 13 tests, the intervals were wider. Among the latter, ferritin, iron, transferrin saturation, LDL and total cholesterol, triglycerides, glucose ⬎48 years, GGT, CRP, PSA, amylase, and creatine kinase showed moderate to marked shifts of the upper limit. Total cholesterol and LDL-cholesterol had widened reference intervals because of the remarkable increase of the upper limit for both men and women; triglycerides had a lower upper limit only in women. Concerning the lipid quantities, however, variations in the upper refer-
1236
Grossi et al.: Formulation of Reference Intervals from Current Data
Table 1. New reference intervals for 23 basic tests, compared with the current intervals.a Reference intervals Quantity
Sample size, F/M
ALT Current Newb Albumin Current New Alkaline phosphatase (⬎16 years) Current Newb AST Current Newb Cholesterol Current New Cholinesterase Current New Conjugated bilirubin Current New CRP Current New Creatinine (⬎11 years) Current New Ferritin Current New GGT Current Newb Glucose (⬎8 years) Current New Glucose (14–48 years) Current New
39 069/49 146
16 949/15 678
16 645/15 147
37 518/45 329
30 624/29 739
4218/3591
Units
Females
Males
1–36 1–30
1–43 1–49
37.0–55.0 40.2–54.5
37.0–55.0 43.0–56.0
65–306 65–284
80–306 80–271
1–31.0 1–26.0
1–35.0 1–30.1
3.24–5.18 3.44–6.94
3.24–5.18 3.29–6.73
U/L
g/L
U/L
U/L
mmol/L
U/L 4650–13 950 5150–13 392
12 382/12 365
9959/7058
32 377/42 933
mol/L 0.17–5.13 0.68–4.61
0.17–5.13 0.86–4.96
0–5 0–19
0–5 0–35
mg/L
mol/L 53.0–92.8 55.7–91.3
2468/1984
26 209/34 623
12 578/12 743
20 806/25 749
ence limits reflect the comparison of the true reference values (new limits) with desirable values (current limits).
Discussion Several attempts to use data from a hospitalized population to produce reference values have been reported in the literature. Such data sets are purified from values belonging to diseased patients by the application of clinical and/or statistical inclusion/exclusion criteria. The pros and cons of these approaches have been discussed (20 ): one of the main drawbacks is that these data sets include large numbers of abnormal results from hospitalized patients. Large databases stored in laboratory medicine centers
4650–13 950 6622–13 927
66.3–110 70.7–110
g/L 14–233 8–257
19–294 18–512
1–43 1–34
1–59 1–54
3.33–6.71 4.38–7.77
3.33–6.71 4.49–9.21
3.33–3.38 4.05–5.88
3.33–6.38 4.27–6.21
U/L
mmol/L
mmol/L
offer opportunities for producing internal reference intervals. Because a consistent proportion of symptom-free well individuals present to our center for health assessment, we developed a method to use the large pool of data generated in our center to estimate reference intervals, based on rules designed to progressively exclude nonhealthy individuals, according to the a posteriori approach (3 ). The exclusion rule of more than one access per test to the laboratory during the data collection period has been applied in previous studies (15, 16 ), and its rationale has been explained in the Participants and Methods section. The rationale for the next exclusion rule (any abnormality in tests previously shown to be significantly correlated to the
1237
Clinical Chemistry 51, No. 7, 2005
Table 1. Continued Reference intervals Quantity
HDL-cholesterol Current Newc Iron Current New LDL-cholesterol Current New PSA (males ⬎45 years) Current Newb Thyrotropin Current New Total bilirubin Current New Total protein Current New Transferrin (females ⬎50 years; males ⬎30 years) Current New Transferrin saturation Current New Triglycerides Current Newb Unconjugated bilirubin Current New
Sample size, F/M
24 049/23 746
20 026/9772
Units
Females
Males
0.90 1.06
0.90 0.85
mmol/L
mol/L 6.62–26.3 6.08–28.5
22 962/22 650
10.6–28.3 7.70–29.0
mmol/L 3.37 4.89
3.37 4.86
g/L
11 554
0–4.00 0–3.70 15 470/6695
nIU/L 0.35–4.94 0.28–4.45
20 549/18 968
23 831/24 035
5250/2131
0.35–4.94 0.23–4.08
mol/L 1.71–22.2 4.1–19.3
1.71–22.2 4.79–22.1
65.0–85.0 65.6–83.5
65.0–85.0 65.8–84.0
2.0–3.7 2.0–3.9
2.0–3.7 1.9–3.4
15–50 8.0–47
20–50 11–50
0.45–1.92 0.45–1.60
0.45–1.92 0.45–2.02
0–20.5 3.42–13.8
0–20.5 3.93–15.0
g/L
g/L
4997/2012
%
28 724/27 867
12 369/12 368
mmol/L
mol/L
a Unless otherwise specified, the new intervals are the 95% central nonparametric portion of the reference distribution. The intervals for glucose were computed for 2 separated age groups. b Upper limit is the 95% nonparametric percentile. c Lower limit is the 5% nonparametric percentile.
test under scrutiny) has also been briefly outlined: it is based on the observation that multiple test abnormalities are more likely to be significant than single test abnormalities (21 ). Application of this rule excluded approximately one-third of the individuals who satisfied the previous inclusion/exclusion criteria. It is possible that persons actually free of disease were excluded on the basis of weak correlations among many quantities because of significant correlation attributable to the large sample size. However, this event is preferable to the opposite error: the inclusion of diseased persons, potentially causing a shift in the reference limits. The number of tests performed for most individuals was between 4 and 8: in the latter case, the chance of having one or more abnormal test results increases to 34% (21 ). A similar but less sophisticated approach was followed in the definition of
reference values for 5 serum enzymes measured by reference procedures (17 ). By applying this selection cascade, we eventually reduced the 197 350 individuals in the original sample to 61 246 individuals, a large sample group of individuals closely matching the typical person presenting to our center for testing. Thus, the reference limits for many quantities were calculated on sample sizes of several thousands of test results. Inclusion/exclusion of individuals in our study was based on laboratory data only. This limitation was balanced by the large amount of available data, which allowed the production of sex-specific reference intervals. Comparison of the whole reference group with the subgroup of individuals from occupational and preventive medicine programs at our center (data not shown) did not
1238
Grossi et al.: Formulation of Reference Intervals from Current Data
Table 2. New reference intervals for 13 additional quantities, compared with the current intervals.a Reference intervals Quantity
Sample size, F/M
␣-Amylase Current Newb Calcium Current New Chloride Current New Creatine kinase Current Newb Folate Current New IgA Current New IgG Current New IgM Current New Lactate dehydrogenase Current Newb Potassium Current New Sodium Current New Urate Current New Urea Current New
622/422
a b
Units
Females
1–225 1–250 1661/6338
2389/1504
1072/1202
98/41
339/263
339/263
339/263
632/431
3876/2824
3293/2527
5789/6620
12 033/10 640
Males
U/L 1–225 1–259
mmol/L 2.14–2.62 2.16–2.59
2.14–2.62 2.20–2.60
98.0–109 98.4–109
98.0–109 98.1–108
35–143 35–147
33–194 33–234
6.81–38.6 5.90–32.7
6.81–38.6 7.26–25.6
0.90–4.50 0.66–4.79
0.90–4.50 0.70–5.50
8.00–18.0 7.09–17.8
8.00–18.0 6.51–17.8
0.60–2.80 0.37–3.65
0.60–2.80 0.27–2.22
94–460 94–422
94–460 94–425
3.60–5.00 3.80–5.13
3.60–5.00 3.88–5.19
135–146 136–144
135–146 136–144
0.14–0.34 0.14–0.36
0.20–0.42 0.21–0.45
2.50–8.32 2.83–8.76
3.33–6.38 3.75–9.09
mmol/L
U/L
nmol/L
g/L
g/L
g/L
U/L
mmol/L
mmol/L
mmol/L
mmol/L
Unless otherwise specified, the new intervals are the 95% central nonparametric portion of the reference distribution. Upper limit is the 95% nonparametric percentile.
reveal substantial differences, thereby confirming that the multivariate algorithm was of adequate power to identify nonhealthy individuals. The small differences sometimes observed were likely related to the fact that these observations came from a smaller sample with a younger mean age and higher employment rate. The so-called healthy worker effect (the tendency for actively employed people to have a more favorable mortality expectancy than the general population) (22 ) may have influenced the comparison between the overall group and the persons referred for initial or periodic health assessment. As recommended (6 ), the reference intervals were taken
as the 95% central nonparametric portion of the reference distribution. For some specific quantities, exceptions to this rule have been applied and explained. Use of the 99.8% central portion, particularly when the aim of testing is the identification of wellness, was suggested recently (23 ). However, a reference interval for the absence of disease would require “absolutely normal” reference subjects (23 ), with criteria including genetic normality as determined by assessment. With the main exception of folate, in our study the sample size for each quantity was large enough to allow safe application of the usual rank-based technique for percentile estimation (6, 24 –26 ).
Clinical Chemistry 51, No. 7, 2005
At the CDI laboratory, the analytical methods were carefully chosen and monitored to guarantee state-of-theart reliability of results. Nevertheless, it must be stressed that in principle our reference values are valid only for the stated analytical procedures/systems. The transferability of such reference values to other laboratories would imply the absence of any significant between-laboratory analytical bias (27 ), which is a prerequisite for the production and use of common reference intervals (28, 29 ). The large number of reference individuals selected with our procedure, of both sexes and spanning a large interval of age (Fig. 2), permitted their separation into subgroups according to sex and age. In the present study we report sex-specific intervals for all quantities and age-related reference intervals for only a few quantities for which the patient’s age has a major impact on the computed interval and on medical interpretation. However, the reference values for most quantities appeared to be influenced by age, confirming the medical utility of age-related reference intervals (30 ), which will be considered in a future study. Criteria for partitioning both gaussian-distributed (31 ) and nongaussian-distributed (32 ) reference values into subgroups have been suggested. In conclusion, we have developed a new procedure for producing reference values by retrospective analysis of large samples of data collected over a period of 3 years in our laboratory. This study highlights the possibility of formulating internal reference values for a given institution based on the population it serves. These reference values are particularly suitable for evaluating the results of patient presenting to that institution. The only requisites are access to a sufficient amount of data in the LIS and the support of a biostatistician.
8.
9. 10.
11.
12.
13.
14. 15.
16.
17.
18.
19.
References 1. Grasbeck R. The evolution of the reference value concept. Clin Chem Lab Med 2004;42:692–7. 2. Solberg HE. Approved recommendation (1986) on the theory of reference values. Part 1. The concept of reference intervals. J Clin Chem Clin Biochem 1987;25:337– 42. 3. PetitClerc C, Solberg HE. Approved recommendation (1987) on the theory of reference values. Part 2. Selection of individuals for the production of reference values. J Clin Chem Clin Biochem 1987;25:639 – 44. 4. Solberg HE, PetitClerc C. Approved recommendation (1988) on the theory of reference values. Part 3. Preparation of individuals and collection of specimens for the production of reference values. J Clin Chem Clin Biochem 1988;26:593– 8. 5. Solberg HE, Stamm D. Approved recommendation on the theory of reference values. Part 4. Control of analytical variation in the production, transfer and application of reference values. Eur J Clin Chem Clin Biochem 1991;29:531–5. 6. Solberg HE. Approved recommendation (1987) on the theory of reference values. Part 5. Statistical treatment of collected reference values. Determination of reference limits. J Clin Chem Clin Biochem 1987;25:645–56. 7. Dybkaer R, Solberg HE. Approved recommendation (1987) on the
20. 21. 22.
23.
24.
25.
26.
27.
1239
theory of reference values. Part 6. Presentation of observed values related to reference values. J Clin Chem Clin Biochem 1987;25:657– 62. Henny J, Petitclerc C, Fuentes-Arderiu X, Hyltoft Petersen P, Queralto JM, Schiele F, et al. Need for revisiting the concept of reference values. Clin Chem Lab Med 2000;38:589 –95. Horn PS, Pesce AJ. Reference intervals: an update. Clin Chim Acta 2003;334:5–23. Gowans EMS, Hyltoft Petersen P, Blaabjerg O, Horder M. Analytical goals for the acceptance of common reference intervals for laboratories throughout a geographical area. Scand J Clin Lab Invest 1988;48:757– 64. Hyltoft Petersen P, Gowans EMS, Blaabjerg O, Horder M. Analytical goals for the estimation of non-gaussian reference intervals. Scand J Clin Lab Invest 1989;49:727–37. Back S-E, Nilsson J-E, Fex G, Jeppson JO, Rosen U, Tryding N, et al. Towards common reference intervals in clinical chemistry. An attempt at harmonization between three hospital laboratories in Skane, Sweden. Clin Chem Lab Med 1999;37:573–92. Fuentes-Arderiu X, Ferre´-Masferrer M, Gonza`les-Alba JM, Escola`Aliberas J, Balsells-Rosello D, Blanco-Cristobal C, et al. Multicentric reference values for some quantities measured with TinaQuant® reagents systems and RD/Hitachi analysers. Scand J Clin Lab Invest 2001;61:273– 6. Ritchie RF, Palomaki G. Selecting clinically relevant populations for reference intervals. Clin Chem Lab Med 2004;42:702–9. Kallner A, Gustavsson E, Hending E. Can age and sex related reference intervals be derived for non-healthy and non-diseased individuals from results of measurements in primary health care? Clin Chem Lab Med 2000;38:633–54. Brinkworth RSA, Whitham E, Nazeran H. Establishment of paediatric biochemical reference intervals. Ann Clin Biochem 2004;41: 321–9. Schumann G, Klauke R. New IFCC reference procedure for the determination of catalytic activity concentrations of five enzymes in serum: preliminary upper reference limits obtained in hospitalized subjects. Clin Chim Acta 2003;327:69 –79. Horn PS, Feng L, Li Y, Pesce AJ. Effect of outliers and nonhealthy individuals on reference interval estimation. Clin Chem 2001;47: 2137– 45. ISO. Medical laboratories—particular requirements for quality and competence. ISO 15189. Geneva: ISO, 2003. Solberg HE. Using a hospitalized population to establish reference intervals: pros and cons [Editorial]. Clin Chem 1994;40:2205– 6. Solberg HE. Multivariate reference regions. Scand J Clin Lab Invest 1995;55(Suppl 222):3–5. McMichale AJ. Assigning handicaps in the mortality stakes: an evaluation of the “healthy worker effect”. Report to the Worker’s Compensation Board on the Healthy Worker Effect. IDPS Report No. 3. Toronto, Canada: Industrial Disease Standard Panel, 1988:58. Jorgensen LGM, Brandslund I, Hyltoft Petersen P. Should we maintain the 95 percent reference intervals in the era of wellness testing ? A concept paper. Clin Chem Lab Med 2004;42:747–51. Horn PS, Pesce AJ, Copeland BE. Reference interval computation using robust vs parametric and nonparametric analyses. Clin Chem 1999;45:2284 –5. Linnet K. Nonparametric estimation of reference intervals by simple and bootstrap-based procedures. Clin Chem 2000;46: 867–9. Koduah M, Iles TC, Nix BJ. Centile charts I: new method of assessment for univariate reference intervals. Clin Chem 2004; 50:901– 6. Thienpont LM, Van Uytfanghe K, Rodriguez Cabaleiro D. Metrological traceability of calibration in the estimation and use of
1240
Grossi et al.: Formulation of Reference Intervals from Current Data
common medical decision-making criteria. Clin Chem Lab Med 2004;42:842–50. 28. Rustad P, Felding P, Franzson L, Kairisto V, Lahti A, Martensson A, et al. The Nordic reference interval project 2000: recommended reference intervals for 25 common biochemical properties. Scand J Clin Lab Invest 2004;64:271– 84. 29. Hyltoft Petersen P, Rustad P. Prerequisites for establishing common reference intervals. Scand J Clin Lab Invest 2004;64:285– 92.
30. Faulkner WR, Demers LM. Importance of age-dependent reference values in biochemical testing: are we including the elderly population? [Editorial]. Clin Chem 1994;40:855– 6. 31. Lahti A, Hyltoft Petersen P, Boyd JC, Fraser CG, Jorgensen N. Objective criteria for partitioning gaussian-distributed reference values into subgroups. Clin Chem 2002;48:338 –52. 32. Lahti A, Hyltoft Petersen P, Boyd JC, Rustad P, Laake P, Solberg HE. Partitioning of nongaussian-distributed biochemical reference data into subgroups. Clin Chem 2004;50:891–900.