th
The 14 World Conference on Earthquake Engineering October 12-17, 2008, Beijing, China
A NEW PROPOSAL FOR SITE CLASSIFICATION BASED ON AMBIENT VIBRATION MEASUREMENTS AND THE KIKNET STRONG MOTION DATA SET H. Cadet1, P.-Y. Bard2 and A.-M. Duval3 1
Post-doctoral research fellow, Instituto Geografic de Catalunya, Barcelona, Spain 2 Researcher, LGIT/LCPC, Joseph Fourier University, Grenoble, France 2 Research Director, CETE Méditerranée, Nice, France Emails:
[email protected],
[email protected],
[email protected] ABSTRACT : The goal of the present paper is to propose an alternative site classification and the associated spectral shapes, that could be easily used in building codes and microzonation studies. The site classification is based on a twoparameter characterization, consisting of the average shear wave velocity, VSz, over the top z meters (z between 5 and 30), and the site fundamental frequency f0. Both parameters are easily available from non-invasive survey techniques (ambient vibrations, MASW, SASW). A comprehensive analysis on about 500 sites from the KIKNET network, shows that f0 is very poorly correlated with any of the VSz values, thus providing independent, complementary information on the overall thickness and stiffness of sedimentary cover, and the surface stiffness. The corresponding site amplification factors are derived empirically from the average surface / downhole (SDSR) spectral ratios, with a correction procedure to normalize the raw SDSR to a standard reference (with VS30 = 800 m/s) located at surface. Finally, the correlation between site parameters and site amplification factors is achieved by normalizing the frequency axis with respect to f0, and a least-square fit of the amplitude with VSz. The largest variance reduction is obtained for the couple (VS30, f0), while a very simple site classification based only on f0 leads to satisfactory misfit values. KEYWORDS: Site classification, amplification factor, Kiknet data, fundamental frequency, average velocity
1. INTRODUCTION Over the last decade, the site classifications used in earthquake regulations has been increasingly based on the use of the Vs30 parameter, following the works of Borcherdt (1994) and colleagues in the early nineties. However, many seismologists and engineers (e.g., Mucciarelli and Gallipoli, 2006; Castellaro et al., 2008) have expressed some reluctancy since this single parameter does not capture the physics of 1D site amplification, even in the simple 1D case: the amplification characteristics should indeed be related both to the impedance contrast between the shallow soil and the underlying bedrock, (and also to the damping characteristics), and to the thickness of the surface layers. As a consequence, the single parameter Vs30 can only be considered as a proxy to such parameters, and the correlation to the actual amplification characteristics should therefore be at least adjusted regionally to correspond to the local geology. This adaptation work is nevertheless only rarely performed, mainly because of lack of reliable data (either of strong motion recordings, or, most often, lack of geotechnical information on recording sites). The simplicity of this site classification, its satisfactory performance on the original available data, together with the relative cheapness of the background site survey (SPT down to 100 feet which could be performed within one day), made it very popular and led to its spreading in many earthquake regulations throughout the world, since no alternative could be proposed combining cost effectiveness, simplicity, and physical relevance. We tried to address that challenge and the purpose of the present paper is to report the results of a series of scientific investigations aiming at an alternative new, two-parameter site categorization with the corresponding spectral amplification factors. The first section shortly describes the investigated site parameterization, based on the average shear wave velocity over the top z meters, VSz, (with z between 5 and 30), and the site fundamental frequency f0. From a statistical analysis on about 500 KIKNET sites, the two parameters are shown to be complementary and to provide independent information on the overall impedance contrast or shallow soil softness (VSz), and the
th
The 14 World Conference on Earthquake Engineering October 12-17, 2008, Beijing, China overall thickness of the surface layers responsible for the amplification (f0). Most importantly, both parameters may be derived in a robust and inexpensive way from single point ambient noise measurements (H/V processing), and array microtremor processing or SASW/MASW techniques. The next section presents the derivation of site amplification factors, on the basis of a comprehensive analysis of a large accelerometric data set from the Japanese KIK-net strong motion network. The site amplification factors are derived empirically from the average surface / downhole (SDSR) spectral ratios: considering the wide scatter in the S-wave velocities and depths of down-hole sites (300 – 3300 m/s, 8 – 900 m), a correcting procedure has been established to normalize the raw SDSR to a standard reference (with VS30 = 800 m/s) and to remove spurious high frequency amplification associated with the location of reference sites at depth, not recording free surface effect for all frequencies. Finally, the last section deals with the correlation between the normalized site amplification factors and the new site parameters. Different parameter combinations are tested (VSz only, f0 only, f0 and VSz). The largest variance reduction is obtained for the couple (VS30, f0), which provides significantly smaller standard deviations than VS30 alone. Interestingly enough, a very simple site classification based only on f0 leads to standard deviations similar to those obtained with VS30 alone. Simple equations describing the site amplification factor as a function of these 2 parameters are provided, that can be very simply used for building codes and/or microzonation studies. 2. CHOICE OF SITE PARAMETERS AND CORRESPONDING DATASET DISTRIBUTION 2.1. Site parameters Over the last decade, site survey techniques have seen important evolutions with the development of noninvasive techniques based on surface wave, which may be divided in two main families: the first one uses active sources with linear arrays, while the second one is based on “passive” recordings of ambient vibrations with 2D surface arrays. These techniques provide the velocity of surface waves (usually Rayleigh waves) in a limited frequency range, from which one may invert the velocity profile down to a limited depth. The value of this maximum depth depends on the array aperture and on the type of sources. Active techniques are limited to shallow depths (generally less than 20 m), especially in urban areas, because of source energy limitations. Passive techniques allow to reach larger depths, but require a more cautious processing (Cornou et al., 2006; Ohrnberger et al., 2004, 2005, Asten et al., 2004; Asten and Boore, 2005; Wathelet et al., 2004, 2005; Bard et al., 2007). From another viewpoint, single point microtremor measurements with 3C sensors allow most often to recover the site fundamental frequency f0. The conditions to fulfill to retrieve such information have been the focus of many previous investigations, especially within the framework of the SESAME European project, the conclusions of which may be found in Bard et al., 2004, 2007; Guillier et al., 2008, Chatelain et al., 2008 and Haghshenas et al., 2008. As a consequence, keeping in mind that, for a site classification to be successful, the background site surveys need to be simple, we decided to test alternative site classifications based on easily accessible parameters, i.e., f0 and VSZ, where the latter parameter is the average shear wave velocity over the “z” top meters. Given the depth limitation of SASW and MASW techniques, we deliberately considered depths as shallow as 5 and 10 meters, but also considered deeper depths such 20 and 30 meters in order to compare with the “classical” VS30 classification . As for VS30, VSZ is obtained through an arithmetic averaging of the travel times over the various layers present in the top z meters. 2.2. Site parameter distribution for the used dataset For this study, we used data from the KIKNET strong motion network (http://www.kik.bosai.go.jp), which consists in more than 600 sites equipped with two 3-component accelerometric sensors, one located at depth within a borehole, and the second one at the surface. One of the key interests of this network is that the S- and P-wave velocity profiles have been systematically derived from downhole measurements for each site. One must keep in mind however that the downhole sensor is not located at the same depth at each site: the overall depth variation in our data set ranges from 7 m to 1575 m, with a geometrical average value of 101 m. In this study, we used the same selected data subset as Pousse et al., 2005, corresponding to a total of 538 sites having recordings in the period 1998-2004 from crustal earthquakes with JMA magnitudes larger than 4 and hypocentral depth smaller than 25 km. For all these sites, the average S-wave velocities VSz could be very
th
The 14 World Conference on Earthquake Engineering October 12-17, 2008, Beijing, China simply derived from the S-wave velocity profile. We checked however that these values were consistent with the actual recordings (Cadet, 2007): we considered only sites for which the “theoretical” 1D fundamental frequency computed from the known shear wave velocity profile (i.e., between downhole sensor depth and surface) was within ± 20% of the observed value, as derived from the surface / downhole spectral ratios. 43 sites did not pass that check, so that we finally kept a total of 495 sites. Then, we estimated the fundamental frequency at each of these 495 sites from the H/V spectral ratio on strong motion recordings. The corresponding values are consistent with the observed surface / downhole spectral ratios for 441 out of the 495 sites: the borehole is not deep enough for the remaining 54 sites, and the downhole sensor is still above the deepest interface velocity contrast controlling the fundamental frequency.
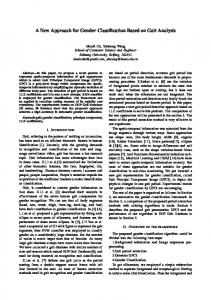
Figure 1: Distribution of the used KIK-NET dataset in the three planes (VS5, f0), (VS10, f0) and (VS30, f0). Figure 1 maps the distribution of these 495 sites in three different (f0, VSz) planes, with z = 5, 10 and 30 m. It illustrates the lack of correlation between f0 and shallow velocity (correlation coefficient of 0.07 and 0.15, for z = 5 and 10 m, respectively), and the very poor correlation for intermediate depth (0.29 and 0.27 for z = 20 m not shown- and 30 m, respectively). This result does confirm the theoretical expectation already mentioned in the introduction, according which the shallow velocity should NOT, in general, be related with the low frequency amplification or the amplification bandwidth, which is also strongly affected by the overall sediment thickness, which may be well beyond several tens of meters. The slight, relative increase of the correlation coefficient for VS20 and VS30 may be viewed as an indicator that these values could be seen as some (poor) proxies for the low frequency amplification. 3. DERIVING AND NORMALIZING AMPLIFICATION FACTORS 3.1. Derivation of amplification factors For the finally selected 495 sites, we then used the available strong motion recording pairs (surface and downhole) to derive the actual, empirical site amplification factor. The distribution of the corresponding 4705 recording pairs according to distance, pga and magnitude is displayed in Figure 2, while the latter is detailed in Table 1. It shows that the vast majority of recordings correspond to only moderate shaking levels: less than 3% have a pga larger than 100 cm/s2, which means that the amplification factors considered here correspond mainly to linear response. Table 1 : Distribution of used KIKNET recordings according to magnitude and pga PGA[gal]=> 300 Magnitude > 6.5 4 58 146 218 152 48 9 5.5-6.5 12 72 260 199 101 24 2 4.5-5.5 13 144 410 303 112 26 1 < 4.5 59 520 1074 545 168 22 3 Total 88 794 1890 1265 533 120 15
Total 635 670 1009 2391 4705
th
The 14 World Conference on Earthquake Engineering October 12-17, 2008, Beijing, China
Figure 2 : Distribution of used KIKNET recordings as to distance-magnitude (left) and pga-magnitude (right) The surface / downhole amplification factors AMPF(Si/Ri) were computed both for the Fourier spectra and the response spectra. For each site and each event simultaneously recorded at surface and downhole sensors, the acceleration response spectra were computed on the whole record for a 5% damping ratio, and the surface / downhole ratio computed for each component. Then, the average response spectrum amplification was derived by taking the geometrical average of the single ratios for each horizontal component and each pair of recording at the same site. A similar procedure was applied for the Fourier spectral ratios, with some differences however. The Fourier spectra were not computed on the whole record, but on a manually selected window: for each recording, the begin time and length of the window was the same at the surface and downhole sensors, starting from the P wave arrival and ending in the coda of S waves. Also, the spectral ratios were considered only for frequencies with good signal to noise ratio, i.e., larger than 3 (the noise spectra were computed as much as possible on the pre-event windows). Finally, before deriving the spectral ratios (signal / noise, and surface / downhole as well) the Fourier spectra were also smoothed with a Konno-Ohmachi (1998) smoothing window with a b-value of 20. The Fourier and response spectra amplification factors were compared to each other, as detailed in Cadet (2007) and summarized in Figure 3. They prove to be comparable, statistically speaking , in the intermediate frequency range , while Fourier spectral ratio is generally lower than the response spectra ratio at very low (f 15 Hz) frequencies: this comes from the peculiar properties of response spectra in these frequency bands, where the level is controlled by the peak displacements and accelerations, respectively, which may be associated to other frequency bands. In the following, the correlation between site parameters and amplification factors were thus based on response spectral ratios, because of the preferred use in earthquake engineering. For some sites, the resulting average surface/downhole amplification factor was based on many recordings, for some other, only on a few. The distribution of available number of recording per site is summarized in Table 2, which shows that a little less than one half of the estimated amplification factors is based on less than 5 recordings. In the following statistical analysis, the sites with more than 5 recordings were thus assigned a double weight.
Figure 3: average ratio between Fourier transfer functions and response spectra amplification factors. Table 2 : Number of available KIKNET recordings per site Number of available recordings 1 2 3-5 6-10 11-20 Number of sites 70 53 107 132 90
> 21 43
th
The 14 World Conference on Earthquake Engineering October 12-17, 2008, Beijing, China 3.2. Normalization of surface/downhole amplification factors The final goal of the study is to correlate site parameters with amplification factors, keeping in mind that the standard definition of amplification factors refers to a “standard” surface reference rock site. It is generally accepted that the standard reference rock site corresponds to VS30=800 m/s. The raw bore-hole amplification factors AMPF(Si/Ri) derived in section 3.1 represent two main deviations with respect to this usual definition: firstly the reference is not located at the surface but at some varying depth, secondly the down-hole velocity varies significantly from one site to another. As displayed in Figure 4a, for the considered Kik-net data set, the borehole depth zDH,i varies from 7 to 900 meters, while the down-hole velocity (VSDH,i) varies from 300 m/s to 3300 m/s. These two deviations result in two kinds of biases in the estimated amplification function, which both need to be corrected. The location of the reference sensor at depth zDH results in an overestimation of the amplification factor at high frequency, i.e. beyond the first destructive interference frequency at down-hole depth, fzDH,i, which may be estimated as VSzDH,i / 4 zDH,i, where VSzDH,i is the average velocity between surface and down-hole depth zDH,i. This is illustrated on Figure 4b, where the apparent surface / donwhole amplification factors are computed, for an identical velocity profile, for different reference depths. After different trials, the correcting procedure was chosen to be targeted only at reproducing the free-surface effect generally corresponding to a factor 2: a corrective factor C(f/fzDH,i) equal to 1 for f > fzDH,i . This correction was checked and proved satisfactory for the few sites where it was possible to compare surface/downhole and surface/surface ratios. More details can be found in Cadet (2007). The final overall effect of this “depth correction” leading to a corrected amplification factor AMPF_COR(Si/Ri) is to decrease the high frequency part of the raw amplification factors by a factor 2. The second bias is related with the large variability of the mechanical impedance (proportional to S-wave velocity) at depth, resulting in a non-homogeneous, site-dependent reference Ri characterized by its depth zDH,i and its velocity VSDH,i. The aim is to apply a normalization procedure allowing to estimate the “absolute” amplification of each site Si with respect to a common reference R0. Detailing the applied “impedance normalization” would be much too long, and we will limit ourselves to the presentation of its principle. The first step is to move the reference Ri to a temporary reference D with large depth and large velocity, considered to be the same for all 495 sites. Based on the previous work by Boore and Joyner (1997) and Boore (2003) on “generic rock profiles”, this common reference was chosen as a site located at 8 km depth with a velocity of 3.6 km/s. Then, this deep reference was moved to a surface, standard reference R0 characterized by VS30 = 800 m/s. AMPF_NORM(Si/R0) = AMPF_COR(Si/Ri) * TF (Ri/D) / TF (R0/D) The corresponding intermediate transfer function TF(Ri/D) and TF(R0/D) were estimated with both the quarterwavelength method (Boore, 2003) and 1D response under incident S waves taking into account the generic rock profiles joining sites D and Ri, and D and R0, respectively. More details can be found in Cadet (2007).
160m 320m
10m
40m 80m
20m
f1st interference Figure 4: Phenomena considered in the normalization procedure of amplification factors: (a, left) variability of S-wave velocity value and depth at the downhole sensor depth (compared with the “generic” S-wave rock
th
The 14 World Conference on Earthquake Engineering October 12-17, 2008, Beijing, China velocity profile corresponding to VS30 = 300 m/s), and (b, right) illustration of the “destructive interference” effect depending on downhole sensor depth: the curves correspond to the surface/downhole apparent amplification factor, for the same velocity profile and different depths from 10 m to 320 m. 4. CORRELATION WITH SITE PARAMETERS The final step is then to correlate these normalized amplification factors AMPF_NORMi(f) with the site parameters VSz,i and f0,i (i=1, 495). This correlation has been performed in two steps: i) the 495 normalized amplification functions AMPF_NORMi(f) are first expressed as a function of dimensionless frequency f/f0i. The underlying idea is that, when f f0i. this step is illustrated in Figure 5. It results in new, “shifted” amplification functions Ai(νk) (where the νk are the values of dimensionless frequencies), which exhibit in general a maximum around ν = 1.
Figure 5: left) Amplification factors AMPF_NORM for all 495 Kik-net sites as a function of true frequency; center) the same as a function of dimensionless frequency 2f / fi; right : comparison of standard deviations of amplification factors before and after the shift to dimensionless frequency ii) the second step is to correlate, for each dimensionless frequency νk , the corresponding amplifications Ai(νk) with the site velocity VSz,i. The rationale behind this correlation is simply that the lower VSz, the larger should be the amplification at the fundamental frequency. This is done by a least-square fitting of the following functional form log (Ai(νk)) = ak + bk log(VSz,i) or, in other terms, Ai(νk) = (Vref,k/VSz,i)αk
Figure 6: Example predicted amplification factors PAF for the parameter couple (f0, VS10) (left and center) and the single parameter f0 (right). The left frame displays the dependency of amplification curves on the value of VS10 for a fixed f0=2 Hz, and the middle frame the variation of amplification curve for a fixed value of VS10, and varying f0. The right frame displays the evolution of average site amplification curves with f0.
th
The 14 World Conference on Earthquake Engineering October 12-17, 2008, Beijing, China Such a procedure has been performed for each of the four parameters VSz, with z = 5, 10, 20 and 30 m. A similar correlation has been looked for also with the fundamental frequency, having in mind that f0 might be a proxy to the soil softness in a way similar to VS30. Five different amplification functions based on (VS5,f0), (VS10, f0), (VS20, f0), (VS30, f0) or f0 alone, are obtained. Two examples functions are displayed on figure 6, for the (VS10, f0) parameter couple (left and middle), and the single parameter f0 (right). The quality of such correlations is quantified through the resulting “misfit” between the actually measured amplification factors, AMPF_NORMi(f), and the predicted ones, i.e., PAFi(fk) = (Vref,k/VSz,i)αk with fk = f0i .νk. The frequency dependent misfits are displayed in Figure 7 for the different parameter choices, together with the overall misfit values over the whole spectrum. These curves and numbers do indicate that the main variance reduction is coming from the transformation to dimensionless frequency, and that after this step, the best explanation of the amplitude variations are associated with VS30; however, very shallow velocities such as VS5 and VS10 do provide a non-negligible further variance reduction. Site parameters
Overall misfit value
f0 and VS5
0.182
f0 and VS10
0.178
f0 and VS20
0.172
f0 and VS30
0.169
f0 alone
0.186
initial standard deviation
0.27
Figure 7 : Frequency dependent misfit values (left), and overall misfit values over the whole spectrum (right) for the five different correlations 5. CONCLUSION This series of investigations does indicate, in our opinion, that this two-parameter site classification could be a convenient alternative to the classical one based on VS30. The main improvements are that it relies on parameters which are easily available with non-invasive, passive or active survey techniques, and that these parameters provide a satisfactory link to the physics of site amplification, at east in the 1D case. Another interesting result is the “bell-shaped” amplification curve centred on the fundamental frequency, which is good agreement with the simple 1D physics of site amplification. Many further investigations can be considered in line with the present work: complementing the partial 1998-2004 data set with the numerous recent KIKNET data, comparing and/or testing this site classification on NGA data and/or synthetics from well controlled numerical models, investigating the changes in the shapes of the amplification curve with soil non-linear effects in soils or valley and basin type effects. We hope the present work will be useful 6. ACKNOWLEDGEMENTS This work was carried out with a PhD fellowship from LCPC (Laboratoire Central des Ponts-et-Chaussées, France), and the logistical support from LGIT (Grenoble) and CETE Méditerranée (Nice). We gratefully acknowledge the huge efforts deployed by the Japanese National Research Institute for Earth Science and Disaster Prevention (NIED) to install, maintain, and make available the digital strong-motion data (KiK-net) together with the velocity profiles for each site. Thanks are also due to Guillaume Pousse and Fabian Bonilla (IRSN, Paris, France) for preparing a KIKNET data subset corresponding to shallow events.
th
The 14 World Conference on Earthquake Engineering October 12-17, 2008, Beijing, China REFERENCES Asten, M. W., Dhu, T., and Lam,N., 2004. Optimised array design for microtremor array studies applied to site classification; observations, results and future use: Proceedings of the 13th World Conference of Earthquake Engineering, Vancouver, August 2004. Asten, M. W. and D. M. Boore, 2005. Comparison of shear-velocity profiles of unconsolidated sediments near the Coyote borehole (CCOC) measured with fourteen invasive and non-invasive methods, Blind comparisons of shear-wave velocities at closely-spaced sites in San Jose, California, M. W. Asten and D. M. Boore (Editors), U. S. Geological Survey Open-File Report 2005-1169, part 1, 35 pp. [http://pubs.usgs.gov/of/2005/1169/]. Bard, P.-Y., 2007. From noise measurements to site effects : main perspectives after the SESAME project and ESG2006 blind test, Invited key-note lecture, ISSSR 2007, Bucharest, April 27-28, 2007. Bard P.-Y., and SESAME participants, 2004. The SESAME project: an overview and main results. Proceedings of the 13th World Conference in Earthquake Engineering, Vancouver, August 2004, Paper # 2207. Boore, D. M., 2003. Simulation of ground motion using stochastic method, Pure and applied geophysics, vol. 160, pp 635-676. Boore D.M., and W.B. Joyner, 1997, Site amplifications for generic rock sites, Bulletin of the seismological society of America, 1997, 74(5), 2035-2039. Borcherdt, R. D. (1994). Estimates of site-dependent response spectra for design (methodology and justification) Earthquake Spectra 10, 617–653. Cadet, H., 2007. Utilisation combinée des méthodes basées sur le bruit de fond dans le cadre du microzonage sismique, Ph.D. thesis, Joseph Fourier University, October 31, 2007 (301 pages, in French) Castellaro, S., F., Mulargia, and P. L. Rossi, 2008. Vs30: Proxy for Seismic Amplification? Seismological Research Letters, 79-4, doi: 10.1785/gssrl.79.4.540 Chatelain, J.-L., B. Guillier, F. Cara, A.-M. Duval, K. Atakan, P.-Y. Bard, and the WP02 SESAME team, 2008. Evaluation of the influence of experimental conditions on H/V results from ambient noise recordings, Bull. Earthq. Eng., 6:33–74, doi 10.1007/s10518-007-9040-7. Cornou, C., M. Ohrnberger, D. Boore, K. Kudo and P.-Y. Bard, 2008. Derivation of structural models from ambient vibration array recordings: Results from an international blind test, ESG2006, Vol.2, in press. Haghshenas, E., P.-Y. Bard, N. Theodulidis and SESAME WP04 Team, 2008. Empirical evaluation of microtremor H/V spectral ratio, Bull. Earthq. Eng., 6:75–108, doi 10.1007/s10518-007-9058-x. Guillier, B., K. Atakan, J.-L. Chatelain, J. Havskov, M. Ohrnberger, F. Cara, A.-M. Duval, S. Zacharopoulos, P. Teves-Costa and the SESAME team, 2008. Influence of instruments on the H/V spectral ratios of ambient vibrations, Bull. Earthq. Eng., 6:3-31, doi 10.1007/s10518-007-9039-0. Konno, K. and T. Ohmachi (1998). Ground-motion characteristics estimated from spectral ratio between horizontal and vertical components of microtremor, Bulletin of the Seismological Society of America, 1998, 88-1, 228-241. Mucciarelli, M, and M. R. Gallipoli (2006). Comparison between Vs30 and other estimates of site amplification in Italy. First European Conference on Earthquake Engineering and Seismology, Geneva, Switzerland, 3–8 Sept., paper no. 270. Ohrnberger, M., Schissele, E., Cornou, C., Bonnefoy-Claudet, S., Wathelet, M., Savvaidis, A., Scherbaum F., and Jongmans, D., 2004. Frequency wavenumber and spatial autocorrelation methods for dispersion curve determination from ambient vibration recordings, Paper No. 0946, 13th World Conference on Earthquake Engineering, Vancouver, B.C., Canada. Ohrnberger, M, 2005. Report on the FK/SPAC capabilities and limitations. SESAME Deliverable D19.06, 43 pp, http://sesame-fp5.obs.ujf-grenoble.fr/Delivrables/Del-D19-Wp06.pdf Pousse, G., C. Berge-Thierry, F.Bonilla and P.-Y. Bard, 2005. Eurocode 8 design response spectra evaluation using the K-Net japanese database, Journal of Earthquake Engineering, Vol. 9, No. 4 (2005) 547-574, doi: 10.1142/S1363246905002067 Wathelet, M., D. Jongmans, and M. Ohrnberger, 2004. Surface wave inversion using a direct search algorithm and its application to ambient vibration measurements, Near Surface Geophysics, 2, 211- 221 Wathelet, M., D. Jongmans, and M. Ohrnberger (2005). Direct Inversion of Spatial Autocorrelation Curves with the Neighborhood Algorithm. Bulletin of the Seismological Society of America, 95, 1787-1800