Oct 15, 2006 - vectors and a combination of this representation with the PSD. We train and classify the ..... The best performance was achieved by the feature ...
Proceedings of the 2006 IEEE/RSJ International Conference on Intelligent Robots and Systems October 9 - 15, 2006, Beijing, China
Vibration-based Terrain Classification Using Support Vector Machines Christian Weiss, Holger Fr¨ohlich and Andreas Zell Department of Computer Science University of T¨ubingen Sand 1, D-72076 T¨ubingen, Germany Email: {c.weiss, holger.froehlich, andreas.zell}@uni-tuebingen.de Abstract— In outdoor environments, there is a variety of different types of ground surfaces. If some of them are slippery or bumpy, for example, the ground surface itself is a possible hazard for an autonomous mobile vehicle traversing the surface. Therefore, it is beneficial if the vehicle is able to estimate, which terrain it is currently traversing. Using this estimation, the vehicle can adapt its driving style to the terrain. In this paper, we present a method for terrain classification based on vibration induced in the vehicle’s body. An accelerometer mounted on the vehicle measures the vibration perpendicular to the ground surface. We experimentally compare representations of the data based on the Fast Fourier Transform (FFT) and on the Power Spectral Density (PSD). Additionally, we suggest a simpler and more compact representation based on features calculated from the raw data vectors and a combination of this representation with the PSD. We train and classify the data with a Support Vector Machine (SVM). Experiments on a large real-world dataset containing seven different terrain types evaluate our approach.
I. I NTRODUCTION In typical outdoor environments, the character of the ground surface is often extremely diverse. In some regions, the surface is flat and easy to traverse. In other regions, it may be bumpy or slippery, and traversing this regions must be done carefully. Thus, the ground surface itself is a hazard in outdoor environments. Such a hazard can be called a non-geometric hazard [1]. For this reason it is beneficial for an autonomous mobile vehicle to know what type of terrain it is currently traversing. It then can adapt its driving style to the terrain to prevent accidents. Therefore, methods for estimating the character of the current or forthcoming terrain greatly contribute to the safety of an autonomous vehicle. A vehicle could estimate the character of the terrain directly by estimating terrain parameters like cohesion. Another possibility is to group terrain into classes like gravel, asphalt or sand. During a training phase, the vehicle collects example data for each class and trains a classifier on the data. After that, the classifier assigns any newly collected terrain data to one of the classes. The vehicle can now adapt its driving commands to the terrain, based on the classification result. For example, if the vehicle detects asphalt, it can drive at high speed, because asphalt is relatively easy and save to traverse. Other surfaces, like gravel, are bumpy and loose. Thus, if the vehicle detects that it currently traverses gravel, it should slow down until it is back on a safer surface.
1-4244-0259-X/06/$20.00 ©2006 IEEE
There is a variety of different data that can be used for terrain classification. Most approaches use vision or ladar sensors. In ladar-based methods, the focus is not on estimating the type of the ground surface and detecting non-geometric hazards, but on segmenting the ground surface from vegetation and from obstacles like rocks or trunks [2]–[5]. Vision-based approaches usually use visual features like color or texture for terrain classification [5]–[7]. Some research has been done on detecting non-geometric hazards using potentiometers and force-torque sensors [8], [9]. These algorithms measure wheelsinkage and estimate soil cohesion and internal friction angles. In the last few years, terrain classification based on vibration data was investigated. Here, the focus is on the soil itself as a hazard. The idea of vibration-based terrain classification is based on the observation that traversing different terrain types induces different vibration signals in the wheels or the body of the vehicle. Therefore characteristic signals for each terrain type can be learned and used for classification. Vibration-based terrain classification was first suggested by Iagnemma and Dubowsky [10]. Later research by Brooks and Iagnemma [11] examined terrain classification for planetary exploration. Their research focussed on terrain classification with rover speeds below 5 cm/s. Brooks and Iagnemma reduce the dimensionality of their data by Principal Component Analysis (PCA) and use Linear Discriminant Analysis (LDA) for classification. Another approach was presented by Sadhukhan and Moore [12], [13]. Their method bases on neural networks and is intended for vehicles driving at speeds between about 0.2 and 1 m/s. We propose an alternative approach based on classification with a Support Vector Machine (SVM). Like Sadhukhan, we focus on vehicles driving at relatively high speeds of up to about 1 m/s. We use an accelerometer mounted on the body of the vehicle to measure the vibration. In an offline training phase, the SVM is trained on a set of vibration signals each corresponding to one second of vehicle travel. Once the SVM is trained, newly collected vibration signals can be classified online. We present experimental results on a large real-world dataset that contains seven different terrain types. The rest of this paper is organized as follows: In Section II, we describe our approach to terrain classification. Section III presents our experimental results. Section IV concludes the paper and suggests future work.
4429
Acceleration (m/s2) Acceleration (m/s2) Acceleration (m/s2) Acceleration (m/s2)
1. offline training
Example raw acceleration vector for asphalt
2. online classification
10
collect raw acceleration data
0 −10
0
10
20
30
40 50 60 70 Entry in acceleration vector Example raw acceleration vector for gras
80
90
100
10 0 −10
0
10
20
30
40 50 60 70 Entry in acceleration vector Example raw acceleration vector for gravel
80
90
split to vectors which are 1 second long
collect 1 second of acceleration data
feature extraction
feature extraction
SVM training
classification
100
10 0 −10
0
10
20
30 40 50 60 70 Entry in acceleration vector Example raw acceleration vector for paving
80
90
100
0
10
20
30
80
90
100
10 0 −10
trained SVM 40 50 60 Entry in acceleration vector
70
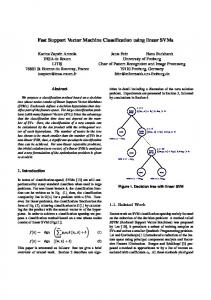
Fig. 1. Example 1×100 vectors of raw acceleration data for different terrain types. Top to bottom: asphalt, grass, gravel, paving.
II. T ERRAIN C LASSIFICATION M ETHOD In this section, we first give an overview over our terrain classification method. Then, we describe in detail the representations of the data we use as training and test vectors. Finally, we explain training and classification of the data using a Support Vector Machine. A. Method Overview The task of our vibration-based terrain classification method is to estimate which type of terrain the vehicle is currently traversing. Examples of terrain types are indoor floor, asphalt, grass, gravel, paving or clay. The estimation is based on acceleration data, collected perpendicularly to the ground plane by an accelerometer mounted on the body of the vehicle. This vertical acceleration can be regarded as the vibration which the terrain induces in the vehicle’s body. Each terrain type creates a characteristic vibration signal consisting of a series of acceleration values. We split the acceleration data into short segments, where each segment represents one second of vehicle travel. Figure 1 shows four examples of such acceleration vectors. Asphalt produces a high-frequency signal with low magnitude. The signal for grass seems to have a dominating low frequency component and a high magnitude. Gravel and paving both show a high magnitude and a moderately high frequency. In the next step, we transform the raw acceleration vectors into a representation which reveals more information about the data. We experimentally compare four different representations which are described in Subsection II-B. We use Support Vector Machines [14] to learn the characteristic signals for each terrain type and to classify new acceleration data based on the learned model. Training of the SVM on the data is done offline, because it is computationally intensive. New data is classified online, because this step is fast. Subsection II-C presents the SVM training and classification in more detail. Figure 2 shows a schematic overview of our algorithm.
Fig. 2.
predicted terrain type
Schematic overview of our terrain classification algorithm.
B. Feature Extraction We convert the segments of raw acceleration data to one of four representations. The first representation was suggested by Brooks and Iagnemma [11]. They use Welch’s method [15] to transform each vector to a power spectral density (PSD). Additionally, they advise a log scaling of the PSD to reduce the dominating effect of frequency components with high magnitude. We will refer to this representation as log PSD in the rest of this paper. Sadhukhan [12] uses a 128-point Fast Fourier Transform (FFT) of each acceleration vector. We will refer to this representation as FFT in the rest of this paper. We propose an alternative third representation, which is simpler and more compact than the log PSD and the FFT. It is based on eight features calculated from each vector of raw acceleration data. We will refer to this representation as the feature representation in the rest of this paper. For each raw acceleration vector v = vi , i = 1 . . . n, where n is the number of acceleration values per second, the entries of the feature respresentation are the following:
4430
1) The number n of sign changes in v when regarding v as a one-dimensional signal. This feature is a rough approximation of the main frequency contained in the signal. 2) The number t of traverses over the mean of v when regarding v as a one-dimensional signal. We introduce this feature because for coarse surfaces, the mean often is considerably different from 0. So perhaps even for high-frequency signals, there could be only a small number of sign changes. 3) The standard deviation σv of v. σv is higher for coarse terrain types than for smoother ones. 4) The autocorrelation rk of v at lag k = 1 [16]. r1 is a measure of the non-randomness in data. So the higher r1 for a vector, the more dependent directly following
acceleration values are. r1 is calculated as follows: �n−1 (vi − µ) (vi+1 − µ) r1 = i=1�n , (1) 2 i=1 (vi − µ) where µ denotes the mean of v. 5) The maximium max = max(vi ), i = 1 . . . n of v. This feature takes large values for terrain types that contain big bumps. ��n 2 6) The norm �v� = i=1 vi of v. �v� will take large values if the accleration is constantly high in most entries of v. 7) The minimum min = min(vi ), i = 1 . . . n of v. 8) The mean µ of v. For coarse surfaces, the mean sometimes is noticeably below 0. For flater surfaces, the mean is roughly 0. Using these eight features calculated from the raw data, we obtain training and test vectors of the form vt = (n, t, σv , r1 , max, �v�, min, µ) .
(2)
The dimension of the training vectors is more than five times smaller for the feature representation than for the FFT and the log PSD. Additionally, the transformation from raw acceleration data to the feature representation is between 3.65 and 5 times faster than to the log PSD and the FFT. Using unoptimized Matlab code on a 3 GHz Pentium 4 PC with 512 MB of RAM, the computation of one vector takes about 0.4 ms for the feature representation, about 1.46 ms for the log PSD and about 2.0 ms for the FFT. As a fourth representation we test a combination of the feature representation and the log PSD. We compute both representations from the raw acceleration vectors individually and then simply concatenate the resulting vectors. We will refer to this representation as the combined representation in the rest of this paper. As the final step of the feature extraction procedure we normalize each feature to mean 0 and standard deviation 1. C. SVM Classification After feature extraction, we use an SVM to learn for each terrain type a separation from all other terrain types (oneversus-rest classificaton). Later on, an unseen test pattern will be assigned to that class, for which the distance to the decision boundary is largest. SVMs belong to the family of kernel methods [17], which are currently highly popular within the field of machine learning. The idea is to construct a separating hyperplane between two classes of points, such that the margin between the hyperplane and the points closest to it becomes maximal. Nonlinear classification can be achieved by first mapping the original data to some high dimensional feature space in a nonlinear fashion. This computation is usually done implicitly by means of a kernel function, which defines a dot product between points in feature space. It is also possible to allow for a small number of training errors by means of a so-called soft margin parameter C that regularizes the trade-off between maximizing the margin and minimizing the training error.
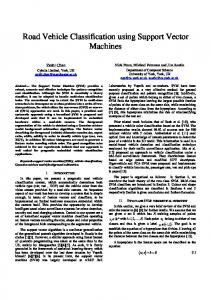
Fig. 3. The experimental cart we used to collect the data. The accelerometer is mounted on the middle of the wooden beam.
In our case we employ a Radial Basis Function (RBF) k(x, y) = exp(−�x − y�2 /2σ 2 ) as kernel function. The width σ of the RBF kernel together with the soft margin parameter C are tuned via a systematic search on the grid log2 σ ∈ σ ˆ /4, ..., 4ˆ σ and log2 C ∈ −2, ..., 14, where σ ˆ is set such that exp(−D/2ˆ σ 2 ) = 0.1. Each candidate parameter vector (σ, C) on the grid is evaluated by 5-fold cross-validation. As SVM implementation we used the LIBSVM software [18]. III. E XPERIMENTAL R ESULTS In the previous section, we presented four different representations for training vectors. The experiments described in this section compare the different representations and evaluate their performance. We used an Xsens MTi Attitude and Heading Reference System (AHRS) to measure the acceleration perpendicularly to the ground plane. We recorded the acceleration data at 100 Hz with a laptop computer. We mounted the Xsens MTi on a cart (Fig. 3) which we moved around manually. The wheels of the cart are made of relatively hard rubber. In our experiments, we directly mounted the accelerometer on the body of the cart. However, if one uses a vehicle which has a suspension mechanism, the vibration in the body of the vehicle is dampened or possibly absorbed. For such a vehicle, it is better to mount the accelerometer directly on the axis of a wheel or some other part which is not affected by the suspension. Some soft wheels also dampen the vibrations induced in the body of the vehicle. In these cases, the distinctiveness of the vibration signals is likely to decrease and with it the classification accuracy. We collected data of six different terrain types around our department. Additionally, we collected data when the vehicle did not move to learn such a situation. This is especially useful if the vehicle has no odometry (like our cart) or other sensors which reliably measure the vehicle’s speed. The seven terrain types are (the number of instances per terrain type in our dataset is given in parentheses): 1) Indoor PVC floor (491).
4431
Fig. 4. The terrain types we used in our experiments. 1: Indoor floor. 2: Asphalt. 3: Gravel. 4: Grass. 5: Paving. 6: Boule court.
6
6
5
5
4
4
3
3
2
2
1
1
0
2) Asphalt (1199). 3) Gravel, consisting of rocks ranging from about 1 to 5 cm in diameter (235). 4) Grass. Not the grass itself is measured, but the soil the grass grows on (602). 5) Paving (455). 6) Boule court, which is made of clay (290). 7) No motion (924). Figure 4 shows examples of the different terrain types. The number of training vectors per class reflects the availability of the different terrain types in the area surrounding our department as we traversed every place only once. Each training vector corresponds to one second of vehicle travel. The speed of the vehicle varied during movement, roughly between 0.2 m/s and 1 m/s. Additionally, we not only moved the vehicle in a straight line, but on a trajectory containing curves. We collected the data on two different days one month apart in October and November. In October, we had about 15◦ C and the soil was dry. In November, we had about 7◦ C and the soil was wet. For the experimental evaluation we used 10-fold crossvalidation, i.e. we randomly split the data into 10 parts and systematically used each part once for testing and the rest for training. Classification results were then averaged over all 10 trainings/testings. Each training consisted of a feature extraction and SVM parameter search purely on the current training data, whereas in the testing phase the ready trained model was asked to predict the class of previously unseen terrain measurements. In a first experiment, we classified only three terrain types: gravel, grass and Boule court (clay). Figure 5 (left) shows the total misclassification rate (total loss) for the three-class experiment using the different data representations. Additionally, Tab. I presents the classification results in more detail; the rows also show the misclassification rates per class for the different terrain types. The best performance was achieved by the feature representation (total misclassification rate = 2.57%). The classification loss for the combined representation was about 0.3% worse (total misclassification rate = 2.84%).
7−class experiment 7
total loss (%)
total loss (%)
3−class experiment 7
feature comb. log PSD
0
FFT
feature comb. log PSD
FFT
Fig. 5. Total losses using the different data representations in two different experiments. Left: three-class experiment. Right: seven-class experiment. TABLE I M ISCLASSIFICATION RATES PER CLASS AND TOTAL CLASSIFICATION LOSS (%) ± STANDARD ERROR FOR THREE DIFFERENT TERRAIN TYPES WITH DIFFERENT REPRESENTATIONS
gravel grass boule court
feature 6.39 ± 1.73 1.00 ± 0.37 2.76 ± 1.34
combined 7.19 ± 1.55 1.33 ± 0.54 2.41 ± 1.36
log PSD 7.61 ± 1.50 1.49 ± 0.39 3.45 ± 1.63
FFT 8.50 ± 1.79 1.49 ± 0.30 2.76 ± 1.13
total loss
2.57 ± 0.61
2.84 ± 0.67
3.28 ± 0.65
3.28 ± 0.53
Classification on the FFT and the log PSD resulted in total misclassification rates of 3.28%. So the feature representation outperformed the log PSD and the FFT by 0.71%. Combining the feature representation and the PSD did not improve classification in this case. To evaluate, whether the differences in the misclassification rates are statistically significant, we performed twotailed paired t-tests. The t-tests determine the probability that two misclassifcation rates come from distributions with equal means. Each t-test returns a p-value which is the probability that the two means are equal. Usually a significance level of 5% or 10% is chosen as a cutoff value for the p-value, below which the hypothesis of the t-test that the two distributions do not differ can be rejected. In practice, we created a 10dimensional vector which contained the classification results on each test set during the 10-fold cross-validation procedure. We then performed pairwise t-tests on the vectors for the different representations. The t-tests indicated that there is a significant improvement of the feature representation and combined representation compared to the log PSD at 10% significance level (p-values = 5.37%, 9.43%). Between the log PSD and the FFT we could not find any significant difference. Table I shows that the class specific misclassification rate for gravel using the feature representation was about 6.5%, about 3% for the Boule court and about 1% for grass. The
4432
TABLE II
TABLE IV
M ISCLASSIFICATION RATES PER CLASS AND TOTAL CLASSIFICATION LOSS
T OTAL CLASSIFICATION LOSS (%) ± STANDARD ERROR OF SEVEN - CLASS
(%) ± STANDARD ERROR FOR SEVEN DIFFERENT TERRAIN TYPES WITH
CLASSIFICATION FOR THE DIFFERENT REPRESENTATIONS WITH AND WITHOUT
DIFFERENT REPRESENTATIONS
no motion indoor asphalt gravel grass paving boule c.
combined 0.11 ± 0.11 5.70 ± 0.79 2.59 ± 0.47 33.17 ± 3.25 1.82 ± 0.63 8.59 ± 1.30 5.86 ± 1.26
feature 0.11 ± 0.11 6.31 ± 1.07 3.17 ± 0.62 32.74 ± 2.89 1.49 ± 0.63 10.14 ± 1.49 6.90 ± 1.15
log PSD 0.11 ± 0.11 5.91 ± 0.48 3.09 ± 0.39 37.84 ± 2.69 1.99 ± 0.65 14.29 ± 1.43 7.93 ± 1.03
FFT 0.0 ± 0.0 6.51 ± 0.90 4.76 ± 0.61 30.92 ± 3.52 2.32 ± 0.66 17.62 ± 2.02 7.24 ± 1.49
total loss
4.89 ± 0.31
5.29 ± 0.22
6.10 ± 0.37
6.60 ± 0.33
without PCA with PCA
combined 4.89 ± 0.31 6.22 ± 0.36
PCA.
feature 5.29 ± 0.22 10.61 ± 2.83
log PSD 6.10 ± 0.37 7.58 ± 0.43
FFT 6.60 ± 0.33 6.67 ± 0.33
understanding of the reasons for the highly different error rates, we computed a ”confusion matrix” M, in which each entry Mij indicates how often (in %) an unseen test example belonging to class i was assigned to class j (Tab. III).
reason for these differences is the unbalanced number of training examples per class in our dataset. The number n of training vectors for grass (ngrass = 602) is noticably larger than for gravel (ngravel = 235) and for the Boule court (nboule = 290). You could compensate for the differences in the misclassification rates by selecting an equal number of training patterns for each of the three classes. This is also appropriate if the distribution of the classes in the test set is unknown. As in our experiments both training and test data were generated at the same area around our department, we used the unbalanced training set corresponding to that area. Training and classification was performed using Matlab code on a 3 GHz Pentium 4 PC with 512 MB of RAM. Training took about 1:54 minute for the feature representation, about 4:13 minutes for the combined representation, about 4:32 minutes for the log PSD and about 6:42 minutes for the FFT. Classification of a single test example took about 0.29 ms for the feature representation, about 0.33 ms for the combined representation, about 0.35 ms for the log PSD and about 0.43 ms for the FFT. In a second experiment, we involved all seven terrain types: no motion, indoor floor, asphalt, gravel, grass, paving and the Boule court. The total misclassification rates were 4.89% for the combined representation, 5.31% for the feature representation, 6.12% for the log PSD and 6.60% for the FFT (Fig. 5 (right) and Tab. II). So the feature representation outperformed the log PSD and the FFT by 0.81% and 1.31%, respectively. This time, the results using the log PSD were slightly better than using the FFT. In contrast to the the threeclass experiment, the combined representation now performed best. Pairwise t-tests showed that there is a strong significant improvement of the feature representation compared to the log PSD and the FFT at 10% significance level (p-values = 1.87%, 0.48%). Additionally, there is a very strong significant improvement of the combined representation compared to the log PSD and the FFT (p-values = 0.04%, 0.0007%). Again, we could not find a significant difference between the log PSD and the FFT. A remarkable exception from the low error rates for the other classes was the high misclassificaton rate for gravel, which in all representations was above 30%. To get a clearer
The confusion matrix revealed that classification worked well in most cases. The most problematic terrain is gravel, which was wrongly classified as paving for 27.68% of the test vectors. Figure 1 shows that the signals for gravel and paving are indeed very similar, so that it is relatively difficult to distinguish between them. On the other hand, paving is only misclassified as gravel for 4.18% of the test vectors. Some part of this difference is due to the unbalanced number of training examples for gravel and paving. The dataset contains almost twice as many examples for paving (455) than for gravel (235). Training on the seven-class dataset took about 19:22 minutes for the feature representation, about 28:46 minutes for the combined representation, about 28:02 minutes for the log PSD and about 95:31 minutes for the FFT. Classifying a single test example took 0.29 ms for the feature representation, 0.43 ms for the combined representation, 0.45 ms for the log PSD and 0.97 ms for the FFT. In a final experiment we evaluated, whether a PCA preprocessing of the training vectors as a denoising and dimensionality reduction technique can improve performance. We set the number m of principal components such that the principal components explained 95% of the variance in the data. For the different representations this resulted in mf eature = 3, mcombined = 2, mlogP SD = 2 and mF F T = 52. Despite the reduced dimension of the training vectors, training remained an offline step (between about 12 minutes for the combined representation and about 20 minutes for the feature representation). Additionally, classification times (0.31 ms for the feature representation, 0.40 ms for the combined representation, 1.17 ms for the log PSD and 0.37 ms for the FFT) were not reduced significantly, if at all. Table IV shows the effect of the use of PCA compared to our previous results for the classification with seven terrain types. According to the error rates, classification with PCA was between 0.07% and 5.32% worse than classification without PCA. Thus, contrary to our assumptions, PCA does not seem to have a positive effect here. Pairwise t-tests between the results with and without PCA showed that the differences are significant at the 10% level for the feature representation, the combined representation and the log PSD (p-values = 8.56%, 0.007% and 0.02%).
4433
TABLE III C ONFUSION MATRIX FOR SEVEN - CLASS CLASSIFICATION ON THE COMBINED REPRESENTATION
no motion indoor asphalt gravel grass paving boule court
no motion 99.89 0.0 0.0 0.0 0.0 0.0 0.0
indoor 0.11 94.30 1.33 0.0 0.0 0.22 0.0
asphalt 0 5.50 97.41 0.0 0.0 2.42 2.07
IV. C ONCLUSION We presented a new approach to vibration-based terrain classification, which is based on Support Vector Machines. The vibration signals induced in the vehicle’s body by different terrain types are measured with an accelerometer. We compared four different representations to which we transform the raw acceleration data before classification. The first two representations are a log-scaled Power Spectral Density and a 128-point Fast Fourier Transform, which were previously used for terrain classification by other researchers [11]–[13]. Additionally, we suggested a new third representation based on simple features calculated from the raw acceleration vectors. This feature representation is simpler, more compact and faster to compute than the PSD and the FFT. As a fourth representation we tested a combination of the feature representation and the PSD. For classificiation, our method uses a SVM which is trained offline on the data. Once the SVM is trained, it classifies newly collected data online. We presented experiments on a large real-world dataset. It contains data for indoor floor, asphalt, gravel, grass, paving, a Boule court (consisting of clay) and situations in which the vehicle did not move. Three-class classification on gravel, grass and clay using our method showed very good results, with a total misclassification rate of about 2.5%. The results for classification on all seven terrain types were also very good; here, the total misclassification rate was about 5%. An experimental comparison between the four data representations showed that the feature representation proposed in this paper significantly improved the classification results compared to the PSD and the FFT. In the seven-class experiment, the total misclassification rate using the feature representation was about 1% lower than for the PSD and the FFT. We verified the statistical significance of the improvement using pairwise t-tests. Combining the feature representation and the PSD improved classificiation results in the seven-class experiment but not in the three-class experiment. Between the PSD and the FFT, we could not find any significant difference. Preprocessing the data with PCA did not improve the classification results. We collected the acceleration data used in the experiments on vehicle trajectories containing curves and different speeds. As observed by Sadhukhan [12], classification depends on the speed of the vehicle. Lower speeds result in decreased classification rates. So in future work, we will evaluate the influence of speed and curves on the classification more
gravel 0.0 0.0 0.0 66.83 0.67 4.18 0.0
grass 0.0 0.0 0.0 4.20 98.18 0.0 1.72
paving 0.0 0.0 0.92 27.68 0.66 91.41 2.07
boule court 0.0 0.20 0.33 1.29 0.49 1.77 94.14
systematically. Additionally, we will test our method on other vehicles, for example on our RWI ATRV-Jr outdoor robot. R EFERENCES [1] B. H. Wilcox, “Non-geometric hazard detection for a mars microrover,” in Proc. AIAA Conf. Intell. Robot. Field, Factory, Service, Space, vol. 2, Houston, TX, 1994, pp. 675 – 684. [2] A. Talukder, R. Manduchi, A. Rankin, and L. Matthies, “Fast and reliable obstacle detection and segmentation for cross-country navigation,” in IEEE Intelligent Vehicles Symposium, Versailles, France, 2002. [3] M. Hebert and N. Vandapel, “Terrain classification techniques from ladar data for autonomous navigation,” in Collaborative Technology Alliances conference, May 2003. [4] N. Vandapel, D. Huber, A. Kapuria, and M. Hebert, “Natural terrain classification using 3-d ladar data,” in IEEE International Conference on Robotics and Automation (ICRA), New Orleans, LA, April 2004. [5] R. Manduchi, A. Castano, A. Talukder, and L. Matthies, “Obstacle detection and terrain classification for autonomous off-road navigation,” Robotics And Automation, vol. 18, pp. 81 – 102, 2005. [6] P. Bellutta, L. Manduchi, K. Matthies, K. Owens, and A. Rankin, “Terrain perception for demo III,” in Proc. IEEE Intelligent Vehicles Symposium, Dearborn, MI, 2000, pp. 326 – 332. [7] R. Castano, R. Manduchi, and J. Fox, “Classification experiments on real-world textures,” in Workshop on Empirical Evaluation in Computer Vision, Kauai, HI, 2001. [8] K. Iagnemma, C. Brooks, and S. Dubowsky, “Visual, tactile, and vibration-based terrain analysis for planetary rovers,” in IEEE Aerospace Conference, 2004. [9] K. Iagnemma, S. Kang, H. Shibly, and S. Dubowsky, “Online terrain parameter estimation for wheeled mobile robots with application to planetary rovers,” IEEE Transactions on Robotics, vol. 20, no. 5, pp. 921 – 927, 2004. [10] K. Iagnemma and S. Dubowsky, “Terrain estimation for high-speed rough-terrain autonomous vehicle navigation,” in SPIE Conference on Unmanned Ground Vehicle Technology IV, 2002. [11] C. A. Brooks and K. Iagnemma, “Vibration-based terrain classification for planetary exploration rovers,” IEEE Transactions on Robotics, vol. 21, no. 6, pp. 1185 – 1191, December 2005. [12] D. Sadhukhan, “Autonomous ground vehicle terrain classification using internal sensors,” Master’s thesis, Dept. Mech. Eng., Florida State University, Tallahassee, Florida, USA, 2004. [13] D. Sadhukhan and C. Moore, “Online terrain estimation using internal sensors,” in Florida Conf. on Recent Advances in Robotics, Boca Raton, FL, 2003. [14] C. Cortes and V. Vapnik, “Support vector networks,” Machine Learning, vol. 20, pp. 273 – 297, 1995. [15] P. D. Welch, “The use of fast fourier transform for the estimation of power spectra: A method based on time averaging over short, modified periodograms,” IEEE Trans. Audio and Electroacoustics, vol. AU-15, pp. 70 – 73, June 1967. [16] NIST/SEMATECH e-Handbook of Statistical Methods. NIST. [Online]. Available: http://www.itl.nist.gov/div898/handbook/ [17] B. Sch¨olkopf and A. J. Smola, Learning with Kernels. Cambridge, MA: MIT Press, 2002. [18] C.-C. Chang and C.-J. Lin, LIBSVM: a library for support vector machines, 2001, software available at http://www.csie.ntu.edu.tw/˜cjlin/libsvm.
4434