[5]Lo, David, Hong Cheng, Jiawei Han, Siau-Cheng Khoo, and Chengnian Sun. "Classification of software behaviors for failure detection: a discriminative ...
International Journal of Computer Applications (0975 – 8887) Volume 101– No.13, September 2014
A Novel Approach using Dual Active Feature Sample Selection and LTS (Learn to Search) Maya Aikara
R.R. Sedamkar
Sheetal Rathi
Department of Computer Science & Engineering, Thakur College of Engineering and Technology, University of Mumbai, India
ABSTRACT Determining the bug signatures(context of bug) is difficult, as it involves mining the execution traces of the program. The discriminative graph mining algorithm is used to identify the bug signatures. It requires manual labelling of the input set to estimate the discriminative subgraphs. To reduce the tedious work of manual labelling, this paper presents novel framework to identify bug signatures. The proposed algorithm uses hybrid approach of dual active feature sample selection and LTS(Learn to Search). In the hybrid method, the dual active feature sample selection is used to find the query graph and its corresponding discriminative subgraphs, and LTS method is applied to obtain risk free optimal solution. The performance of the combined approach is measured with the parameters (i)runtime, (ii)recall and (iii)precision. The experiment results shows that this hybrid approach has an improved runtime of 60.10% when only 40% of the input graph set is manually labelled. The recall and precision are also improved by 33.33% when compared with dual active feature sample selection without LTS.
Keywords Graph Mining, Discriminative subgraph mining, Bug Signatures
1. INTRODUCTION A software’s quality and productivity can be enhanced by applying mining algorithms to various task of software engineering, especially in bug detection and debugging. But the mining of software engineering(SE) data possess several challenges [1] like complex data and patterns, large scale of data, unique requirements. Graphs are considered to be the precise representation for large number of entities, for their attributes and relationships. Therefore, the SE data can be represented as graph for easy mining. Mining graph data[2] is an extraction of novel and useful knowledge from graph representation of data. The software engineering graph data is generally a static or dynamic call graph, or program dependence graph. In SE, debugging is an expensive and meticulous task. It is difficult to locate and fix the exact location of bugs since failure is visible from far view point (like system crash or incorrect result outputted). There might be a case that two statements or methods when scanned individually shows no error, but when executed one after the other, results in an erroneous output. To identify such bug locations (also called bug signatures), the context of the bug needs to be identified. The frequent subgraph mining [3,4], graph classification[5], discriminative subgraph mining[6] are some of the graph mining algorithms for bug detection and debugging.
The frequent subgraph mining (FSM) is the process of extracting the frequent subgraphs from the data set, given a particular frequency threshold. FSM are classified as general purpose and pattern-based frequent subgraph mining[3] on the basis of the type of dataset selected for mining. The FSM is used to localize bug using edge-weighted call graphs[4]. The frequencies of the call graphs are added as weights to locate the bugs. In FSM, the frequency is used to identify bug, but a bug can occur with lowest frequency. Therefore, FSM may not lead to the optimal solution for identification of bug signatures. The graph classification algorithms are used to detect failures by analyzing software behaviours[5]. The iterative patterns are mined from software traces and then discriminative patterns are identified from this set of patterns. Finally, the classifier is trained to detect the failures. This approach may not be efficient to identify bug signatures, because even here, the discriminative patterns are identified from a set of frequent patterns. When discriminative subgraphs are identified from the complete set of graph[6], there is a very less opportunity to miss the optimal solution. The discriminative subgraph is found using Leap algorithm[7]. In Leap algorithm, structural proximity is followed by frequency descending mining. The algorithm is based on the assumption that discriminative subgraphs with high score tend to have high frequencies. This may not be always true. Moreover, to identify bug signatures we need to provide objective function carrying the class label of every input graph. The labelling of the graph is generally done manually. Manually labelling process is a time consuming and an expensive task. This cost can be reduced by training the model to select the most important query graph for labelling, such a procedure is called active query selection. The selection of query graph from a graph database requires subgraph feature selection. Both the selection procedure are correlated and when considered simultaneously is called dual active feature and sample selection[8]. The dual active feature sample selection uses gSpan[9] algorithm approach for searching and pruning the search space of feature selection. The gSpan[9] algorithm adapts single lineage pattern exploration which may not always lead to the optimal solution. The LTS[10] method extracts discriminative subgraphs using multi lineage pattern exploration with aggressive pruning on it. This method possesses less risk than single lineage pattern exploration to lose the optimal solution. So as to avoid both manual labelling and the risk of losing optimal solution, this paper proposes a hybrid approach of using Dual active feature sample selection and LTS method to identify bug signatures. The remaining part of paper is organized as follows. Section II gives the knowledge of preliminaries to understand Dual
31
International Journal of Computer Applications (0975 – 8887) Volume 101– No.13, September 2014 active feature sample selection and LTS method. Section III describes the dual active feature and sample selection in detail. Section IV elaborates the LTS method of pruning and explains the difference between single and multi lineage pattern exploration. Section V introduces our hybrid approach and explains the process followed for implementation. Section VI describes the experiment conducted, the performance matrix used and the results obtained. Section VII defines the future scope. Section VIII concludes the paper.
2. PRELIMINARIES Definition 1 (Discriminative subgraph): Given an input as positive and negative set of graph, finding the subgraph which contrast the positive and negative graph, is said to be discriminative subgraph. This discriminative subgraph is determined by a discriminative score. In our approach, the discriminative score used is same as in dual active feature sample selection[7] . For a feature gi , the discriminative score is calculated as
h( gi, M ) f iT Mf i
…(1)
M HyyT H / nl i l T Tu / nl i l T Tl ….(2) Here the fi indicates binary vector for the feature gi in the graph dataset. The y is a matrix for class labels. H is a centering matrix, Hij = δij − n−1. (δij = 1 iff i = j, otherwise 0). The α and β are parameters, both set as 0.001. ∏u , ∏l , ∏i are the projection matrices for unlabelled, labelled and selected feature of graph respectively.
Definition 2 (Lineage):
In pattern exploration, the lineage of a pattern is a sequence of patterns p1, p2, p3 …..pk . The pattern p2 is superset of pattern p1 obtained by adding an edge to p1. In general, pi+1 is obtained by adding an edge to pi pattern. There a two ways of pattern exploration, single lineage pattern exploration and multi lineage pattern exploration. In a single lineage pattern exploration, each subgraph pattern is enumerated exactly once whereas in multi lineage pattern exploration, a subgraph pattern may be enumerated many times from different lineages. The example below[9] shows the difference between single and multi lineage. A-B
A-B-B
A-D
A-B-C
B-B
B-A-D
B-C
B-B-C
Figure 1: Example of multi-lineage pattern exploration A-B
A-B-B
A-D
A-B-C
B-B
B-A-D
B-C
B-B-C
Figure 2: Example of single-lineage pattern exploration
Let pattern A-B-B be the optimal pattern, if A-B is pruned reaching A-B-B is not possible in single lineage exploration. Whereas in multi lineage exploration, one can afford to prune A-B without missing the optimal solution. Thus aggressive pruning can be afforded by the multi lineage exploration due to its redundancy in pattern exploration.
Definition 3 (Score Records):
The score record of a pattern is a sequence of scores for patterns in the lineage of that pattern. If lineage of a pattern is l(p)=p 1, p2,…. pk, then score record of pattern is s(p)=s(p1), s(p2),….s(pk).
3. DUAL ACTIVE FEATURE AND SAMPLE SELECTION The two stage active learning framework has two separate steps of feature selection and active sample selection. The features are selected from a set of labelled graphs and then a query graph is selected to identify the unlabelled graph. In this approach, the useful features from unlabelled graphs are not considered for query selection, thus leading to the poor estimation of query graph. To overcome this issue, the dual active feature and sample selection was introduced[8]. The figure below shows the dual active feature and sample selection, which is a simultaneous process of feature selection and active sample selection. Query & Labelling
Labelled Graph Unlabelled Graph
Active Query Selection Optimal Subgraph Selection
Dual Active Feature and Sample Selection
Figure 3: Dual Active Feature & Sample Selection In the dual active feature and sample selection, the features are selected from labelled as well as unlabelled graphs and then the query graph is selected for labelling. The selected query graph is considered as most representative and informative for the set of unlabelled graphs. The gActive algorithm[8] is used to maximize the dependence between subgraph features and graph labels. The algorithm calculates the discriminative score, to find the discriminative subgraphs for the query graph. The gActive algorithm uses gSpan[9] approach for searching and pruning the search space of feature selection. The dual active feature sample selection minimizes the labelling efforts for graph classification.
4. LTS PRUNING SEARCH SPACE Learn To Search(LTS)[10] is a discriminative mining algorithm to find discriminative subgraphs given a set of positive and negative graph. The LTS proposes a greedy approach called fastprobe algorithm[10] to reach the local optimal solution and then uses a branch and bound approach to prune the search space using estimated upper bound of the discriminative scores. The fastprobe algorithm, though it uses a multi lineage pattern exploration, it does an
32
International Journal of Computer Applications (0975 – 8887) Volume 101– No.13, September 2014 aggressive pruning with the optimal score found so far. Hence, one might lose the pattern, whose future lineage may be the optimal solution. To avoid this risk, LTS method is used to check the upper bound of the pattern and its score before pruning that pattern. The fastprobe algorithm acquires the search history i.e. score records for the lineage of pattern. This score records are represented as prefix tree called prediction tree. The prediction tree is further utilized to estimate the upper bound. This upper bound of scores is used for pruning the search space to reach the optimal discriminative subgraph. LTS excels Leap[7] algorithm in terms of runtime and optimal scores. Earlier to identify bug signatures Leap algorithm was used.
5. COMBINED APPROACH TO IDENTIFY THE BUG SIGNATURES This paper proposes a combined approach of dual active feature sample selection[8] and LTS method[10] to identify bug signatures from programs. When identifying bug signatures, the input is a labelled set of faulty and correct execution graphs of a program. This labelling is done manually, leading to lot of time consumption. The dual active feature sample selection reduces the time for manual labelling by selecting a query graph and finding the discriminative subgraph. It uses single lineage pattern exploration for searching and frequencies with minimum support for pruning. This exploration has a risk of losing the optimal solution. Hence, the approach in this paper employs LTS method for searching and pruning the search space of feature selection. LTS uses multi lineage pattern exploration with aggressive pruning to achieve faster and better optimal solution. The input to the methodology is a set of labelled and unlabelled graph of execution traces of a source program. The flow from source program and test cases to the set of input graph is explained below. Test cases
Source code
CFG of source code
Add to the set of input graph
Remove the unidentified edges
Run the test case
Identify executed part in CFG
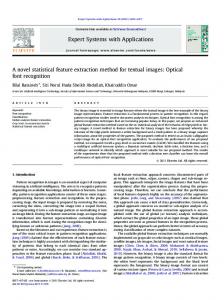
Figure 4: Processing for the input The set of input graph is obtained in the following way. First, control flow graph(CFG) of the program source code is generated. Then, one test case is applied to get the execution traces. This execution trace is then used to identify the part of control flow graph(CFG) of program which was executed. Such a graph is added to the set of input graph. Similar, method is used to acquire input graph for the remaining test cases of the program source code. For the set of labelled input graph, the graph is labelled as faulty if the corresponding output of the program is faulty and the graph is labelled as correct if the corresponding output of the program is correct. The process flow of proposed approach is shown in below figure 5.
Figure 5: Process flow In this approach, the input is a graph dataset arranged as set of labelled graphs followed by set of unlabelled graphs. To calculate the discriminative score, the matrix is initialized for each unlabelled graphs. The near optimal solution is obtained for each of the unlabelled graph using fastprobe algorithm[10]. The prediction tree is built with these near optimal scores. Each node in prediction tree represents a pattern (subgraph) and upper bound is estimated at each node in the prediction tree. Before searching of the optimal solution starts, a candidate list is initialized with single edge subgraph patterns. A pattern is removed from candidate list and its score is estimated. This discriminative score of the pattern is compared with upper bound of that pattern and optimal score found so far. If the discriminative score of this pattern is greater than both upper bound and current optimal score, the optimal solution is updated with the current pattern. Or else, the pattern is pruned. This calculation and comparison is done for each pattern in the candidate list. At the end, a query graph(Gs*) is selected by the formula given below.
Gs* max GsDa giTi h( gi , M )
….(3)
For each unlabelled graph, a set of k discriminative subgraphs(g) having the higher scores are identified. Their scores are stored in T. The query graph is that unlabelled graph, which is having maximum score of sum of the scores of their discriminative subgraphs. The discriminative subgraphs of this query graph are the bug signatures of the program.
6. EXPERIMENTS This paper is implemented in java on 1.7Ghz i5 core processor, 3.86 memory with Windows 7 64bit operating system. Eclipse kepler environment is used for
33
International Journal of Computer Applications (0975 – 8887) Volume 101– No.13, September 2014 experimentation. The inputs are three programs in java, i.e. a program to find prime numbers, to display the month of a year and insertion sort. The bugs are manually inserted by changing the logic of some statements in the program. Different test cases are applied to each program to generate their respective control flow graphs. Labelled graph are manually labelled on the basis of output received. For experimentation only 40% of the graphs in the input set is manually labelled. Thus reducing the manual labelling to 60% from the standard method[6]. The discovered discriminative subgraphs identifies those statements in the program, where the bug was inserted.
starting with single edge subgraph and their scores are calculated as in dual active feature sample selection. Then fastprobe followed by LTS algorithm is used to identify the 4 most discriminative subgraphs for each of the unlabelled graph based on the score calculated. The higher the score , the more discriminative is the subgraph. The sum of these higher scored subgraph for each unlabelled graphs is estimated. The unlabelled graph with highest sum is considered to be the query graph. The number of graphs identified by this query graph is the precision. The recall is estimated for each of the discriminative subgraph of this query graph and the average is taken into consideration.
A. Performance metrics
The importance of the proposed hybrid approach is shown by comparing the results with LTS method[9] and with dual active feature sample selection[7] individually when used to identify the bug signatures. In other words, the hybrid approach is compared with methods where all the input graphs are labelled and uses multi lineage exploration The input graphs are partially labelled and uses single lineage pattern exploration. The alpha(α) and beta(β) parameters (for matrix(M) calculation) are set as 0.001 and 0.001 respectively for the experimentation. The table below shows the result of runtime in milliseconds for the three input programs, along the three approaches LTS, hybrid approach and dual active feature sample selection.
The runtime, precision[11] and recall[11] are the three performance metrics considered for the evaluation of the proposed hybrid approach. The runtime is calculated as the time required to run the program with the addition of labelling error. Labelling error is estimated as the time required to manual label the test cases of the input program. This error is calculated by taking the average time required by five people to identify the output for each test cases of the input program. Precision refers to the proportion of the returned result that highlight the bug[6]. Therefore, precision is considered to be the number of discriminative subgraphs found by the approach. Recall refers to the proportion of bugs that can be discovered by the returned bug signatures[6]. Recall is estimated as the percentage of presence of discovered discriminative subgraph in positive set as well as negative set of input graphs. Recall = [(No. of graphs in positive set who are the superset of the discriminative subgraph)- (No. of graphs in negative set who are the superset of the discriminative subgraph)]%
B. Dataset description The dataset consists of three programs, each having ten test cases to be executed. The first java program is to find the whether the given input number is prime. A bug is manually inserted by changing the logic of program (the remainder instead of equating to zero is made equal to one). The second program is to display the month given a number. As it a switch case program some cases are manipulated to lead to bugs. The third program is for insertion sort. The bugs are inserted by changing the loop conditions and variable assignments. All the three are java programs and executed in eclipse kepler environment. The program are first converted to control flow graph using CFG generator tool(eclipse plugin)[12]. Then the test cases are executed to acquire the coverage of the program using the Code Cover tool in eclipse[13]. The CFG generator tool is used again to generate graph from the code cover session. This graph is given as an input to the mentioned hybrid approach. The similarity in the input set is described as follows. The program 3 (insertion sort) has similar graphs in positive input set as well as similar graph in negative input set. The program2 (month identification) has no similar graphs in positive input set as well as in negative input set. In the program1(prime numbers) the positive set has 60% similar graphs and negative set has 60% similar graphs.
Table 1. Results of runtime Program1 : Prime Program2: Program 3: Runtime (in Month id Insertion sort milliseconds) no. LTS Hybrid Approach Dual Active feature sample selection
168047
132047
216078
67047
53062
86062.66667
67031
53031
86031
The runtime of the hybrid approach is 60.10% faster when compared with LTS method[9]. In LTS, all the input graph need to be labelled manually as correct or faulty execution to identify the bug signatures. But, in the proposed methodology and dual active feature sample selection only 40% of the input graphs are labelled. When compared with dual active feature sample selection[7], which uses single lineage pattern exploration, the hybrid approach has approximately same runtime. The results of runtime are summarized in the graph below.
C. Experiment results and Discussion The input to the hybrid approach is 40% of labelled graphs and 60% of unlabelled graphs. The subgraphs are identified
34
International Journal of Computer Applications (0975 – 8887) Volume 101– No.13, September 2014 Table 3. Results of recall
LTS
200000
150000
Recall
Hybrid Approach
100000 50000 0
LTS Hybrid Approach Dual Active feature sample selection
Dual Active feature sample selection
Figure 6: Summary of runtime The results for precision is shown below in the table. Here, the values indicate the number of returned discriminative subgraphs in each program in the scale of 4. Table 2. Results of precision
Precision LTS Hybrid Approach Dual Active feature sample selection
Program1: Prime no.
Program2: Month id
Program 3: Insertion sort
3
2
4
3
4
4
2
4
4
The precision for the hybrid approach is found to be higher or same compared to individual approaches. The discriminative score in LTS method is based on frequency in the input set. The input graph set having lower frequency subgraphs shows lower precision. When all the graphs in the input set are similar then the precision is found to be highest. The precision is seen to be improved by 33.33% when compared with dual active feature sample selection without LTS. The summarized graph for precision is shown below
Program1: Prime no.
Program2: Month id
Program 3: Insertion sort
40
0
100
50
50
100
50
25
25
The recall is same or better when compared with dual active feature sample selection and LTS method individually. The discriminative subgraph may not always be frequent subgraphs. Therefore, the LTS method has lower recall when the input graph set has less frequent graphs. The dual active feature sample selection uses single lineage pattern exploration, which may lose the optimal solution. Therefore, it has lower recall compared to the hybrid approach which uses multi lineage pattern exploration. The recall is found to be improved by 33.33% when compared with dual active feature sample selection without LTS. The recall is summarized below.
Recall Percentage
Runtime in milli seconds
250000
120 100 80 60 40 20 0
LTS
Hybrid Approach Dual Active feature sample selection
Figure 8: Summary for Recall
7. FUTURE SCOPE Precision in scale of 4
5 4
LTS
3
2 1 0
Hybrid Approach Dual Active feature sample selection
Figure 7: Summary for Precision The recall for the three approaches along the three input program is shown in table below.
As the hybrid approach drastically reduces the manual labelling of input graph, still it requires some manual labelling. In future, a system can be developed which requires no manual labelling to identify bug signatures. A new methodology can be innovated for discriminative score determination, to improve the recall and precision of the approach.
8. CONCLUSION This paper presents a hybrid approach of dual active feature sample selection and LTS method for identifying the bug signatures. The gActive algorithm is an active learning method, which learns from the some labelled input to identify the discriminative graphs from the unlabelled input. The gActive method reduces a lot of manual labelling, but it applies single lineage pattern exploration. This exploration has a risk of pruning the optimal solution. In the hybrid method, the single lineage pattern exploration is replaced with multi lineage pattern exploration of LTS to avoid the risk of losing the optimal solution. Thus the approach not only reduces the manual labelling of the input graph, but provides a risk free method to obtain the optimal solution.
35
International Journal of Computer Applications (0975 – 8887) Volume 101– No.13, September 2014 The hybrid approach provides a helping hand for a new programmer whose is not much aware of the source program and is told to identify bug signatures from that program. This new programmer needs to label only some of the input graph to identify the bug signatures. The identified discriminative subgraphs will help the new programmer to identify the location of bugs in the program statements. The above experiments show that our approach has improves the runtime drastically by reducing 60% of manual labelling and, also provides better precision and recall. This approach helps the programmers for a faster and efficient method to identify the bug signatures.
9. REFERENCES [1] Xie, T., Thummalapenta, S., Lo, D., & Liu, C. (2009). Data mining for software engineering. Computer, 42(8), 55-62. [2]Cook, Diane J., and Lawrence B. Holder, eds. Mining graph data. John Wiley & Sons, 2006. [3]Jiang, Chuntao, Frans Coenen, and Michele Zito. "A survey of frequent subgraph mining algorithms." The Knowledge Engineering Review 28, no. 01 (2013): 75105. [4] Eichinger, Frank, Klemens Böhm, and Matthias Huber. "Mining edge-weighted call graphs to localise software bugs." In Machine Learning and Knowledge Discovery in Databases, pp. 333-348. Springer Berlin Heidelberg, 2008. [5]Lo, David, Hong Cheng, Jiawei Han, Siau-Cheng Khoo, and Chengnian Sun. "Classification of software behaviors for failure detection: a discriminative pattern mining approach." In Proceedings of the 15th ACM SIGKDD international conference on Knowledge discovery and data mining, pp. 557-566. ACM, 2009.
IJCATM : www.ijcaonline.org
[6] Cheng, Hong, David Lo, Yang Zhou, Xiaoyin Wang, and Xifeng Yan. "Identifying bug signatures using discriminative graph mining." In Proceedings of the eighteenth international symposium on Software testing and analysis, pp. 141-152. ACM, 2009. [7] Yan, Xifeng, Hong Cheng, Jiawei Han, and Philip S. Yu. "Mining significant graph patterns by leap search." In Proceedings of the 2008 ACM SIGMOD international conference on Management of data, pp. 433-444. ACM, 2008. [8] Kong, Xiangnan, Wei Fan, and Philip S. Yu. "Dual active feature and sample selection for graph classification." In Proceedings of the 17th ACM SIGKDD international conference on Knowledge discovery and data mining, pp. 654-662. ACM, 2011. [9] Yan, Xifeng, and Jiawei Han. "gspan: Graph-based substructure pattern mining." In Data Mining, 2002. ICDM 2003. Proceedings. 2002 IEEE International Conference on, pp. 721-724. IEEE, 2002. [10] Jin, Ning, and Wei Wang. "LTS: Discriminative subgraph mining by learning from search history." In Data Engineering (ICDE), 2011 IEEE 27th International Conference on, pp. 207-218. IEEE, 2011. [11] Menzies, Tim, Jeremy Greenwald, and Art Frank. "Data mining static code attributes to learn defect predictors." Software Engineering, IEEE Transactions on 33, no. 1 (2007): 2-13. [12] http://eclipsefcg.sourceforge.net/ Tutorial for CFG generator, Eclipse plugin [13] http://codecover.org/documentation/references/eclMan -ual.html Tutorial for Code Cover tool, Eclipse plugin
36