OSA/OFC/NFOEC 2011
JWA53.pdf JWA53.pdf
A Novel Monitor Placement Algorithm for Accurate Performance Monitoring in Optical Networks M. Angelou1,2 , Y. Pointurier3 , S. Azodolmolky1,2 , D. Careglio1 , S. Spadaro1 and I. Tomkos2 1 Universitat 2 Athens
Polit`ecnica de Catalunya, C/ Jordi Girona, 1-3. 08034 Barcelona, Catalunya, Spain. Information Technology, 19.5km Markopoulou Ave., 19002 Peania, Athens, Greece. 3 Alcatel-Lucent, Bell Labs, Route de Villejust, 91620 Nozay, France. email:
[email protected]
Abstract: We propose a novel monitor placement algorithm that reduces significantly the number of monitors required to accurately assess the QoT of all lightpaths established in an optical network, compared to other monitor placement methods. © 2010 Optical Society of America OCIS codes: (060.4250) Networks; (060.4510) Optical communications
1.
Introduction
Optical impairment and performance monitors are essential to ensure Quality of Service (QoS) in high capacity optical networks by providing failure management and Quality of Transmission (QoT) assessment capabilities [1]. A technique presented in [2] allows to estimate end-to-end performance metrics of lightpaths (such as OSNR or Q factor) using only a small number of monitors, thereby enabling operators to reduce the associated cost of deployment and at the same time monitor accurately the network performance. In [3], we showed how monitoring devices can compensate the inaccuracy of analytical QoT computations in impairment aware routing decisions, but we did not specify a particular monitor deployment strategy. In this work we present an efficient heuristic to place a given number of impairment monitors in an optical network, where missing information is estimated using the linear estimator presented in [2]. Monitor placement is done at network design time, in order to facilitate performance monitoring at network operation time. We show on a 46-link network that our heuristic returns accurate performance estimates with only 15 monitors, down from 35 or more with other monitoring placement techniques. 2.
Estimation Framework and Monitor Placement Heuristic
Placing a monitor at the end of a lightpath provides a real-time measurement of an end-to-end performance metric of that lightpath (e.g. OSNR). To find the optimum monitor locations, the proposed algorithm utilizes the following idea: it is possible to use monitoring measurements collected from a subset of the network lightpaths to estimate accurately the corresponding end-to-end metric of the lightpaths that are not monitored. In order to estimate the QoT metrics using the partial monitoring data, we exploit an estimation framework known as “network kriging” (NK) [2]. NK is a linear estimator and applies to any “link-additive” performance metric. A performance metric is considered link-additive if it results from the sum of the metrics corresponding to the links traversed by the lightpath. The Chromatic Dispersion (CD; through the residual dispersion), the Polarization Mode Dispersion (PMD; through the average squared differential group delay), the nonlinear phase, and the inverse of OSNR are examples of physical impairments that are link-additive. Each of the mentioned metrics can be effectively measured by physical monitors. In fact the authors of [4] combined the aforementioned 4 parameters (i.e., CD, PMD, nonlinear phase, and 1/OSNR) to estimate the QoT of the lightpaths for establishment purposes. The monitor placement method presented herein is applicable to any link-additive metric; the results presented in the numerical section assume OSNR monitoring. In [2] the problem of monitor placement was tackled using an algebraic technique based on QR-decompositions of matrices (further denoted as the QR technique). Here we propose the “Pseudo-Eye” (PE) placement algorithm defined in Alg. 1. In PE it is assumed that each link is a possible monitor location and is fitted with either a real monitor or a “pseudo-monitor”. A pseudo-monitor uses the NK framework to estimate the corresponding performance metric based on the measurements from the real monitors located in other links. Given a network topology (graph G(V, E), set of nodes V , set of links E), a set of planned (routed) lightpaths L and a number m of (hardware) monitors that an operator is willing to deploy in the network, the algorithm computes the optimal (in terms of QoT estimation accuracy) locations for each of the m monitors. To achieve this, the algorithm first assumes that all network links are equipped with monitors, and then replaces the monitors that contribute least to the accuracy of the performance metric estimation by NK, with pseudo-monitors.
OSA/OFC/NFOEC 2011
JWA53.pdf JWA53.pdf 5. 6. 7. 8. 9. Using E and L: let B be the sorted list of links in descending 10. 11. busyness. 12. M = B; P = 0; / c=0; for j ∈ B (from least to most busy link) M 0 = M\{ j}; P0 = B ∪ {M 0 };
Inputs: graph G(V, E), set of nodes V , set of links E, lightpaths L, desired number of monitors m, accuracy threshold ε. Outputs: M ⊂ E: hardware monitor locations, P ⊂ E: pseudomonitor locations. 1. 2. 3. 4.
c0 =RMSE(G, M’, P’); if c0 ≤ ε; M = M 0 ; P = P0 ; c = c0 ; end if if |M| = m; return; end if end for for j ∈ M cost( j)=RMSE(G, M\{ j}, B ∪ {M 0 }); end for Rank cost(.) in descending order to place monitors on the m − |M| links with lowest RMSE cost.
Algorithm 1: Pseudo-Eye (PE) monitor placement algorithm.
A pre-processing phase sorts the links in ascending “busyness” (line 1). We measure the busyness of a link through the number of lightpaths that terminate at that link. Intuitively a link that is the destination point of many lightpaths is a suitable candidate location for monitor placement. In the first phase (lines 3-8), we iteratively replace (with pseudomonitors) the monitors that, if kept, would not improve significantly the estimation accuracy, as follows. We tentatively replace each monitor in turn, starting with the monitor on the least busy link, and assess the estimation accuracy of the remaining monitors and the pseudo-monitors. The estimation accuracy is measured through the root mean square error (RMSE) kyˆ − yk, where k.k denotes the regular `2 -norm and assuming for instance OSNR monitors, y is a vector of the OSNR of all the lightpaths established in the system and yˆ is a vector containing the OSNR of the lightpaths that terminate at monitors (monitoring data is available) as well as the OSNR of the other lightpaths, which are estimated using the NK technique (monitoring data is not available). If the replacement of a monitor with a pseudo-monitor maintains the overall RMSE below a predefined threshold ε, then we proceed with this replacement. Note that the values of vector y to which the estimates yˆ are compared, are computed analytically a-priori and are used as the ground truth; there is no need for actual monitoring measurements. This first phase stops as soon as m monitors are left (placement is done), or when only M < m monitors pass the RMSE threshold test. In this case, more monitors (m − M) need to be replaced. Hence, in a second phase (lines 9-12), we compute, for each of the remaining M monitors, the RMSE for the whole network, should that monitor be replaced by a pseudo-monitor. We combine the “best” m − M monitors from phase 2, that is, the monitors that minimize RMSE, with the M monitors from phase 1 to obtain the locations of m monitors. 3.
Numerical Results
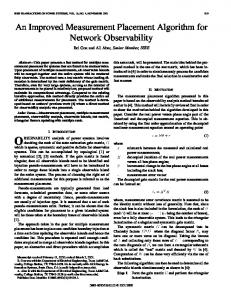
The reference topology used for the evaluation of our placement algorithm is the backbone network of Deutsche Telekom (DT) consisting of 14 nodes and 46 unidirectional links, meaning 46 possible monitor locations. Along with the PE and QR [2] methods, we investigate an elementary technique that merely places the m monitors at the m busiest links (BL) when given a specific traffic matrix. PE, QR, and BL are also compared to a random placement method. Fig. 1 depicts the (averaged) relative RMSE for the OSNR (i.e., kyˆ − yk/kyk) resulting from the solutions retrieved for 50 different traffic demand sets. The input demand sets were generated randomly each corresponding to a unit load defined here as 182 lightpaths (i.e. 1 lightpath per pair of nodes on average). In addition, for the random placement algorithm, results are given for 50 different random placements for each of the 50 input demand sets. Relative RMSE measures the accuracy of the estimates for the lightpaths that are not monitored and hence, indirectly, measures the performance of a placement technique. A good placement technique should place monitors at strategic locations such that OSNR of unobserved lightpaths can be estimated accurately; a low relative RMSE indicates a more powerful placement. When monitors are placed with PE, performance estimates are more accurate than with QR and BL, demonstrating that with 15 monitors (that is with only 1/3 of all possible 46 locations), it is possible to accurately estimate (within 1%) the corresponding QoT metric everywhere in the network. To illustrate the relation of PE and QR to the induced traffic we extended the same scenario for traffic load up to 3 (3 lightpaths on average per pair of nodes), i.e. 546 lightpaths. As shown in Fig. 2 the PE technique is independent of the traffic load, yielding very low estimation error (1%) for 15 monitors or more at all loads. The accuracy of QR is also load-independent but QR needs at least 35 monitors to achieve the same 1% accuracy as PE. An operator may want to be able to improve monitoring accuracy by simply adding monitors to the network, and not having to move monitors across locations. Hence, we investigated whether the placement algorithms are “incremental”, that is, if the set of monitors returned by an algorithm for a request of m locations is a subset of the set of monitors returned by the same algorithm when run for a request of m0 > m locations. Fig. 3 illustrates the locations of PE and QR for 15 and 20 monitors, for a unit load. As before we repeated the experiment 50 times and the most frequent locations returned by the placement algorithm are depicted. Although these two schemes return almost the same locations, the small
OSA/OFC/NFOEC 2011
JWA53.pdf JWA53.pdf
0.4 PE Placement QR Placement Busy Link Placement Random Placement
0.35
0.2 QR
0.15
0.25
Relative RMSE
Relative RMSE
0.3
0.2
0.15
0.1
0.05 0.1
PE
0.05
0
3
0 5
5
10
15
20
25
30
2.5 10
15 20 25 Number of Monitors
35
2 30
1.5 35
Traffic Load
1
Number of Monitors
Fig. 1: OSNR estimation is more accurate when monitors are placed using the PE heuristic.
Monitor Pseudo−monitor
Fig. 2: The estimation accuracy for PE and QR is not affected by the network load.
Monitor Pseudo−monitor
Monitor Pseudo−monitor
Monitor Pseudo−monitor
5 new monitors
5 new monitors
(a) PE, m = 15
(b) PE, m = 20
(c) QR, m = 15
(d) QR, m = 20
Fig. 3: Monitor locations of the PE and QR for m = 15 and m = 20 monitors for the DT network. An operator willing to upgrade its infrastructure can simply install additional monitors without changing the locations of the existing.
differences in their solutions account for the significant advantage of PE over QR in terms of accuracy. We checked on more complete data that both PE and QR are close to incremental. For example in the experiment shown in Fig. 3 the monitor locations for a request of m = 15 monitors is a subset of the monitor locations for a request of m = 20 monitor locations for both PE and QR. 4.
Conclusions
We presented an efficient monitor placement algorithm that returns the optimum locations in terms of monitoring accuracy and can reduce the number of required hardware monitors in a network, compared with other placement methods (down from more than 35 to only 15 on our 46-link network for a monitoring accuracy of 1%). Our algorithms are almost incremental, meaning that an operator is able to simply add (rather than both add and move) monitors to a network to improve monitoring accuracy. This work has been partly supported by the European Commission through the FP7 CHRON project and the Spanish Ministry of Science and Innovation through the DOMINO project (TEC2010-18522). References 1. 2. 3. 4.
N. Sambo, et al., IEEE/OSA J, Opt. Commun. Netw. 2 (11), Nov. 2010. D. B. Chua, et al., IEEE J. Sel. Areas Commun. 24, 2263-2272 (2006). S. Azodolmolky et al., in Proc. OFC/NFOEC 2010, paper OMM4. F. Cugini, et al., IEEE/OSA J. of Lightwave Technol. 26, 3318-3328 (2008).