A NOVEL SIMILARITY BASED CLUSTERING ALGORITHM FOR GROUPING BROADCAST NEWS Oktay Ibrahimov1 , Ishwar Sethi1 , and Nevenka Dimitrova2 1
Intelligent Information Engineering Laboratory Department of Computer Science & Engineering Oakland University, Rochester, MI 48309 {ibrahimo, isethi}@oakland.edu 2
Philips Research 345 Scarborough Road Briarcliff Manor, NY10510-2099
[email protected]
ABSTRACT The goal of the current paper is to introduce a novel clustering algorithm that has been designed for grouping transcribed textual documents obtained out of audio, video segments. Since audio transcripts are normally highly erroneous documents, one of the major challenges at the text processing stage is to reduce the negative impacts of errors gained at the speech recognition stage. Other difficulties come from the nature of conversational speech. In the paper we describe the main difficulties of the spoken documents and suggest an approach restricting their negative effects. In our paper we also present a clustering algorithm that groups transcripts on the base of informative closeness of documents. To carry out such partitioning we give an intuitive definition of “informative field of a transcript” and use it in our algorithm. To assess informative closeness of the transcripts, we apply Chi-square similarity measure, which is also described in the paper. Our experiments with Chi-square similarity measure showed its robustness and high efficacy. In particular, the performance analysis that have been carried out in regard to Chi-square and three other similarity measures such as Cosine, Dice, and Jaccard showed that Chi-square is more robust to specific features of spoken documents.
1. INTRODUCTION The field of multimedia information retrieval has seen a phenomenal growth in the last decade. In spite of the fact, that researchers from the various disciplines including image and speech processing, machine learning and pattern recognition, natural language processing, and information retrieval achieved really phenomenal results, demand on new methods that would be more robust and more accurate are still on the table. The main problem challenging researchers from so many fields is unstructured nature of audio, video data. The early efforts in this field were focused mainly on analyzing images and videos. These efforts have led to a set of powerful methods for video segmentation [1,2], keyframe extraction [3,4], camera motion characterization etc., [5]. However, the experience has been that no single modality of a mu ltimedia document alone can yield rich enough content indices to build multimedia information retrieval systems that can satisfy the needs of a broad range of users. Consequently many researchers have explored the use of closed captions and audio to build more useful and reliable content indices [6-8]. While the methods analyzing closed caption text are closely tied to video analysis, the situation in the case of audio is different. Since an audio document can exist on its own, for example the recording of a radio broadcast, or as an integral part of a multimedia document, for example the soundtrack of a video or TV news broadcast, the interest in methods for analyzing audio documents have consequently focused on two main directions. First, there are researchers who have looked at soundtracks to build indices that can complement information extracted from the picture-track of a video. Examples of work in this category include several general audio data classification schemes that have been proposed to segment an audio document into coherent chunks of different types of audio classes – music, speech, speech and music etc., [9-13]. The second group of
researchers has been more interested in generating transcripts of audio documents through automatic speech recognition and their analysis for automatic indexing [14-18]. These have been mainly reported at TREC (Text Retrieval Conference organized annually by National Institute of Standards and Technology) under the label of Spoken Document Retrieval [19-21]. These efforts have shown the possibility of applying automatic speech recognition technology to audio broadcasts to perform indexing and retrieval with a good degree of success. However, the success of many of these methods depends upon a variety of factors including the size and quality of transcription. Further we will discuss distinctive features of spoken documents and difficulties that they can cause. We will also present a new similarity measure and clustering algorithm, which have been designed to deal with those difficulties.
2. SPOKEN VS. WRITTEN TEXTUAL DOCUMENTS Analysis of the nature of spoken documents showed that, generally, an automatically transcribed text suffers from several additional problems not present in a prepared or written text. The most important sources of difficulties are listed below: r
Transcription errors - occurrence of irrelevant, erroneous words in transcripts caused by drawbacks of speech recognition process;
r
Usage of grammatically incorrect sentences – typical for a conversational speech;
r
Usage of a slang vocabulary – typical for a conversational speech;
r
OOV problem – the actuality of the Out-Of-Vocabulary problem is justified by daily growth of Natural Languages and active usage of new words by people over conversations;
r
Ill-defined boundaries between different topics – appearance of not related passages in a document as a result of poor segmentation;
r
Implied knowledge – typical for conversational speeches and broadcast reports. It is supposed that information addressees are aware of the subject of the discussion;
r
Short length documents – spoken documents containing 15-20 word length passages significantly restrict the recognition capabilities of the applied techniques;
r
Topic confusion (or overlapping topics) – when, for example, several people discuss an event or a movie with remembering analogous stories happened with their acquaintances.
r
Term mismatch – when the same information is delivered by different sets of words. It has been observed that two people use the same term to describe the concept in less that 20% of the cases [22].
r
Combination of the above mentioned problems.
Our experiments with transcript processing showed that occurrence of the listed above difficulties can seriously restrict capabilities of the text processing methods applied in classic IR systems. Thus, the challenge is to reduce the negative impact of the mentioned above difficulties.
3. TRANSCRIPT PROCESSING METHODS: BASIC PRINCIPLES AND DEFINITIONS Since spoken or transcribed textual documents belong to the category of erroneous and informatively ill-structured textual documents, researchers, while designing transcript processing techniques, try to take into consideration both features: transcripts are textual documents, and they are erroneous and ill-structured. Our explorations have showed that while some popular transcript processing techniques are based on strict mathematical ground; others have only intuitive justifications. Thus, the state-of- the-art techniques used in the field could be classified as follows: r
Approaches based on Vector Space representations of documents;
r
Approaches based on Natural Language Models;
r
Approaches using automatically generated summaries;
r
Approaches employing “Transcript - Named Entities” associations;
r
Approaches associating a transcript with the speakers’ ID;
r
Combination of the mentioned above techniques.
In our present research proposal we are mostly focused on a Vector Space representation of documents, but we will also take advantage of some ad hoc techniques that can improve the total performance of the applied method. 3.1 Vector Space representation of textual documents Vector Space representation of documents or Vector Space Model (VSM) is among the first formal models that was effectively used for proximity estimation between textual documents [23]. In VSM it is assumed that there is a vocabulary of orthogonal terms and all documents are represented as points in an n-dimensional space of terms. Thus, every document is treated to be a vector, where elements of the vector are weights assigned to the terms from the vocabulary. Weights of the terms show their significance in a document. In order to get more accurate weights, documents are passed through stemming and stopping pre-processing stages. The goal of stopping procedure is to remove common and consequently uninformative words. The goal of a stemming algorithm is to substitute the variety of word forms by the stem form to reduce term redundancy in a document [24]. At present there are a number of well-known methods that have been developed to term weighting [25,26]. The basic idea of the most popular term weighting techniques consists in tying term frequency (tf), which shows the number of occurrences of a term within a text, with inverse document frequency (idf) that concerns about term occurrences across a collection of texts. The intuitive meaning of idf is that terms, which rarely occur over a collection of texts, are more valuable. In our current project we apply Okapi method [25], which is a modification of a classic tf*idf weighting scheme [37] and proved to be efficient in a number of applications [14,17]. Once vector representation of documents is given, one can evaluate distances or proximities between them. There are two options for getting distances: in a given high-dimensional space or in projected low-dimensional space [27,28]. Traditional techniques used for proximity estimation between textual documents include Cosine, Dice, and Jaccard similarity measures. The basic idea behind all these techniques consists in calculating similarities on the base of cooccurring in the matched documents words. The similarity values range from 0.0 to 1.0 with 1.0 indicating identical vectors.
3.2 Cosine, Dice, and Jaccard similarity measures As it was mentioned earlier, Cosine, Dice, and Jaccard similarity measures are the most widely used techniques applied for evaluation of proximities between textual documents. The basic idea of these techniques consists in the fact that they use frequencies of co-occurring or common words to calculate similarities between documents. Similarity values, that are also called coefficients, range from 0.0 to 1.0 with 1.0 indicating identical vectors. The formulas (1)-(3) show how these coefficients are calculated. N
Dice coefficient:
SD (di , d j ) =
2 × ∑ (wki × wkj ) k =1
N
N
k =1
k =1
(1)
∑ wki2 + ∑ w2kj
N
Jaccard coefficient:
SJ ( di , d j ) =
∑ (wki × wkj ) N
k =1 N
N
k =1
k =1
k =1
∑ wki2 + ∑ w2kj − ∑ ( wki × wkj )
(2)
N
Cosine coefficient:
SC (d i , d j ) =
∑ (wki × wkj ) k =1 N
N
k =1
k =1
(3)
∑ wki2 × ∑ wkj2
In these formulas d i , d j denote two processed documents, and wki , w kj stand for vector components of the documents. N is a total number of terms in a given vocabulary. Experiments with these functions showed that Jaccard coefficient penalizes a small number of shared words more than Dice coefficient. In other words, the Jaccard coefficient gets lower value in comparison with Dice when the number of common words is a few. The Cosine coefficient is identical to the Dice coefficient for vectors with the same number of non-zero entries, but it penalizes less in cases where the number of non-zero entries is very different [29].
3.3 Chi-square similarity measure As it was mentioned earlier, transcripts or spoken documents suffer from the problems not present in written or prepared texts. To restrict the negative impacts of those problems we have designed a novel similarity measure based on Chisquare method, which implements the following steps: 1. 2. 3. 4.
Transcript intersection: Determine the intersection through word co-occurrences between matching transcripts. Information contribution: Evaluate the amount of information contributed by every matching document to the intersection. Informative closeness: Assess informative closeness of overlapping words; Similarity measure: Calculate the similarity of matching documents.
In our approach we make an assumption that the amount of information contained in a document could be evaluated via summing the amount of information contained in the member words. Similarly, the amount of information contained in some part of a document might be evaluated via summing the amount of information contained in the corresponding words. For words, we assume that the amount of information conveyed by a word can be represented by means of the weight assigned to it. As it was stated earlier, in our approach we use the Okapi technique [25], which has proved to be efficient in a number of applications [15,17]. 3.3.1 Transcript Intersection According to the Okapi method, we should calculate the Combined Weight of a word using formula (1):
CW ( wi | D j ) =
( K + 1) * CFW( wi ) * TF ( wi , D j ) K * ((1 − b) + b * NDL(D j )) + TF ( wi , D j )
(1)
N ) is the collection frequency weight, N is the total number of documents and n ( wi ) is the n (wi )
where CFW( wi ) = log(
number of documents containing the word wi . The quantity TF ( wi , Dj ) is the frequency of word wi in the document Dj and NDL( Dj ) is the length of the document Dj normalized by the mean document length. The empirically determined constant b controls the influence of document length and is equal to 0.75. Another constant K may be viewed as a discounting parameter on the word frequency: when K is 0, the combined weight reduces to the collection frequency weight; as K increases the combined weight asymptotically approaches tf*itf [25]. In our case K is equal to 2. Now, in accordance with assumptions stated above, we can easily get the weight of a document and weights of any of its parts via applying the formula (2). DW ( Di ) =
∑CW (wk )
wk ∈X i
(2)
To obtain co-occurring words between documents, we consider the fact that not all words in documents are equally informative. Further, we take into account the rather high probability for erroneous words found in automatically transcribed documents. Thus, we first sort all words in transcripts by their weights and retain only those whose weights are greater than some preset threshold (this threshold has been determined empirically). These words are the only words considered for co-occurrence. By doing this we make a tacit assumption that there is a little chance for erroneous words to appear in a text in systematic way and as a result they should get less weight and, in general, not appear in the top of the sorted words [38]. 3.3.2 Information Contribution As the words appearing in the intersection of documents generally convey different amount of information with respect to the documents to which they belong, we estimate the amount of information conveyed by every document to the intersection (3): INTER( Di , Dj ) =
DW ( Di ∩ D j )
(3)
DW (Di )
It is easy to derive from (3) the following inequality, which will be generally true when Di ≠ D j . INTER(Di , D j ) ≠ INTER( Dj , Di )
(4)
3.3.3 Informative Closeness Having determined the common words, we next evaluate informative closeness of the words appearing in intersection. This is done by representing the matching documents via their histograms. To evaluate informative similarity of the words belonging to the intersection in respect to matching documents, we apply Chi-square technique in a slightly reverse way. To carry out this step, we use the assumption that words wk of the document Di with the corresponding weights CW ( wk | wk ∈ Di ) constitute the set of words with the expected distribution of weights, and, the same words wk' but belonging to the document Dj with the weights CW ( wk' | wk' ∈ D j ) constitute the set of words with the observed distribution of weights. Finally, we assume that null hypothesis, stating that two sets fit each other with some value of significance, is true. Thus, we can determine the significance value making our hypothesis true. Through calculating by formula (5) chi-square values for observed and expected sets of words, and matching the value of χ 2 with the critical values for χ 2 through the standard table, we can easily find a significance value δ that will make our null hypothesis true. χ2 =
∑
w k ∈Di ∩ D j
(CW (wk | wk ∈ Di ) − CW ( wk | wk ∈ D j )) 2 CW (wk | wk ∈ Dj )
(5)
Now having all necessary components we can calculate the similarity between two matching documents applying the formula (6): sim(Di , D j ) = δ * INTER(Di , D j )
(6)
Obviously, for similarities (6) we have the following inequality, which will get the value 1 if and only if Di = D j : 0 ≤ sim( Di , D j ) ≤ 1
(7)
4. TRANSCRIPT CLUSTERING The basic goal of our clustering algorithm is to identify and group together informatively close documents in a stream of transcripts. To perform such grouping in an unsupervised manner, we have explored the use of above similarity measure
in a sequential clustering procedure with the notion of “informative field” of a document. By informative field we reflect the range of information provided by a document. A cluster is, thus, a set of documents with “similar informative fields”. We consider two documents D i and D j to be informative similar if sim(Di , D j ) > τ , where τ is some threshold. In our case
τ =0.15.
The basic idea of the algorithm consists in determining of centers of distinguishing informative fields – centroids – and then finding the related documents. The centroids in our case are also documents with the condition that a document chosen as a centroid of a cluster occupies the most of the information field associated with the cluster. The main steps of the clustering algorithm are as follows: 1.
Let k=1 be the index of the current cluster under construction, and i=1 be the index of the current document.
2.
Suppose that document D i is the centroid C k* of cluster k.
3.
Determine all documents, which are similar to C *k using the similarity measure described in 2.4.
4.
Among all documents Dj determined in the previous step, find the document which gives the lowest value for the following ratio: Di0 = min { j
Let
sim( D j , Ck* ) } sim(C *k , D j )
(8)
i 0 be the index of the document thus found.
5.
If i ≠ i 0 , assign the value of i 0 to i and go to the step 2.
6.
Otherwis e, the centroid for the current cluster has been found. Mark all documents determined at the step 3 as members of the cluster k and increment k.
7.
Find the first document that doesn’t belong to any clusters determined earlier and set its index to i. Go to the step 2.
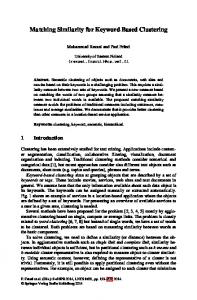
The figure 1 presents a principal diagram reflecting the core of the algorithm.
Initial document Temporal centroid Centroid Informatively close documents
Figure 1.
Thus, as it could be seen from the diagram the basic idea of the algorithm consists in finding the most informative transcripts, which are considered to be centroids, and establishing links between centroids and other informatively relevant documents.
5. EXPERIMENTAL RESULTS To evaluate the performance of the suggested similarity measure and clustering algorithm, we have conducted a number of experiments. In the current paper we will present results of experiments run with broadcast news transcripts obtained from Linguistic Data Corporation (LDC) [30]. In section 5.2 we will present results of the performance analysis that we have performed for Chi-square similarity measure and other with popular similarity measures such as Cosine, Dice and Jaccard. 5.1 Experiments with various types of transcripts In our experiment with broadcast news transcripts we used transcripts from TDT 2 Careful Transcription Text Corpus, LDC catalog number LDC2000T44 [43]. The TDT2 corpus was created to support three TDT2 tasks: find topically homogeneous sections (segmentation), detect the occurrence of new events (detection), and track the reoccurrence of old or new events (tracking). The corpus contains 540 transcriptions of the broadcast news from ABC and CNN from January through June 1998 and of Voice of America (VOA) news broadcasts from March through June 1998. To assess robustness of the techniques presented in the paper we selected an arbitrary subset of transcripts from the TDT 2 corpus. These were manually clustered. The set of selected documents contained 202 documents with an average length of 72 words per document. Then we applied our algorithm to the same set of transcripts to obtain the clusters of documents automatically. The clusters thus obtained were compared with clusters formed manually to determine the precision and recall values. For reference continence, the information contained in clusters has been summarized and assigned to them as a topic name. So, the table 1 presents the results for one group of topics. Examples of documents appearing in one of the clusters mentioned in Table 1 are given in figure 2. The transcript in the top box is the story most representative the cluster shown. The transcripts in the other boxes are two other stories from the same cluster. Table 1
Precision
Recall
Iraq, UN sanctions
100%
100%
Iraq, M. Albright’s Talks
100%
100%
US Sanctions against Iraq
100%
100%
M.Lewinsky, B.Clinton Case
100%
85.8%
India, Nuclear Bomb Test
100%
100%
Stock Market Report
100%
100%
Weather Reports, Storm
100%
100%
Cluster 32 : Stock Market reports(9 documents) CNN19980114.1600.1011.utf sim=0.995 In fact, a second wind of sorts in the stock market this afternoon, the final hour of trading, by the closing bell the Dow Jones Industrials finished near their highs of the day up fifty-two and a half points at seventy-seven eighty-four in very active trading. The broader market indices all posted gains as well, and the NASDAQ composite continuing to move higher, it is up six and half points. Shares of Intel, however, fell one and a half at seventy-five and seven-sixteenths after the chip giant said its profit margins will shrink in the near term.
CNN19980108.2130.0 960.utf sim=0.197 With the Asian markets still losing ground, the Dow Jones industrial average took a sharp dive today, falling ninety-nine points to close at seventy-eight oh two.
CNN19980126.1600.1022.utf sim=0.299 In any case blue chip stocks breaking a three day losing streak. Investors remain cautious and kept the Dow Jones Industrials in moderate rate trading range for most of the day. The Dow did manage to close higher by twelve points, at seventy-seven twelve. The broader markets closed however mostly lower, weakness in the technology sector dragging the NASDAQ composite down fourteen points. And bonds surged as the dollar gained strength, the thirty year treasury up one and four thirtyFigure Subset of has documents in Stock Reports cluster seconds of a point in 3. price. That the yieldappeared back down to fiveMarket point eighty-nine percent.
Figure 2.
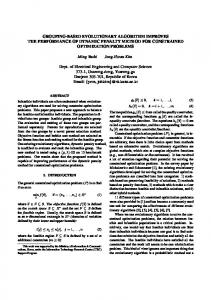
One of the uses of transcript clustering is to identify topics and events in an archived collection of news stories. The main difference between a topic and an event is that an event refers to a group of related incidences that occur in a narrow spatio-temporal window. In contrast a topic implies a group of events with common theme. With this distinction in mind it would be more appropriate to characterize the rows of Table 1 as indicative of events rather than topics although we did not use any explicit temporal information. For example there are several stories related to topic "Iraq" but we are able to separate them into three distinctive sets of stories. In fact, the results of Table 1 are comparable to those reported by Yang et al, using the TDT1 corpus. 5.2 Experiments with four similarity measures Results described in previous section showed robustness of Chi-square similarity measure. We managed to get clusters with high degree of precision – above 90% in average – even for transcripts with Word Error Rate (WER) around 6080% [31]. In our next group of experiments we tried to compare performances of Chi-square with other popular similarity measures such as Cosine, Dice, and Jaccard. Our experiments have showed that Chi-square similarity measure is more robust and consistent to specific features of spoken documents compared with its counterparts [44]. For example, while the passage like: “India tested two more nuclear bombs, defying President Clinton, who announced economic sanctions on India in response to those tests. The _U_S Secretary of Defense Bill Cohen says the world could be in for a new arms race” is usually confusing for other similarity measures, as they find a high similarity between the passage and the documents discussing defense activities of Mr.Clinton or Mr.Cohen carried out against, let say, Iraq, the Chi-square similarity measure in our experiments constantly linked it with documents related to nuclear tests in India. In our experiments with similarity functions we used 350 transcripts from TDT 2 Careful Transcription Text Corpus, LDC catalog number LDC2000T44 [30] that have been manually marked. Then we selected 11 topics for analysis, and applied sequentially all described above steps for four similarity measures varying threshold τ . In our experiments we noticed that when τ is lower than 0.11 the purity of clusters is too low. When τ is above 0.19 the number of clusters is unreasonably high. So we decided to test our functions with τ ranging from 0.11 to 0.19 and with step equal to 0.02. In our experiments we obtained different number of clusters for every selected topic when we varied similarity measures. In average we obtained more clusters when employed Chi-square and Jaccard similarity measures compared with Dice and Cosine. However, analysis of clusters showed that the Chi-square similarity measure has a tendency for more detailed and more accurate analysis of documents and it can produce additional subclusters. The histogram in figure 3 presents the average precision obtained for every selected topic over five experiments with various threshold values. As it is could be seen from the histogram Chi-square similarity function produces, in average, higher precision compared with Cosine and Dice and compatible results compared with Jaccard similarity measure. However, our analysis has also showed that Jaccard similarity measure produces in average larger number of clusters compared with Chi-square and in some cases the number of clusters is unreasonable. The average number of clusters produced by every similarity measure is illustrated on the histogram in figure 4.
Figure 3. Average Precision of clusters
Figure 4. Average number of clusters per topic
6. SUMMARY A novel clustering algorithm and method to measure similarity between documents has been presented in this work. The suggested techniques have been designed to cope with imperfectly transcribed documents. The presented techniques have been applied to broadcast news transcripts and showed high performance. Experiments with four similarity measures showed that Chi-square similarity measure is more robust to the specific features of the spoken documents compared with the Cosine, Dice and Jaccard similarities. The results suggest that the presented similarity measure and the clustering algorithm are robust and effective.
ACKNOWLEDGEMENTS The support of Philips Research is gratefully acknowledged.
REFERENCES 1.
U. Gargi, R. Kasturi, and S.H. Strayer, Performance characterization of video-shot-change detection methods. In IEEE Transaction on Circuits and Systems for Video Technology, Vol. 10, No.1, pp. 1-13, February 2000.
2.
N. Patel and IK Sethi, Video Shot Detection and Characterization for Video Databases. In Pattern Recognition, Vol. 30, pp. 583-592, April 1997.
3.
M.M. Yeung and B.-L. Yeo, Video visualization for compact presentation and fast browsing of pictorial content. In IEEE Transaction on Circuits and Systems for Video Technology, Vol. 7, No. 5, pp. 771-785, October 1997.
4.
K.Y. Kupeev and Z. Sivan, An algorithm for efficient segmentation and selection of representative frames in video sequences. In Proceedings of SPIE Conference on Storage and Retrieval for Media Databases, pp. 253-261, San Jose, USA, January 2000.
5.
Y.P. Tan, S.R. Kulkarni, and P.J. Ramadge, Rapid estimation of camera motion from compressed video with application to video annotation. In IEEE Transaction on Circuits and Systems for Video Technology, Vol. 10, No. 1, pp. 133-146, February 2000.
6.
H.D. Wactler, A.G. Hauptmann, M.G. Christel, R.A. Houghton, and A.M. Olligschlaeger, Complementary video and audio analysis for broadcast news archives. In Communications of the ACM, Vol. 43, No. 2, pp. 42-47, February 2000.
7.
T. Sato, T. Kanade, E.K. Hughes, M.A. Smith, and S. Satoh, Video ocr: indexing digital news libraries by recognition of superimposed captions. In Multimedia Systems, Vol. 7, pp. 385-394, 1999.
8.
S. Tsekeridou and I. Pitas, Audio-visual content analysis for content-based video indexing. In Proceedings IEEE International Conference on Multimedia Computing and Systems, pp. 667-672, Florence, Italy, June 1999.
9.
E. Wold, T. Blum, et al., Content-based classification, search, and retrieval of audio. In IEEE Multimedia, pp. 27-36, Fall 1996.
10. N. V. Patel and I. K. Sethi, Audio characterization for video indexing. In Proceedings of IS\&T/SPIE Conf. Storage and Retrieval for Image and Video Databases IV, pp. 373-384, San Jose, CA, February 1996. 11. M. Spina and V. W. Zue, Automatic Transcription of General Audio Data: Preliminary Analyses. In Proceedings of International Conference on Spoken Language Processing, pp. 594-597, Philadelphia, Pa., October 1996. 12. N. V. Patel and I. K. Sethi, Video Classification using Speaker Identification. In Proceedings of IS\&T/SPIE Conf. Storage and Retrieval for Image and Video Databases V, pp. 218-225, San Jose, February 1997. 13. Dongge Li, IK Sethi, N Dimitrova and T McGee, Classification of General Audio Data for Content-Based
Retrieval. In Pattern Recognition Letters, Vol. 22, pp. 533-544, April 2001. 14. Anni R. Coden, Eric W. Brown, Speech Transcript Analysis for Automatic Search, In IBM Research Report, RC 21838 (98287), September 2000. 15. Johnson, S.E., Jourlin P., Moore G.L., K.Sparck Jones, Woodland P.C., The Cambridge University Spoken Document Retrieval System. In Proc. of the IEEE International Conference on Acoustic, Speech, and Signal Processing, pp. 49-52, 1999. 16. Hauptmann, A.G, Witbrock, M.J., Informedia news on demand: Information acquisition and retrieval, In M.T. Maybury (ed.) Intelligent Multimedia Information Retrieval, AAAI Press/MIT Press, 1997, pp. 213-239. 17. Abberley, D., Renals, S., Cook G., Retrieval of broadcast news documents with the THISL system, In Proc. of the IEEE International Conference on Acoustic, Speech, and Signal Processing, pp. 3781-3784, 1998. 18. J.L. Gauvain, L. Lamel, & G. Adda (2000), “Transcribing broadcast news for audio and video indexing.” In: Communications of the ACM, 43(2).
19. Proceedings of the sixth Text REtrieval Conference (TREC-6) held in Gaithersburg, Maryland, November 19-21, 1997. 20. Proceedings of the seventh Text REtrieval Conference (TREC-7), Gaithersburg, Maryland, November 09-11, 1998. 21. Proceedings of the eighth Text REtrieval Conference (TREC-8) held in Gaithersburg, Maryland, November 17-19, 1999. 22. F.Crestani, Exploiting the Similarity of Non-matching Terms at Retrieval Time, In Information Retrieval, Volume 2, Number 1, February 2000, pp. 23-43. 23. G., Salton, Automatic Text Processing, Addison Wesley, Reading, Massachusetts, 1989. 24. M.F. Porter, An algorithm for suffix stripping. In Program, 14(3), pp.130-137. 25. S.E. Robertson, K. Sparck Jones, Simple, Proven Approaches to Text Retrieval, http://www.uky.edu/~gbenoit/637/SparckJones1.html 26. M.Singler, R.Jin, A.Hauptmann, CMU Spoken Document Retrieval in Trec-8: Analysis of the role of Term Frequency TF, In The 8th Text REtrieval Conference, NIST, Gaithersburg, MD, November 1999. 27. S.Deerwester, S.Dumais, G.Furdas, K.Landauer. Indexing by Latent Semantic analysis, J. Amer. Soc. Inform. Sci., 41:391-407, 1990. 28. M.Kurimo, Indexing Audio Documents by using Latent Semantic Analysis and SOM, IDIAP-RR 99-13, 1999. 29. Saori Kawasaki, A new hierarchical clustering algorithm for documents based on tolerance rough set model, In MD thesis, Japan Advanced Institute of Science and Technology, 2000. 30. http://www.ldc.upenn.edu/Catalog/TDT.html 31. O.Ibrahimov, I.Sethi and N.Dimitrova, Clustering of Imperfect Transcripts Using a Novel Similarity Measure, In Proc. of SIGIR-2001 Workshop, New Orleans, 2001.