PGT - A path generation toolbox for Matlab (v0.1)
Maria Nystr¨om, Mikael Norrl¨of Division of Automatic Control Department of Electrical Engineering Link¨opings universitet, SE-581 83 Link¨oping, Sweden WWW: http://www.control.isy.liu.se E-mail:
[email protected],
[email protected] 5th September 2003
OMATIC CONTROL AU T
CO MMU
NICATION SYSTE
MS
LINKÖPING
Report no.: LiTH-ISY-R-2542 Submitted to Technical reports from the Control & Communication group in Link¨ oping are available at http://www.control.isy.liu.se/publications.
Abstract This users manual introduces the basic ideas of the PGT - Path Generation Toolbox for Matlab. The main features of the toolbox is to give the user the possibility to 1) build paths in Cartesian (3DOF) space, 2) transform the Cartesian paths into jointspace. All the most important functions are explained and examples of how to use them are also included.
Keywords: zone interpolation, cartesian path, joint path, cubic splines, MATLAB functions
1
Introduction
This toolbox is intended for geometrical path generation with application industrial robots. A path consists of a number of path primitives, called segments. For further information segments and how the segments relate to sections see e.g. [1] and [2]. Each section and each path is here represented by a data structure and a number of functions for path generation that operates on these have been developed.
2
Data structures
Each section is represented as a data structure with the following fields >> sec sec = pseg: cseg: zinfo: range: jsp: The Cartesian representation of the two segments that builds up the section, is stored in the fields pseg (previous segment) and cseg (current segment). Information about the zone path generation is stored in zinfo. Each section has an index. Four different values of this index are stored in the range field: the index value at the beginning of the section, the index value in the middle of the zone, the index value at the end of the zone and finally, the index value at the end of the section. An index value at a certain point is equal to the length of the section from the beginning of the section to that point. If the section has been transformed to a path in joint space, the joint space path is stored in the jsp (joint space path) field.
2.1
The segment field
Information about the segments in Cartesian coordinates is stored in a data structure with the following fields >> sec.pseg ans = type: descr: range: tdi:
or
>> sec.cseg
1
The segment type is stored as a two character string in the type field. Predefined types are ’sp’, which represents a spline, ’ci’, which is a circular arc, and ’em’, which represents an “empty” segment containing just one point. A mathematical description of the segment can be found in descr. This field will have different appearances for different segment types. The index value for each segment at the end of the first zone and at the beginning of the second zone, is stored in the range field. Here, the index of a point represents the length of the segment from the beginning of the segment to that point. Finally time dependent information for the segment is stored in the tdi field.
2.2
The zone information field
Necessary zone information is stored in a data structure named zinfo, which has the following fields >> sec.zinfo ans = segindex: ztype: To be able to construct the zone, normalized indices, for the two points where the zone intersects the segments, are needed. These values are stored in the segindex length to zone intersection point field. The indices are calculated as . The ztype entire segment length field contains a number, which determines what interpolation method to use when creating the zone path. If for example ztype = 1 a parabolic path is received.
2.3
Path data structure
Several sections can be gathered to form a complete path. A path data structure has the following fields >> rpath rpath = descr: range: descr is an array containing the section data structures. At the point where each section ends, the length of the path is stored in the range field, beginning with the value zero. range is consequently a vector of size “number of sections”+1.
2
2.4
Information for transformation to joint space
For the transformation from Cartesian coordinates to joint space, a number of variables must be given specific values, and a number of functions, for different types of calculations, must be specified. This information is gathered in a data structure stored in a separate file. The data structure must have the following fields robot: a complete robot description. brp: number of breakpoints in each spline function. maxerror: maximum deviation of the desired Cartesian path from the actual robot path. delta: initial length between the breakpoints. ikine: function handle for inverse kinematic calculations. The result should be a [3x1] vector. dq.method: function handle to a function that differentiates the joint angles with respect to the index in a given point. The result should be a [3x1] vector. dq.var: Optional variable. Given as argument to the function specified by dq.method. aidx.method: function handle to a function that handles the adjustment of the length between the breakpoints. The result is the new length, i.e. a float. aidx.var: Optional variable. Given as argument to the function specified by aidx.method. The robot description should be generated with Robotic Toolbox, see [3]. An example of the data structure can be found in the file infofcn.m.
3
3
Functions
Syntax Description Example
sec = emptysec(p); Creates an empty section with just one point p. Is used as psec in moveline and movecirc when creating the first section on a path. Creation of a start point with coordinates [1 0.02 0.35] >> esec = emptysec([1 0.02 0.35]) esec = cseg: [1x1 struct] range: 0
Syntax Description
Example
sec = moveline(psec,p,zone,f,tdi); Creates, in Cartesian coordinates, a line section connected to the section psec. The section ends at the point p, which is enclosed by a zone of radius zone. The zone radius must be smaller than half the length of each segment in the zone. What interpolation method to use when creating the zone path in the first zone, around the last point of psec, is defined by the number f. If psec is an empty section, f can be omitted and will then be given the value zero. Time dependent information for the line segment can be given with the parameter tdi. Creation of a line section where psec is the empty section created in the emptysec example above, and the end point is p= [0.7 0.2 0.4]. The radius of the zone around the point p is 0.1 meters. f is omitted while the section does not start with a zone. >> lsec = moveline(esec,[0.7 0.2 0.4],0.1) lsec = pseg: [1x1 struct] cseg: [1x1 struct] zinfo: [1x1 struct] range: [0 0 0 0.2534]
4
Syntax Description
Example
sec = movecirc(psec,p1,p2,zone,f); Creates, in Cartesian coordinates, an arc section connected to the section psec. p2 specifies the last point on the arc and p1 an intermediate point. p2 is enclosed by a zone of radius zone. The zone radius must be smaller than half the length of each segment in the zone. The path in the first zone, around the last point of psec, is defined by the number f. If psec is an empty section, f can be omitted and will then be given the value zero. Time dependent information for the circle segment can be given with the parameter tdi. Creation of a circle section which is connected to the line section created in the moveline example. The radius of the zone around the point p2 is 0.1 meters. The interpolation method to use in the zone around the first point, defined by psec, is given by f = 1. This gives a parabolic path. The radius of this zone was specified in the moveline example. >> csec = movecirc(lsec,[0.85 0.35 0.45],... [0.74 0.49 0.5],0.1,1) csec = pseg: [1x1 struct] cseg: [1x1 struct] zinfo: [1x1 struct] range: [0 0.0605 0.1271 0.3621]
Syntax Description
Example
rpath = makepath(sec1 , . . . , secn ); Creates a path with the sections sec1 , . . . , secn where sec1 is the first section of the path and secn the last. No check will be made to see whether the sections are connected to each other or not. Empty sections are not allowed. Creation of a path with the sections created in the moveline and movecirc examples >> rpath = makepath(lsec,csec) rpath = descr: [1x2 struct] range: [0 0.2534 0.6155]
5
Syntax Description
Example
rpath = appendpath(rpath,sec); A section given by sec is appended to the path rpath. No check will be made to see whether the path and the section are connected to each other or not. A section created as sec = moveline(csec,[0.35 0.6 0.5],0.1,1) is being connected to the path created in the makepath example >> arpath = appendpath(rpath,sec) arpath = descr: [1x3 struct] range: [0 0.2534 0.6155 1.0210]
Syntax Description
Example
value = evalsec(sec,x,ac); Evaluates the section sec at the point given by index x, which must satisfy x ∈ sec.range. The accuracy in the zone is given by ac which can be omitted. Default value is then 10−7 . The section created in the movecirc example is evaluated at the point given by index 0.09 with accuracy 10−6 if within a zone. >> value = evalsec(csec,0.09,1e-6) value = 0.7645 0.2122 0.4036
Syntax Description
Example
value = evalpath(rpath,x,ac); Evaluates the path rpath at the point given by index x, which must satisfy x ∈ rpath.range. The accuracy in the zone is given by ac which can be omitted. Default value is then 10−7 . The path created in the makepath example is evaluated at the point given by index 0.42 with accuracy 10−6 if within a zone. >> value = evalpath(rpath,0.42,1e-6) value = 0.8202 0.2618 0.4198
6
Syntax Description
Example
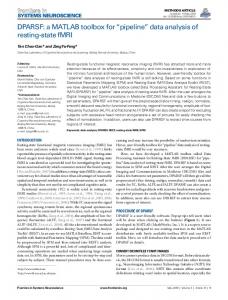
plotsec(sec,f,ac); Plots the section sec in Cartesian coordinates. ac, which is an integer, relates to the number of points plotted in the figure. If f = 1, only the actual path of the robot will be drawn. If f = 2 the parts of the segments inside the zone will also be drawn, and if f = 3, only the segments will be drawn and not the actual path. f and ac can be omitted. Default value for f is 1 and for ac 50. The section created in the movecirc example is plotted. >> plotsec(csec)
0.48
0.46
z
0.44
0.42
0.4
0.38 0.5 0.4
0.86 0.84 0.3
0.82 0.8 0.2
0.78 0.76 0.1
y
0.74
x
Figure 1: Function plotsec Syntax Description
Example
plotpath(rpath,f,ac); Plots the path rpath in Cartesian coordinates. ac, which is an integer, relates to the number of points plotted in the figure. If f = 1, only the actual path of the robot will be drawn. If f = 2 the parts of the segments inside the zone will also be drawn, and if f = 3, only the segments will be drawn and not the actual path. f and ac can be omitted. Default value for f is 1 and for ac 50. The path created in the makepath example is plotted with f = 2. >> plotpath(rpath,2)
0.48 0.46 0.44
z
0.42 0.4 0.38 0.36 0.34 0.5 0.4
1 0.95
0.3
0.9 0.85
0.2
0.8 0.75
0.1 y
0
0.7 0.65
x
Figure 2: Function plotpath Syntax Description
tdi = gettdi(rpath,x); The information stored in the tdi field of a segment, defined by index x, is returned. The path or section rpath contains the segment.
7
Syntax Description
sec = getfsec(rpath); Returns the first section of the path rpath.
Syntax Description
sec = getlsec(rpath); Returns the last section of the path rpath.
Syntax Description
sec = getsec(rpath,i); Returns the i:th section of the path rpath.
Syntax Description
value = dsec(sec,x,h); Differentiates the section sec, in Cartesian coordinates, with respect to the c) path index, i.e. dP(l dlc , and returns the first derivative evaluated at the point given by index x. If inside a zone the derivative is calculated with finite different approximation otherwise an analytical solution is given. H is the distance between the points in the finite different approximation. H can be omitted and will the be given the value 10−6 . The section created in the movecirc example is differentiated and evaluated in the point given by index 0.12.
Example
>> value = dsec(csec,0.12) value = 0.7764 0.5992 0.1957 Syntax Description
Example
value = d2sec(sec,x,h); Calculates the second derivative of the section sec, in Cartesian coordinates, 2 P(l ) c , and returns the second derivative with respect to the path index, i.e. d dl 2 c evaluated at the point given by index x. If inside a zone the derivative is calculated with finite different approximation otherwise an analytical solution is given. H is the distance between the points in the finite different approximation. H can be omitted and will the be given the value 10−6 . The section created in the movecirc example is differentiated and evaluated in the point given by index 0.12. >> value = d2sec(csec,0.12) value = -0.8178 0.8860 0.5775
8
Syntax Desrcription
Example
nrpath = cart2jsp(rpaht,fcnhandle,’fieldname_1’, value_1,...,’fieldname_n’,value_n); Transforms the Cartesian path or section rpath to cubic spline functions in joint space. Returns the path or section object nrpath, which is equal to rpath but with a description of the path in joint space attached. fcnhandle is a function handle to a function generating information necessary for the transformation, see also 2.4. If the information is to be changed temporarily, this can be done by specifying the field name that should be changed and then specifying the new value. The path created in the makepath example is to be transformed into joint space. Information about the transformation is received from the function handle @infofcn. The maximum deviation of the generated robot path from the desired Cartesian path, is temporarily set to 10−5 meters. >> nrpath = cart2jsp(rpath,@infofcn, ’maxerror’,1e-5) nrpath = descr: [1x2 struct] range: [0 0.2534 0.6155]
Example
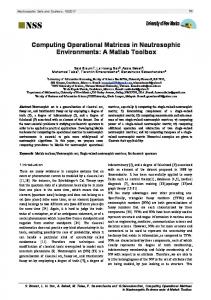
plotbrp(rpath,f); Plots the breakpoint locations for the path rpath in joint space. If f is present the zone borders are marked with dotted lines. The breakpoints for the path created in the cart2jsp example is being plotted with the zone borders marked. >> plotbrp(nrpath,1)
2.5
2
1.5
1
rad
Syntax Description
0.5
0
−0.5
−1
−1.5
0
0.1
0.2
0.3
0.4
0.5
0.6
0.7
l
c
Figure 3: Function plotbrp
9
Syntax Description
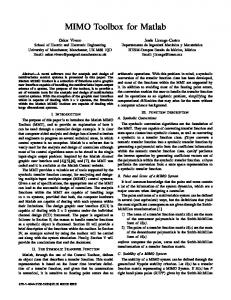
plotjder(rpath,d1,d2,f); Plots the first and second derivative of a path or section in joint space, which is stored in rpath. The plots are created at a number of calculation points, which are all at distance d1 from each other for the first derivative, and distance d2 for the second derivative. Default value for d1 and d2 is 0.005 meters. If f is present the zone borders are marked with dotted lines. The joint space path created in the cart2jsp example is differentiated and plotted with d2= 0.001.
Example
>> plotjder(nrpath,[],0.001)
2
80
1.5
60
40
1 20
0.5
2
d q/dlc
2
dq/dlc
0
0
−20
−40
−0.5
−60
−1 −80
−1.5 −100
−2
0
0.1
0.2
0.3
0.4
0.5
0.6
0.7
−120
0
0.1
0.2
0.3
lc
(a)
0.4
0.5
0.6
0.7
l
c
dˆ q dlc
(b)
ˆ d2 q dl2 c
Figure 4: Function plotjder Syntax Description
Example
plotcder(r,rpath,d1,d2,f); Points on the path or section in joint space, given by rpath, is transformed back to Cartesian space using forward kinematics. The norm of the first and second derivative are then calculated with finite different approximation and plotted. r is the robot for which the path is constructed. d1 is the distance between the calculation points for the first derivative and d2 the same for the second derivative. Default value for d1 and d2 is 0.005 meters. If f is present the zone borders are marked with dotted lines. The joint space path created in the cart2jsp example is plotted with plotcder with the zone borders marked. The robot is generated with the function r3fcn. >> plotcder(robot,nrpath,[],[],1)
10
70 1.002
1.0015
60
1.001
50 1.0005
40 dp/dlc
d2p/dl2c
1
30
0.9995
0.999
20 0.9985
10 0.998
0.9975
0
0.1
0.2
0.3
0.4
0.5
0.6
0
0.7
0
0.1
0.2
0.3
0.4
0.6
0.7
c
c
(a)
0.5
l
l
ˆ dP dlc
(b)
ˆ d2 P dl2 c
Figure 5: Function plotcder
Example
plotce(r,rpath,d,f); Points on the path or section in joint space, given by rpath are transformed to Cartesian coordinates and the compared to the desired Cartesian path or section, also given by rpath. The norm of the error are then plotted. r is the robot for which the path is constructed. d is the distance between the calculation points and if f is present the zone borders are marked with dotted lines. The joint space path created in the cart2jsp example is compared to the desired Cartesian path with d = 0.001 and the zone borders marked. The robot is generated with the function r3fcn. >> plotce(robot,nrpath,0.001,1)
−5
1
x 10
0.9
0.8
0.7
0.6 error
Syntax Description
0.5
0.4
0.3
0.2
0.1
0
0
0.1
0.2
0.3
0.4
0.5
0.6
0.7
lc
Figure 6: Function plotce
11
3.1
Demo functions
Syntax Description
r3 = r3fcn; Uses Robotic Toolbox, [3], to construct a three-link robot.
Syntax Description
infofcn; Generates an example of the data structure described in Section 2.4.
3.2
Functions for use in cart2jsp
Syntax Description
theta = ikina(r,T); Calculates the inverse kinematics using geometric inspection for a three-link robot r defined by the function r3fcn. For each point defined by the homogeneous transformation matrix T four different solutions are given. At the end of the program one of these is returned. With that, theta is a [4 × 3] matrix.
Syntax Description
dq = fda(r,sec,q,x,ST); Approximates the derivative of the joint space path q(lc ) with respect to the c) path index using finite different approximation, i.e. q(lc +h)−q(l . r is the robot h for which the path is constructed. sec is the section in Cartesian coordinates, q is the joint angles where the derivative is to be evaluated, i.e. the value of q(lc ) in the equation above, and x is the value of lc at that point. ST has two fields: ST.h and ST.@fcnhandle. h is the distance between the two points in the finite different approximation and this value must be smaller than the maximum allowed deviation error. @fcnhandle is a function handle to a function for inverse kinematic calculations. Returns a [3 × 1] vector.
Syntax Description
dq = diffinvjac(r,sec,q,x,ST); Differentiates the joint space path q(lc ) with respect to the path index using dq(lc ) −1 dP(lc ) where J is the Jacobian. r is the robot for which the path v dlc = Jv dlc is constructed. sec is the section in Cartesian coordinates, q is the joint angles where the derivative is to be evaluated and x is the value of lc at that point. The variable ST is not used. Returns a [3 × 1] vector
12
Syntax Description
value = varic(delta,er,maxer,ST); Adjusts the length between the breakpoints in a spline. delta is the current length between the breakpoints. er is the current deviation error and maxer is the maximum allowed deviation error. The variable ST contains two values. ST(1) is the smallest value that the current length will be multiplied with and is used if the step length is to be increased. ST(2) is the smallest value that the current lenght will be reduced with and is used if the step length is to be reduced. Returns a float.
Syntax Description
value = fixic(delta,er,maxer); Adjust the length between the breakpoints in the spline with a fix set of adjustment factors. delta is the current length between the breakpoints. er is the current deviation error and maxer is the maximum allowed deviation error. Returns a float.
3.3
How to add new zone paths
The zone path is defined by a number when the section is created. This number then determines how the zone path is generated. New methods for generating zone paths can be added to the existing ones. This is done in the file czindex.m. The new method is given an integer value and the index calculations are inserted into the file. For more information about how the zone paths is created see [1] and [2].
References [1] M. Nystr¨om and M. Norrl¨of. Path generation for industrial robots. In Mekatronikm¨ote 2003, G¨oteborg, Sweden, Aug 2003. [2] M. Nystr¨om. Path generation for industrial robots. Master’s thesis, Link¨oping Institute of Technology (LiTH), Link¨oping, Sweden, April 2003. In Swedish. [3] P.I. Corke. A robotics toolbox for MATLAB. IEEE Robotics and Automation Magazine, 3(1):24–32, March 1996.
13
Datum Date
Avdelning, Institution Division, Department
Division of Automatic Control Department of Electrical Engineering
Rapporttyp Report category
Spr˚ ak Language 2 Svenska/Swedish X 2 Engelska/English 2 .......................
2 2 2 2 X 2 2
Licentiatavhandling Examensarbete C-uppsats D-uppsats ¨ Ovrig rapport .......................
URL f¨ or elektronisk version
2003-09-05
ISBN ............................................................................................... ISRN ............................................................................................... Serietitel och serienummer ISSN Title of series, numbering 1400-3902 ............................................... LiTH-ISY-R-2542
http://www.control.isy.liu.se
Titel Title
PGT - A path generation toolbox for Matlab (v0.1)
F¨ orfattare Author
Maria Nystr¨ om, Mikael Norrl¨ of,
Sammanfattning Abstract
This users manual introduces the basic ideas of the PGT - Path Generation Toolbox for Matlab. The main features of the toolbox is to give the user the possibility to 1) build paths in Cartesian (3DOF) space, 2) transform the Cartesian paths into jointspace. All the most important functions are explained and examples of how to use them are also included. . Nyckelord Keywords
zone interpolation, cartesian path, joint path, cubic splines, MATLAB functions