James Benson, Nele V. D'Halleweyn, William Redman-White,. Craig A. ..... 369â372. [13] R. Troutman, âVLSI limitations from drain induced barrier lowering,â.
IEEE TRANSACTIONS ON ELECTRON DEVICES, VOL. 48, NO. 5, MAY 2001
1019
A Physically Based Relation Between Extracted Threshold Voltage and Surface Potential Flat-Band Voltage for MOSFET Compact Modeling James Benson, Nele V. D’Halleweyn, William Redman-White, Craig A. Easson, Michael J. Uren, Olivier Faynot, and Jean-Luc Pelloie Abstract—Compact MOS models based on surface potential are now firmly established, but for practical applications there is no reliable link between measured values of threshold voltage and the flat-band voltage on which such models are based. This brief presents an analytical relationship which may be implemented in compact models to provide a reliable and accurate threshold parameter input. Results are compared with a conventional threshold voltage model for several SOI CMOS technologies. This technique has been developed for use with body-tied SOI transistors, and hence it can also be applied to bulk devices.
II. QUALITATIVE FEATURES OF NEW THRESHOLD MODEL
Index Terms—Modeling, MOSFET, threshold voltage.
I. INTRODUCTION Many methods have been proposed to extract the threshold voltage of a MOSFET experimentally [1]–[5]. Irrespective of the extraction technique used, the measured threshold voltage VTex , is conventionally set equal to VTH , the threshold voltage corresponding to the classical criterion for strong inversion [1]
VTH where VFB
VSB si
=
VFB +
si +
si + VSB
(1)
flat-band voltage; body factor; source-body voltage; surface potential at the onset of strong inversion, usually defined as si = 2�F
It has been proposed [2] that a more accurate correspondance between measured and theoretical threshold voltages can be obtained by subtracting several �t from VTex , where �t is the thermal voltage. However, the main objection to this approach is that it lumps all the errors into a single correction factor, so that it is impossible to separate out different contributions to the threshold shift between VTex and VTH . In this brief, we describe how the flat-band voltage can be closely related to the measured threshold voltage by means of a simple physically based expression, thereby eliminating a source of uncertainty and error in the practical application of surface potential-based models. When evaluating our new threshold relation, we will be using the linear extrapolation technique as a reference method, since it is a well-known and widely-used technique [1]–[3].
(2)
where �F is the Fermi potential. It is generally recognized that VTex will not correspond exactly to VTH ; the degree to which VTex and VTH differ will depend partly on the extraction technique used to obtain VTex . Compact models based on device surface potential (MISNAN [6], SUSOS [7], SOISPICE [8], STAG [9], and others [10], [11]) avoid such ambiguity by using the flat-band voltage, which has a clear physical definition, to determine the level of inversion in a device. However, in practise the flat-band voltage is difficult to extract experimentally, and a common alternative is to extract a value for the threshold voltage and then obtain the flat-band voltage using (1). Using an unmodified value of VTex in this way will often result in quite large deviations from the correct flat-band voltage, which in turn leads to poor characteristic matching. Manuscript received March 9, 2000; revised July 18, 2000. This work was supported by the Corporate Research Program of the U.K. Ministry of Defense, and the Honeywell Corporation. J. Benson, N. V. D’Halleweyn, and W. Redman-White are with the Microelectronics Center, Department of Electronics and Computer Science, University of Southampton, Southampton, U.K. C. A. Easson was with the Microelectronics Center, Department of Electronics and Computer Science, University of Southampton, Southampton, U.K. He is now with Maxim Integrated Products, Sunnyvale, CA 94086 USA. M. J. Uren is with the Defense Evaluation and Research Agency, Malvern, U.K. O. Faynot and J.-L. Pelloie are with CEA-LETI, Grenoble, France. Publisher Item Identifier S 0018-9383(01)03263-4.
In order to derive a more satisfactory relationship, several adjustments must be made to the standard treatment. These can be summarized in the following three statements. 1) Since experimental threshold voltage extractions are made using a nonzero drain voltage, the new treatment must account for the influence of a finite drain voltage on the measured threshold voltage. We will use VDex to designate the drain voltage at which VTex is extracted. 2) The new treatment must also account for the fact that the value of the extracted threshold voltage usually corresponds to a surface potential which has a value greater than 2�F . For this purpose, we will use an empirical parameter �0 , which expresses the additional surface potential as an fraction of �F . The optimal value of �0 will vary between different extraction techniques and process technologies; as a result, analytic derivation of �0 is not possible. We shall show in this study how it is possible to minimize the range of values which �0 can take, by using the new model to account for the different contributions to the threshold shift. In this way, empirical optimization can be kept to an absolute minimum. 3) Finally, when deriving the standard relation given in (1), it is assumed that the inversion charge is negligible compared with the body charge. This is valid when the surface potential is equal to 2�F , but beyond this point, the inversion charge will rapidly become comparable to the body charge. It is therefore not valid to discount the influence of this charge component, especially for larger values of �0 . III. DERIVATION OF NEW MODEL We will derive the new relation for the case of a body-tied NMOS SOI MOSFET, so that VSB = 0. A small measurement drain voltage VDex is applied to the device. Applying Gauss’ law across the front gate provides us with the standard relation
VGfS
=
f + (y ) 0 VFB s
qtot (y ) Cof
(3)
where VGfS front gate voltage referred to the source/body; f VFB SOI front-gate flat-band voltage; surface potential; s qtot total body charge density. These last two quantities are functions of channel position, as a result of the applied drain voltage.
0018–9383/01$10.00 © 2001 IEEE
1020
IEEE TRANSACTIONS ON ELECTRON DEVICES, VOL. 48, NO. 5, MAY 2001
Let us now consider the new form of si , the strong inversion surface potential corresponding to VTex . Statements 1 and 2 in Section II outline the two primary mechanisms by which si (VTex ) and si (VTH ) differ. Since the presence of a drain bias makes the surface potential dependent on channel position, we simplify the treatment by averaging VDex over the entire channel. To account for the shift in surface potential due to VDex , we recall that in strong inversion, the drain voltage can be added to the gate induced surface potential [2]. This yields the following form for si : si = (2 + �0 )�F + 0:5VDex :
(4)
The surface potential corresponding to VTex is a constant value, which is necessary since VTex is itself independent of channel position. The next step is to derive an expression for qtot which is also position independent. Because we cannot neglect the inversion charge (Statement 3 in Section II), it is insufficient to simply approximate qtot using the expression for the body charge density, as is done in the standard treatment. Instead, we solve the 1-D form of Poisson’s equation in the vertical direction [2], and by again averaging the drain voltage over the channel, we obtain the following result:
qtot
=
0 Cof
si + �t exp
si
0 2�F 0 0:5VDex �t
:
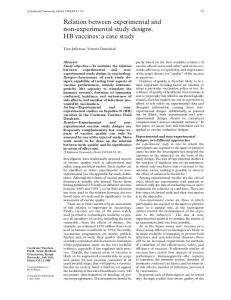
Fig. 1. Comparison of measured data with simulation results using new and standard threshold relations (Technology A).
(5)
Under the new strong inversion condition (3) can be written as
VTex
=
f + VFB
si
0 Cqtot : of
(6)
Substituting (4) and (5) into (6) and rearranging gives us the final result
f VFB
=
VTex 0
si
0
si + �t exp
�0 �F �t
(7)
where si is defined in (4). For a particular measured device, with a set f , we would therefore expect V value of VFB Tex to increase as VDex is increased.
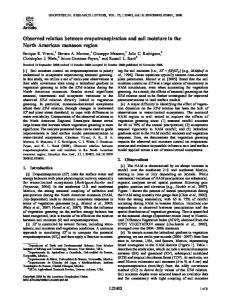
Fig. 2. Comparison of measured data with simulation results using new and standard threshold relations (Technology B).
IV. EXPERIMENTAL EVALUATION OF MODEL Whilst VTex and VDex can readily be obtained from measurement data and substituted directly into in (7), finding an appropriate value to use for �0 is less straightforward. This parameter can be expected to vary between different process technologies and extraction techniques; however, we can attempt to set ranges on �0 for a given extraction procedure. This was done for the linear extrapolation technique, by testing against a number of different process technologies, and the range of �0 was found to be between 0.05 and 0.1. The main cause of this variation in �0 was differences in the vertical field mobility degradation, to which the linear extrapolation method is susceptible [5]. The range was found to be valid for both NMOS and PMOS devices, although for any given technology, NMOS and PMOS usually had different optimal values of �0 . From this range, we can set a minimum default value of 0.05 for �0 , which we then use as an initial estimate whenever VTex is obtained using the linear extrapolation method. With �0 set, we can now evaluate the accuracy of the new threshold relation. Measured threshold voltages, extracted for a number of different process technologies, were used directly in a surface potentialbased compact SOI model, STAG [9], to reproduce measured Ids -Vgs curves. Figs. 1 and Fig. 2 compare the new and standard treatments against experimental data, for two technologies. In each case, the new treatment shows a clear improvement over the standard model. Empirical selection of a standard default value for �0 , combined with the new drain voltage model, allows us to close much of the gap between
VTH and VTex without resorting to optimization. Any adjustment of �0 to further improve the fit can therefore be made within a much tighter range of values than would otherwise be the case. Of course, there are other extraction methods for which the range of �0 will differ from that of our chosen technique. However, once a range is established for a given technique, and a minimum default value deduced, a similar level of accuracy can be achieved, with optimization of �0 only being required for final fine tuning. In order that �0 can be confined to a small range of values, it is important that other effects which can also act to shift the threshold voltage are accounted for separately, otherwise these contributions will be lumped into �0 . Such effects include charge sharing [1], and polysilicon gate depletion [12]. For the work described in this brief, these additional effects have been accounted for where appropriate. That the model does succeed in accounting for the effect of the measurement drain voltage can be demonstrated using Fig. 3. Each of the experimental curves plotted on the figure was obtained by applying a different drain voltage VDex when performing the measurement, and from each curve we can extract a corresponding value for VTex . Not only do the results agree qualitatively with the new theory, insofar as VTex does indeed go up with increasing VDex , but there is excellent quantitative agreement as well. Starting with an optimized value of �0 = 0:08, it is possible to reproduce all of the measured curves very precisely, using any one of the five pairs of VTex =VDex values. In
IEEE TRANSACTIONS ON ELECTRON DEVICES, VOL. 48, NO. 5, MAY 2001
1021
an extraction-modeling design flow outlined. One empirical parameter is used, which can often be taken as a fixed default value without major error. The results show that much better agreement is obtained, and the influence of drain-source voltage in particular is handled well. Predictions have been compared with measurement using body-tied devices from several foundries, implying that the method is also usable for bulk CMOS technology. ACKNOWLEDGMENT The authors would like to thank CEA-LETI, Grenoble, France, for providing some of the measurement data used in this study. REFERENCES
Fig. 3. Comparison of measured data with simulation results using the new threshold relation, showing accurate relation between extracted threshold voltage and applied drain voltage.
other words, we can use (7) to model very accurately the variation of VTex with VDex , and be confident that any remaining discrepancy between actual and calculated flat-band voltages can be compensated for by finding the optimal value of �0 for that process. One restriction which applies to both the standard and new threshold relations is that only small drain voltages should be used when performing threshold extraction measurements, with an upper limit of �0.1 V applying in both cases. In the standard treatment, this is necessary in order to justify neglecting the effect of drain bias on the surface potential. In the new treatment, VDex must be kept small because extracted threshold voltages typically correspond to a surface potential only slightly greater than 2�F . A larger drain voltage will cause the drain end of the channel to move from strong to weak inversion. We have assumed strong inversion throughout the channel in order to obtain (4), because adding the averaged channel voltage to the gate induced surface potential becomes progressively less accurate as more of the device enters weak inversion. At even higher drain biases, the drain-induced barrier lowering (DIBL) effect will become dominant [13], and the threshold voltage will then decrease with increasing drain voltage. V. CONCLUSIONS A new relationship between extracted threshold voltage and the flat-band voltage for use in surface potential-based compact MOS models has been presented, and a procedure for its implementation in
[1] N. Arora, MOSFET Models for VLSI Circuit Simulation. New York: Springer-Verlag, 1993. [2] Y. P. Tsividis, Operation and Modeling of the MOS Transistor. New York: McGraw-Hill, 1987. [3] D. K. Schroder, Semiconductor Material and Device Characterization. New York: Wiley, 1990. [4] G. Ghibaudo, “New method for the extraction of MOSFET parameters,” Electron. Lett., vol. 24, no. 9, pp. 543–545, Apr. 1988. [5] H. S. Wong, M. H. White, T. J. Krutsick, and R. V. Booth, “Modeling of transconductance degradation and extraction of threshold voltage in thin oxide MOSFETs,” Solid-State Electron., vol. 30, no. 9, pp. 953–968, Sept. 1987. [6] A. R. Boothroyd, S. W. Tarasewiez, and C. Slaby, “MISNAN—A physically based continuous MOSFET model for CAD applications,” IEEE Trans. Comput.-Aided Design, vol. 10, pp. 1512–1529, Dec. 1991. [7] R. Howes, W. Redman-White, K. G. Nichols, P. J. Mole, M. J. Robinson, and S. Bird, “An SOS MOSFET model based on calculation of the surface potential,” IEEE Trans. Comput.-Aided Design, vol. 41, pp. 494–506, Apr. 1994. [8] D. Suh and J. G. Fossum, “A physical charge-based model for nonfully depleted SOI MOSFET’s and its use in assessing floating-body effects in SOI CMOS circuits,” IEEE Trans. Electron Devices, vol. 42, pp. 728–737, Apr. 1995. [9] M. S. L. Lee, Compact Modeling of Partially Depleted Silicon-on-Insulator MOSFET’s for Analogue Circuit Simulation. Southampton, U.K.: Univ. Southampton, Dec. 1997. [10] K. Joardar, K. K. Gullapalli, C. C. McAndrew, M. E. Burnham, and A. Wild, “An improved MOSFET model for circuit simulation,” IEEE Trans. Electron Devices, vol. 45, pp. 134–148, Jan. 1998. [11] R. van Langvelde, A Compact MOSFET Model for Distortion Analysis in Analog Circuit Design. Eindhoven, The Netherlands: Univ. Press Facilities, 1998. [12] N. Arora, R. Rios, and C.-L. Huang, “Impact of polysilicon depletion effect on circuit performance for 0.35 micron CMOS technology,” in Proc. European Solid State Device Res. Conf., Edinburgh, U.K., Sept. 1994, pp. 369–372. [13] R. Troutman, “VLSI limitations from drain induced barrier lowering,” IEEE Trans. Electron Devices, vol. ED-26, pp. 461–469, 1979.