vessels based on the vessel edge. ... edges of blood vessels by operators such as Sobel or ... segment and the dark segment was labeled as a vein when.
A PIECEWISE GAUSSIAN MODEL FOR PROFILING AND DIFFERENTIATING RETINAL VESSELS Huiqi Li, Wynne Hsu, Mong Li Lee, Hongyu Wang School of Computing, National University of Singapore, Singapore 117543 ABSTRACT Accurate measurement and identification of blood vessels could provide useful information to clinical diagnosis. A piecewise Gaussian model is proposed to describe the intensity distribution of vessel profile in this paper. The characteristic of central reflex is specially considered in the proposed model. The comparison with the single Gaussian model is performed, which shows that the piecewise Gaussian model is a more appropriate model for vessel profile. The obtained model parameters could be utilized in the identification of vessel type. The minimum Mahalanobis distance classifier is employed in the classification. 505 segments of vessels were tested. The success rate is 82.46% and 89.03% for the arteries and veins respectively.
Kirsch. The latter minimizes the distance between the original data and a predefined edge model. As edge fitting is less sensitive to noises, it is employed in vessel detection in many research works. Negative step gate function [5], blurred half-ellipse [8], and Gaussian function [3] [4] [9] have been proposed as models for vessel profiling. Among them, the single Gaussian function is the most popular model. However, it is unable to capture the central reflex (see Figure 1) which frequently occurs in retinal vessels. central reflex
Figure 1. Example of central reflex in retinal vessels 1. INTRODUCTION Retinal vessels have been known to provide useful information to clinical diagnosis and treatment. Abnormalities of retinal blood vessels are usually the first clinical finding in diabetic retinopathy [1]. Retinal vessels can be classified into arteries and veins. The arteriole-tovenular ratio that quantifies generalized retinal arteriolar narrowing in retinal images is an indication of cardiovascular diseases [2]. In order to obtain this ratio, a precise model is required for accurate vessel measurement. In addition, we need to automatically differentiate the arteries from the veins. Techniques to automate vessel detection in 2-D retinal images can be classified into two categories: window-based methods [3] [4] and tracking-based methods [5] [6]. Window-based methods estimate a match at each pixel against the pixel’s surrounding window. The tracking approach exploits local image properties to trace the vessels from an initial point. Both approaches detect vessels based on the vessel edge. 3-D reconstruction of vessels was also investigated [7], while this paper will focus on the processing of 2-D images. Two common approaches to vessel edge detection are edge detector and edge fitting. The former enhances the edges of blood vessels by operators such as Sobel or
There is not much literature on the identification of vessel types. The pixels around optic disc are assumed to have a bimodal histogram in [10]. The arteries/veins recognition is performed by a simple thresholding around disc boundary area. In [11], the recognition was performed by initial labeling and then relaxation labeling. The parallel segments were searched in the initial labeling. The label of artery was given to the brighter segment and the dark segment was labeled as a vein when the intensity difference between the two segments was large. Successful identification of arteries and veins on a large number of vessel segments has yet to be reported. In this paper, a piecewise Gaussian model is proposed to better capture the intensity distribution crossing blood vessels. Based on the model obtained, we investigate how arteries can be differentiated from veins. 2. MODELING VESSEL PROFILE The intensity distribution on the cross section of blood vessel is investigated in the green component. The green plane is the clearest in the retinal images as the red component could be saturated and the blue component is usually very dark. Some examples of the intensity distribution are shown in Figure 2. They were sampled
from 35 retinal images with the resolution of 3072×2048 pixels. We can observe that there is a central light reflex particularly for the wide vessels. The light reflex of the retinal vessel is formed by the reflection from the interface between the blood column and vessel wall. Retinal images with other resolution such as 2160×1440, 1440×960, and 768×576 pixels were studied. The central reflex can also be observed, while it is more obvious in the high-resolution images.
y = f (x) I1
A1
σ1
A2 σ2
Intensity
I2
A
m2 m1
B
x
Figure 3. Meaning of parameters in the piecewise Gaussian model The merit function that measures the agreement between the data and the model is defined as
e= 0
10
20
30
40
50
60
1 n 2 ∑ ( yi − f ( xi )) i = 1 n
(3)
Pixel number
where Figure 2. Examples of intensity distribution of vessels Formula (1) represents the single Gaussian model. −
y = − A1e
( x − m1 )2 2σ12
(1)
+ I1
where A1, m1 and σ1 are the amplitude, position of peak and width distribution respectively. The characteristic of central reflex is not considered in the single Gaussian model. We propose a piecewise Gaussian model in formula (2) to describe the intensity distribution. It consists of two Gaussian functions, which depicts the central reflex in the model as well. A1 and A2 represent the amplitude of the vessel and the reflex respectively; m1, m2 are the positions of the peaks of the Gaussian functions; σ1 and σ2 indicate width distribution, and I1 is the intensity of retinal background. The meaning of these parameters is illustrated in Figure 3. As the intensity of vessel is lower than the retinal background, there is a negative sign before A1. This is a non-lineal model considering the model’s dependence of its parameters. ( x − m1 )2 − 2σ12 + I1 − A1 e y = f ( x) = 2 ( x −m 2 ) − 2 A e 2σ 2 + I 2 2
x < A, x > B A≤ x≤ B
(2)
( xi , yi ) is the data point. Best-fit parameters are
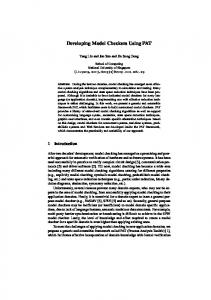
obtained by minimizing the merit function in formula (3) by Marquardt method [12]. The vessels can be considered as piecewise linear segments. The curve fitting is performed on the average intensity of five cross sections along vessel length to suppress noises. 3. DIFFERENTIATING ARTERIES AND VEINS Having obtained the piecewise Gaussian model, we can employ it in the classification of arteries and veins. The arteries appear lighter and narrower than the dark-red or purplish veins in the color retinal images. Normally the width ratio of artery to vein is about 2:3. Figure 4 shows examples of an artery and a vein in a practical retinal image. Simple thresholding will not work for the automatic identification of arteries/veins due to the uneven illumination. The pattern of the central reflex in vein and artery is different. The reflex is more apparent in arteries than in veins based on our observation. The central reflex can only be observed obviously for the wide veins. Those characters can be described by the parameters in equation (1). For example, there is a linear relationship between σ1 and the vessel diameter [9] [13]; A1 represents the darkness of the vessel, which is larger for veins than for arteries; A2 stands for the brightness of the reflex, which is larger for arteries than for veins. Those parameters obtained by model fitting are proposed to classify arteries and veins in this paper.
artery
vein
Figure 4. Examples of an artery and a vein The parameters obtained from curve fitting for the segments on the same vessel are analyzed. Experiments shows that the parameters obtained in curve fitting are quite consistent, which indicates that the parameters in the piecewise Gaussian model can describe a certain pattern of a vessel. The different pattern of arteries and veins can be observed from Figure 2, in which the first and the fourth vessel profiles from the top are obtained from segments of veins, and the center two profiles are from arteries. It is noted that the amplitude of central reflex in arteries is larger than that in veins when the vessel diameters are around the same. Based on the background knowledge, the brightness of the central reflex (A2) respective to A1 and σ1 are selected as the features to classify arteries and veins. The minimum distance classifier, which is a supervised classification, is applied in two dimensions (A2 /A1 and A2 /σ1.) Mahalanobis distance [14] is used in the classification, which scales the difference in each coordinate by the inverse of the variance in that dimension. 4. RESULTS AND DISCUSSION
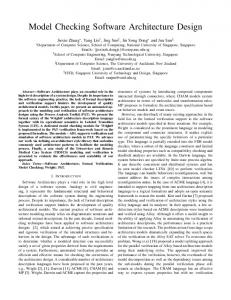
for the single Gaussian model. The fitting error is similar between the two models when σ1 is small, but the error for the single Gaussian is much larger than that of the proposed model when σ1 becomes larger. This comparison indicates that the piecewise Gaussian model describes the vessel profile better than the single Gaussian model especially when the vessels are wide (σ1 is large). The performance of the proposed model for different type of vessels is also analyzed in the Figure 6. It can be seen that the model is suitable for both arteries and veins, while the fitting error is slightly less in arteries than in veins. The different performance of the proposed model between arteries and veins is due to the more obvious central reflex in arteries. Intensity 70 vessel profile single Gaussian model piecewise Gaussian model
65 60 55 50 45 40 35 30 25 20
0
10
15
20
25
30
35
40
45
Pixel number
Figure 5. Vessel profile and the fitted models
(A) Modeling vessel profile
piecewise Gaussian model single Gaussian model piecewise Gaussian model for veins piecewise Gaussian model for arteries
e
12
The profile on the cross-section of vessels is fitted to the proposed piecewise Gaussian model. An example of the original data and the fitted curve is shown in Figure 5. The vessel profile is indicated by the crosses in the figure. The solid line represents the fitted piecewise Gaussian model and the dash line shows the fitted model of the single Gaussian function represented in formula (1). It can be observed that the residual errors for the proposed model are mainly from the periphery due to the uneven illumination of retinal background. The comparison also shows that the piecewise Gaussian model fits the intensity distribution better than the single Gaussian model as the central reflex is considered. 505 segments of vessels from different fundus images were fitted to the piecewise Gaussian model. The average squared error e defined in equation (3) corresponding to σ1 is shown in Figure 6. The solid line demonstrates the distribution of the squared error for the piecewise Gaussian model, and dash line illustrates the distribution
5
10
8
6
4
2
0
0
2
4
6
8
10
12
14
σ1
Figure 6. Average squared errors for the two models The proposed piecewise Gaussian model is closer to the actual intensity distribution of blood vessel in retinal image than the single Gaussian model. The proposed
model can be further utilized in the detection and measurement of blood vessels to give more accurate result. (B) Classification of arteries and veins 268 segments of arteries and 237 segments of veins were tested by the proposed algorithm of artery and vein identification. The results obtained by minimum Mahalanobis distance are shown in Table 1. The success rate is defined as the true positive rate, which is 82.46% for the segments of arteries and 89.03% for the segments of veins. It can be seen from these figures that the ratios of A2 /A1 and A2 /σ1 are suitable features to identification vessel type.
Artery Vein
Tested segments 268 237
Successful identification 221 211
Success rate 82.46% 89.03%
Table 1. Results of artery and vein identification The chosen of classification method should be further investigated and the test on a larger data set should be carried out to improve and verify the performance of the identification algorithm. Since the difference between arteries and veins is not obvious in small vessels, whether a vessel segment is classifiable should be evaluated in the future research. The same kinds of vessels, either arteries or veins, never cross each other and it is a rule that the vein dips below the artery at the crossing in the retinal image. This information should be utilized in the verification of the classification later. 5. CONCLUSION A piecewise Gaussian model is proposed to describe the vessel profile in this paper. The central reflex is considered in the proposed model. 505 segments of vessels were tested and the comparison shows that the proposed model gives a better description of vessel profile than the single Gaussian model. The parameters in the proposed model are employed to classify arteries and veins. The minimum Mahalanobis distance classifier is applied in the identification of vessel type. The success rate obtained is 82.46% for arteries and 89.03% for veins based on the tested vessel segments. This is the first report of acceptable vessel classification drawn on a large number of vessel segments in retinal images according to the available literature. It can be seen that the piecewise Gaussian model is a promising model to describe the vessel profile and to identify vessel types.
6. REFERENCES [1] S. S. Feman, Ocular Problems in Diabetes Mellitus, Boston: Blackwell Scientific Publications, pp. 245-267, 1992. [2] L.D. Hubbard, R. J. Brothers, et al., “Methods for evaluation of retinal microvascular abnormalities associated with hypertension/sclerosis in the atherosclerosis risk in communities studies,” Ophthalmology, Vol. 106, pp. 2269-2280, 1999. [3] S. Chaudhuri, S. Chatterjee, N. Katz, M. Nelson and M. Goldbaum, “Detection of blood vessels in retinal images using two-dimensional matched filters,” IEEE Transactions on Medical Imaging, Vol. 8, No. 3, pp. 263-269, 1989. [4] A. Hoover, V. Kouznetsova, and M. Goldbaum, “Locating blood vessels in retinal images by piece-wise threshold probing of a matched filter response,” IEEE Transactions on Medical Imaging, Vol. 19, No. 3, pp. 203-210, 2000. [5] S. Tamura, Y. Okamoto and K. Yanashima, “Zero-crossing interval correction in tracking eye-fundus blood vessels,” Pattern Recognition, Vol. 21, No. 3, pp. 227-233, 1988. [6] Y. A. Tolias, S. M. Panas, “A fuzzy vessel tracking algorithm for retinal images based on fuzzy clustering,” IEEE Transactions on Medical Imaging, Vol. 17, No. 2, pp. 263-273, 1998. [7] J. A. Fessler, “Object-based 3-D reconstruction of arterial trees from a few projections,” Ph.D. dissertation, Stanford University, Stanford, CA, 1990. [8] F. P. Miles and A. L. Nuttall, “Matched filter estimation of serial blood vessel diameters from video images,” IEEE Transactions on Medical Imaging, Vol. 12, No. 2, pp. 147152, 1993. [9] G. Luo, O. Chutatape, and S.M. Krishnan, “Detection and measurement of retinal vessels in fundus images using Amplitude modified second-order Gaussian filter,” IEEE Transactions on Biomedical Engineering, Vol. 49, No. 2, pp. 168-172, 2002. [10] J. J. Yu, B. Hung, and H. Sun, “Automatic recognition of retinopathy from retinal images,” Proceedings of International Conference of the IEEE Engineering in Medicine and Biology Society, Vol. 12, No. 1, pp. 171-173, 1990. [11] K. Akita and H. Kuga, “A computer method of understanding ocular fundus images,” Pattern Recognition, Vol. 15, No. 6, pp. 431-443, 1982. [12] D. W. Marquardt, “An algorithm for least-aquares estimation of nonlinear parameters,” Journal of the Society for Industrial and Applied Mathematics, Vol. 11, pp. 431441, 1963. [13] L. Zhou, M. S. Rzeszotarski, L. J. Singerman, and J. M. Chokreff, “The detection and quantification of retinopathy using digital angiograms,” IEEE Transactions on Medical Imaging, Vol. 13, No. 4, pp. 619-626, 1994. [14] P.C. Mahalanobis, “On tests and measures of groups divergence,” Journal of the Asiatic Society of Benagal Vol. 26, pp. 541, 1930.