A General Model of Probabilistic Packet Marking for IP Traceback Liming Lu
Computer Science, School of Computing National University of Singapore
[email protected]
Mun Choon Chan
Computer Science, School of Computing National University of Singapore
[email protected]
Ee-Chien Chang
Computer Science, School of Computing National University of Singapore
[email protected]
ABSTRACT
1.
In this paper, we model Probabilistic Packet Marking (PPM) schemes for IP traceback as an identification problem of a large number of markers. Each potential marker is associated with a distribution on tags, which are short binary strings. To mark a packet, a marker follows its associated distribution in choosing the tag to write in the IP header. Since there are a large number of (for example, over 4,000) markers, what the victim receives are samples from a mixture of distributions. Essentially, traceback aims to identify individual distribution contributing to the mixture. Guided by this model, we propose Random Packet Marking (RPM), a scheme that uses a simple but effective approach. RPM does not require sophisticated structure/relationship among the tags, and employs a hop-by-hop reconstruction similar to AMS [16]. Simulations show improved scalability and traceback accuracy over prior works. For example, in a large network with over 100K nodes, 4,650 markers induce 63% of false positives in terms of edges identification using the AMS marking scheme; while RPM lowers it to 2%. The effectiveness of RPM demonstrates that with prior knowledge of neighboring nodes, a simple and properly designed marking scheme suffices in identifying large number of markers with high accuracy.
In Distributed Denial of Service (DDoS) attacks, many compromised hosts flood the victim with an overwhelming amount of traffic. The victim’s resources are exhausted and services to users become unavailable. DDoS attacks paralyzed high-profile web sites, including Yahoo, CNN and Amazon, for hours to days in February 2000 [8]. In January 2001, DDoS attack was launched against the DNS server of Microsoft and in October 2002, DDoS attack brought down eight root DNS servers [12]. Most recently, in February 2007, a DDoS attack was launched against the DNS root servers in two phases, lasting for more than 7 hours in total [2]. During a DDoS attack, attack nodes often perform address spoofing to avoid detection. An IP traceback mechanism aims to overcome address spoofing and uncover the attack paths or sources. While traceback is motivated by DDoS attacks, it also benefits analysis of legitimate traffic. Potential applications of traceback include traffic accounting and network bottleneck identification. In Probabilistic Packet Marking (PPM), routers probabilistically mark the packets they transmit, so that the victim can trace the attack paths up to their sources, based on the packets it received[14]. A packet is marked by writing to the reusable bits in the IP header. We call the strings written as tags. In this paper, we present a general model for PPM schemes by formulating it as an identification problem, in which each node (or edge) marks packets probabilistically according to an associated distribution on tags. Based on a collection of received packets, the victim attempts to recover the markers’ identities. Since there are multiple markers, this collection is made up of samples from a mixture of the markers’ associated distributions. Hence, traceback is essentially identification of each individual distribution contributing to the mixture. By viewing each distribution as a point in a high dimensional space, we can see that this model is closely related to the studies of collusion-resistant codes and fingerprinting[6, 18]. Thus, one may choose a known collusion-resistant code to assign codewords to different markers. The main difference between traceback and other applications of collusion-resistant fingerprinting is the scale of the problem. The number of markers can be more than a thousand, which is much larger than typical applications of collusion-resistant fingerprinting. Guided by the model, we design a PPM scheme, called Random Packet Marking (RPM). The marking process is very simple, and is a direct implementation of the model. The tags do not have sophisticated structure and relation-
Categories and Subject Descriptors C.2.0 [Computer-Communication Networks]: General—security and protection; C.4 [Performance of Systems]: performance attributes
General Terms Design, Performance, Security
Keywords IP traceback, Probabilistic Packet Marking (PPM), entropy, Random Packet Marking (RPM), DDoS, network security
Permission to make digital or hard copies of all or part of this work for personal or classroom use is granted without fee provided that copies are not made or distributed for profit or commercial advantage and that copies bear this notice and the full citation on the first page. To copy otherwise, to republish, to post on servers or to redistribute to lists, requires prior specific permission and/or a fee. ASIACCS ’08, March 18-20, Tokyo, Japan Copyright 2008 ACM 978-1-59593-979-1/08/0003 ...$5.00.
INTRODUCTION
ship. For example, many existing schemes divide the allocated bits into groups and different groups have different functionalities, like hop-count, hash value etc. In contrast, RPM treats all bits equally. For reconstruction of the marker identities, RPM employs a hop-by-hop reconstruction similar to AMS. Hence, some prior knowledge of network topology is required. Simulation results show that RPM significantly outperforms AMS [16] in acquiring higher traceback accuracy. Compare to schemes based on algebraic coding [7], RPM has much lower reconstruction cost and achieves higher scalability with the number of attackers and the number of packet markers. The effectiveness of RPM demonstrates that, with knowledge of the neighboring nodes, it is not necessary to enforce structures in the tags. In fact, these structures impose constraint on the choices of tags. Without the constraint, each packet can carry more information and the chance of collision (that is, false positive) can be reduced. The rest of the paper is organized as follow. Section 2 presents related work. The general model is described in Section 3. The proposed traceback scheme and its evaluation are described in Section 4. Section 5 discusses the potential extensions of RPM. The conclusion is presented in Section 6.
2.
RELATED WORK
Existing traceback schemes can be classified into two categories. 1. Routers are queried on the traffic they have forwarded. The routers may not need to log packets. 2. The receiver locally reconstructs the attack paths from a collection of packets. Each packet carries partial path information. The packets are either probabilistically marked by routers or specially generated for traceback. The first category includes online query and variations of hash based logging schemes [15, 10]. The second category includes variants of probabilistic packet marking (PPM) [14], ICMP traceback (iTrace) [5], and algebraic encoding [7]. In iTrace, routers sample packets with a small probability. A sampled packet is duplicated in an ICMP packet, plus information of the router’s upstream or downstream neighbor forming an edge with itself. Based on the ICMP packets, the victim reconstructs the attack paths by linking up the edges. Note that routers farther away generates fewer iTrace packets to the victim. A variant of iTrace, called intention-driven iTrace [11], introduces an intension indicator to inform remote routers to raise their probability in generating iTrace packets. Instead of adding network traffic, PPM probabilistically embeds partial path information into packets. Savage et.al. [14] proposed the Fragment Marking Scheme (FMS). Two adjacent routers, forming an edge, randomly insert their information into the packet ID field. The path information thus spreads over multiple packets for reassembly. However, for multiple attack paths, the computation overhead of path reconstruction is high, due to explosive combinations of edge connections. Subsequent proposals: Advanced and Authenticated Marking Schemes (AMS) [16], Randomize-and-Link (RnL) [9], and Fast Internet Traceback (FIT) [20] improve the scalability and the accuracy of traceback. Dean et.al. [7] adopted an algebraic approach for traceback, by encoding path information as points on polynomials. The algebraic technique requires few marked packets per path for reconstruction. However, the processing delay on the marked
packets can be large if a long sequence of routers performs marking. On the other hand, if short sequences of routers perform marking, the reconstruction overhead will be large due to combinatorial search. The scheme does not scale for multiple attackers.
3.
PPM MODEL
3.1
Problem Formulation
During a DDoS attack, a victim V receives an overwhelming amount of packets transmitted over multiple paths, each at a packet rate greater than Ratt . A router along an attack path can embed information of its identity into the packet headers. We call such router a marker. Alternatively, the router can embed information of its identity and the next hop identity into the header. In this case, we treat the edge as the marker. Let U be the set of all possible markers, and M be the set of markers along the attack paths. Our goal is to identify M among U. Let m = |M|, and n = |U |. Each marker is allowed to mark L bits in a packet header1 . The PPM problem is interesting when 2L is smaller than n. The problem thus becomes how to use multiple L-bit packets to identify elements of M. We measure the performance of a marking scheme by the false negatives ratio α, which is ratio of the number of markers not correctly identified over m, and the false positives ratio β, which is the ratio of the number of markers wrongly declared as on attack paths over m.
3.2
Components of PPM
The operations of a PPM traceback scheme can generally be divided into the following components: marking of packets by the routers, choice of tags used and reconstruction using information from marked packets by the victim. In the following, for each of these components, we first present the general idea and then highlight the design of RPM.
3.2.1
Marking by Routers
In our model, each marker is associated with a distribution D on the L-bit tags. Such associations are pre-assigned and fixed throughout the marking and identification process. Consider a marker with identity i and its assigned distribution Di . When it receives a packet, the marker chooses with probability ², an L-bit tag s according to the distribution Di and mark the packet with s. The probability ² is a parameter that is the same for every marker. It is possible that some packets arrive at the victim without being marked. We assume that the bits in those unmarked packets are random and are uniformly distributed. Since the marking process needs to be very efficient, sampling from the distribution Di must be a simple operation. Thus, in RPM and other related work, only uniform distribution on a finite set is considered. Essentially, the marker just randomly and uniformly picks a tag s from a pre-assigned set. Let us write the probability density function of the distributions assigned to the marker with identity i as Di . That is, Di (x) is the probability that the tag x appears in a packet marked by i. Since we assume that the 1 Typically, as indicated in [14, 16, 7, 9, 20], the 16-bit packet identification field in the IP header is used. The packet identification field is used in less than 0.25% of the time to re-assemble fragmented packets [17].
0.16
distribution is uniform on a finite set of tags, Di (x) = 0 or c for some constants. Thus, WLOG, we can also represent Di as a subset of L-bit tags. Let us write this set as Xi where x ∈ Xi iff Di (x) > 0.
Fraction of All Paths
3.2.2
Choice of Marking
Consider a set of markers P . The collection of tags received by the victim follows a distribution which is a mixture of the distribution associated to the markers in P . Deriving the mixture distribution DP from P is not straightforward due to the effect of the probability ². Suppose that the only markers are P = {i1 , i2 }, where i1 , i2 are along the same path and i1 is nearer to the victim, then
i∈P
Thus, if X i∈P
Di (x) =
X
Dj (x),
for all x
j∈Q
then it is difficult to distinguish packets from P and Q. In such case, we say that a collision has occurred. In general, the associated Di should be chosen so as to minimize collisions, for example, using a collision-resistant code. However, due to the size of the problem, RPM employs random codes as it is more practical. For each i, the Di is generated from a random function (for example, SHA) with i as input. We will show in later section that use of random codes provides sufficiently good results. Note that given the network topology, certain sets of markers are more likely to appear compare to others. Ideally, the Di can be chosen by considering the network topology to avoid collisions. However, in practice, individual marker lacks the global topology information. Hence, a reasonable approach, as used in RPM, is to assign the Di randomly.
3.2.3
Reconstruction algorithm
Due to the large problem size, a PPM scheme needs to address both the choice of Di and the identification algorithm at the same time. Enforcing certain relationship among the tags in Di for each i can aid identification. For example, in RnL [9], all tags from a marker contain the same ”cord”. That is, a substring (the cord) of every tag from a marker is the same. An example given by [9] invests 15 bits for the cord when L = 25. Based on the cord, the received packets can be easily divided into smaller groups. Next, packets in different groups are identified independently. Since the number of packets in each group is smaller than the total number of packets, the task of identification become easier. RPM does not exploit special structure in the tags for reconstruction. Instead, it assumes prior knowledge of neighborhood nodes and uses a hop-by-hop reconstruction. Such assumptions are also made in FMS, AMS, and FIT.
0.12 0.1 0.08 0.06 0.04 0.02 0 0
5
10
15
20
25
30
35
40
Path Length
DP (x) = ²Di1 (x) + (² − ²2 )Di2 (x) + (1 − 2² + ²2 )2−L for every tag x. Consider two sets of markers, P and Q. Let DP and DQ be the distribution of the tags received from P and Q respectively. If DP = DQ then the victim is unable to distinguish whether the samples is from P or Q. If DP is close to, but different from DQ , an unreasonable large number of packets may be required to distinguish them. Hence, as an approximation, we take the mixture distribution of DP as: X DP (x) ≈ ² Di (x), for all x
Universe Sample
0.14
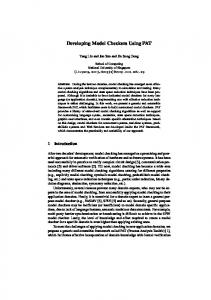
Figure 1: Path Length Distribution
3.2.4
Marking Structures of Existing Schemes
Existing schemes often divide the L-bit tags into multiple components to include structures that contains path information or aid reconstruction. If the number of unique tags generated by a marker is h, i.e. |Xi | = h, there is a dlog2 hebit component which labels the tags. Let us call it the hash index. For example, if |Xi | = 2, then the hash index starts from 00, 01, 10 to 11. In addition, there is a component that is determined from the hash index and the marker’s identity. Let us call this the hashed value. A few schemes, for example, FMS [14], AMS[16], and FIT[20], allocate 8 bits for the hashed value and 2-3 bits for the hashed index, and employ different hash functions to compute the hashed value. RnL [9] also reserves some bits for the hash index and the hash value.
3.3
Entropy of Packet Marks
One measure of the quality of a chosen Di is the entropy of the mixture of distributions received by the victim. Intuitively, uniformly random packet marks deliver highest entropy. Higher entropy carries more bits of information, which can reduce the false negatives ratio α and the false positives ratio β. Entropy measure provides a means to evaluate the performance of PPM schemes. A good marking scheme should strive to achieve high entropy packet marks. Some existing schemes trade off some entropy in the tags for easy path reconstruction; but they underperform in effectiveness. In particular, we will show that the use of hop count to indicate distance from markers to the victim results in lower entropy than uniformly random bits. The design of FMS, AMS and FIT are very similar. They allocate 8 or 13 bits for hash value, 2-3 bits to indicate the hash index, and 5-6 bits to keep the hop count from the marker to the server. AMS slightly improves over FMS on the traceback accuracy because it uses a better hash function. FIT in turn outperforms AMS by reducing hash collisions. It introduces longer hash outputs, and encodes node information instead of edge, since there are fewer nodes than edges. However, for FIT, L = 21 instead of 16. It updates 5 bits of the Time-To-Live (TTL) field, besides marking over the 16-bit packet ID field. This changes the semantics of TTL. For instance, an intermediate router can now prolong the lifetime of a packet by enlarging its TTL value. FMS and AMS utilize 5 bits of distance information to aid in the hop-by-hop path reconstruction. The entropy of such distance information is low, resulting in inefficient use of the
0.16
FMS, AMS Ideal
Fraction of All Packets
0.14 0.12 0.1 0.08 0.06 0.04 0.02 0 0
5
10
15
20
25
30
Distance
Accumulated Ratio of Packet Marks
Figure 2: Distribution of Distance Values from Packet Marks 1
Optimum RP M
0.8
RnL AMS
0.6
0.4
0.2
0 0
0.2
0.4
0.6
0.8
1
Ratio of Tags
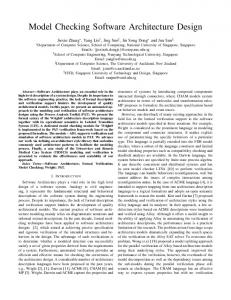
Figure 3: Packet mark value distributions
marking bits. The reasons are two-fold. First, as shown in Figure 1, the path lengths between any router and a server are averaged at around 16 hops. This result is obtained using the topology with 225,415 edges and derived from Internet mapping project. While 5 bits can represent a distance of up to 31 hops, the upper half of the distance (> 15 hops) values occur with low probability and are under-utilized. Second, the schemes allow routers to reset the distance information. Distance information embedded by remote routers are likely to be overwritten by routers closer to the victim. Again, as shown in Figure 2, the distance field ends up more frequently with small values. In sum, the distance field has lower entropy than uniformly random bits. The marking bits are not efficiently utilized by incorporating the distance information. Now we measure the performance of different PPM schemes with respect to their tags’ entropy. For comparison, we include marking schemes of AMS and RnL. RnL or randomize-and-link, uses large checksum cords to facilitate fast identification. RnL is selected because the packet marks are designed to have high randomness. The drawback of RnL is that its path reconstruction process is not scalable. The scheme RPM will be presented in Section 4. The tags it generates have an entropy very close to that of RnL, but RPM also has a scalable path reconstruction. For a fair comparison, both RnL and AMS generate 16 16-bit packet marks for each edge and have a marking probability of p = 1/16. RnL uses 10 bits for the checksum and
2 bits for a hash fragment; AMS uses 5 bits for the distance and 7 bits for the hash value. The simulation uses the same topology as the previous experiment. Every edge in the topology generates 1,000 packet marks according to the marking schemes. Figure 3 shows how the accumulated ratio of packet mark varies with ratio of tags received by the victim. Each point in the plot corresponds to a bin size of at least 1,000 distinct tags. In the ideal case, the packet marks distribution should be uniform and is shown for comparison purpose. The plot clearly shows that the distribution generated for AMS and RnL are skewed and much worse than the uniform distribution. For AMS, up to 70% of all tags are carried by a small number of packets (< 1%). RnL performs better, where about 80% of all tags are carried by 20% of the packets. Another interesting observation is that a large number of packets (> 50%) carry small portion (< 2%) of all distinct tags for both AMS and RnL. Given that the packet marks generated locally by RnL is fairly uniformly and randomly distributed, it may be surprising that the tags received by the victim is so clustered. This clustering effect can be attributed to the fact that markings are performed independently by each router. As a result, tags generated by routers close to the victim tend to be received by the victim while the routers further away tend to have their tags overwritten. One approach to increase the randomness of the tags received is to allow routers further away to mark the packets more often. However, such approach will require additional coordination and global message exchanges which are not considered in this work. Nevertheless, Figure 3 clearly shows that tags collected from RnL are much more uniformly distributed than AMS. The average entropy computed for RnL tags is 12.62 bits (out of 16) and tags from AMS has an entropy of 11.99. The entropy and distribution of tags from RPM are very close to RnL. Hence, it is expected that RnL should have much higher traceback accuracy than AMS. RPM’s traceback accuracy is expected to match RnL, but its path reconstruction process is more efficient. To verify the utility of using entropy as a measure of marking performance, 1,000 attack paths, or equivalent to over 4,650 attack edges generate tags for identification, using the parametrization above. The performance of RPM will be presented in Section 4.4. All edges in the network are tested for malice which makes the result independent of the reconstruction scheme. RnL has a false positives ratio β of 0.19, while the β for AMS is 5.56. The result clearly shows that schemes with higher entropy can achieve much better performance (lower β).
3.4
Identification and Reconstruction Effort
From marked packets, the victim wants to reconstruct the attack paths. This can be done by first identifying the markers, and then deriving the paths. Exhaustive enumeration of all subsets of markers, and estimating their respective packet rate is infeasible. To aid identification, structured information can be embedded into the tags. This information facilitates association between packet marks and the marker, or links different packet marks generated by the same marker. There are generally two assumptions made in the reconstruction, no network topology information available or available of (partial) topology information.
3.4.1
Without Topology Information
RnL is designed for a marker to transmit a message, which can be the marker’s identity. In RnL, the reconstruction of the message, or identification can be carried out without prior knowledge of the network. It associates fragments of a path information message using checksum cord. A fragment has v (3 to 6) bits, but 8 to 11 bits out of 17 is allocated to the checksum, so as to reduce the likelihood that different markers producing the same cord in the whole network. Identification uses checksum as an associative address of message fragments, as it is invariant for a message. The verification of valid fragment combinations is expensive, particularly when many markers have the same checksum. By using combinatorial search to reconstruct multiple attack paths, the scalability of RnL is limited. The algebraic approach [7] proposes an interesting way to reconstruct the attack path. In this approach, only a small number of packets is needed for reconstruction. The scheme has flexible parameterizations, with the length of a packet mark ranges from 18 to 25. It uses s bits to instantiate a random variable, and use router IP addresses as the coefficients to construct a polynomial. v bits are allocated to store the evaluated polynomial. h bits are assigned to keep track of the number of participating routers, which is translated into the degree of the polynomial. The values of v and h are tunable depending on the total number of bits allocated to a tag. The entropy of each component is high. However, the encoding and path reconstruction processes are expensive. Even though BCH decoding can be employed to find a high degree polynomial among samples, no known algorithm can efficiently identify multiple polynomials among samples. That is, its path reconstruction does not scale with multiple attack paths.
3.4.2
4.1
RANDOM PACKET MARKING (RPM)
As mentioned in Section 3.4, RnL is designed for scenarios where knowledge of the network topology is not available during identification. Without network topology, it is computationally difficult to identify large number of markers, although sufficient information is hidden in the tags. On the other hand, some PPM schemes facilitate easy identification but sacrifice some randomness in the tags, reducing the amount of information tags carry. For example, AMS
Packet Marking
We choose to employ edges as the markers. RPM works on graph structured networks. Edge encoding facilitates a hop-by-hop reconstruction of the attack graph. In this scheme, the size of the set of tags Xi (recall that x ∈ Xi iff Di (x) > 0) is the same for every marker i. Let h = |Xi |. The association of Xi to an edge i is obtained using a known hash function, for example, taking the first L bits from the output of SHA. For an edge with IP addresses IP1 and IP2 , let us represent the identity of this edge as i = IP1 kIP2 where k is concatenation. The set Xi assigned to i is { H(rkIP1 kIP2 ) | r = 1, 2, . . . , h }
With Topology Information
An example scheme that uses topology information is AMS. AMS assumes that the upstream router map is available. It subdivides the path information to track the hop count from the marker to the victim. The distance information binds different fragments of a message. It reduces the path reconstruction complexity by limiting the combinatorial search of messages to each distance. However, as shown in Section 3.3, storing distance information reduces entropy of tags. In general, reconstruction without any topology information is expensive. Hence, reconstruction with topology information is more practical. For effectiveness, it is important that the information associating tags to markers have high entropy. At the same time, using more bits to limit the search space can increase the reconstruction efficiency. In the next section, we will present our algorithm RPM that takes all these considerations into account.
4.
exploits topology information and encodes hop count to facilitate efficient reconstruction; but the entropy per tag is low. In this section, we present RPM that naturally follows from our model. RPM achieves both high entropy tags and efficient reconstruction. It does not divide a packet mark into components. All available bits are allocated to tags associated with markers. The effectiveness of RPM is influenced by the collision probability of the distributions Di . Yet RPM is general enough to support any functions in assigning Di . RPM caters for high entropy in the mixture of packet mark distributions. With a reasonable Di assignment function and a proper setting of system parameters, RPM suffices in obtaining high traceback accuracy. Its path reconstruction is lightweight and scalable, aided by the topology information. RPM improves over AMS in that its marking scheme is simple, fast, and the marks have high entropy. At the same time, RPM simplifies RnL and extends it to identify large number of markers with topology information.
where H is the hash function whose output is a L-bit sequence. For clarity, let us recall the marking process. For the marker i with the associated Xi , when a packet is received, the followings are carried out: • With probability ², randomly and uniformly picks a x from Xi , and write x into the packet header. There are two important parameters for us to determine, ² and h, which will be discussed in Section 4.3. An example 1 in our experiment takes ² = 16 , L = 16 and h = 24 . Note that the markers make decisions independently and they mark packets by overwriting existing values. It evades the potential domino effect from malicious packet mark manipulation. Even if there are compromised routers in the network, the attack paths reconstructed are reliable up to the nearest attacking routers. It improves the survivability of traceback, compared to marking schemes that rely on existing packet marks [3, 7].
4.2
Path Reconstruction
Path reconstruction finds the likely attack edges based on a collection of packet marks and connects the edges to reconstruct the attack paths. Packet marks are generated on attack and benign paths alike. Those from benign paths can be treated as noise in the reconstruction. RPM works on graph structured networks. Edge encoding facilitates a hop by hop reconstruction of the attack graph. It is assumed that
the victim has an upstream router map. This is a reasonable assumption that is also made in [16, 20]. We now describe two methods. Both methods follow the hop-by-hop approach. They differ in the choice of an evaluation function that decides whether a given edge is a marker. The first evaluation function employs a Bloom filter, which is fast to compute but some information is discarded. Specifically, it only keeps track of the unique L-bit tags that the victim received, but not the number of packets for each tag. The second evaluation function counts the number of occurrences per tag, and estimates the likelihood of an edge contributing to the tags received by the victim. In a noiseless path reconstruction, the victim is assumed to be capable of differentiating malicious packets from benign ones. For example, in TCP SYN floods, malicious packets with spoofed addresses never completely establish a network connection; whereas benign packets abide by the network protocol and their sources are responsive. The victim can process only packet marks from non-responsive sources for path reconstruction. A Bloom filter [4] is used to store packet marks received from the attackers. With sufficient packets received, the victim performs a breadth-first search on the topology to reconstruct the attack paths edge by edge. It starts by testing if the edges composed of an immediate upstream router and itself belong to the attack graph. Recall that a router’s marking behavior is fully determined by its IP address and the random identifier. The victim checks all neighboring edges, and computes for each edge the resulting packet marks. Benign edges are ruled out if not all packet marks encoding the edge are in the Bloom filter, else the edge is determined as residing on an attack path. The search continues at the identified edges until the obtained attack graph cannot be further extended. In a noisy reconstruction, the victim does not pre-process the packets to discard benign packet marks. All packet marks are supplied to the path reconcentration procedure. In the presence of noise, it is more appropriate for the victim to evaluate the likelihood of an attack edge based on the occurrence frequencies of its packet marks rather than simply based on their existence. A counting Bloom filter is used to store the occurrence frequency of each packet mark. The frequency of packet marks generated by an edge reflects the packet rate the edge experiences. If the likelihood exceeds some threshold, the edge is identified as attacking. Note that the threshold is distance dependent. Edges approaching the victim have gradually higher thresholds, because their packet marks experience lower probability of being overwritten and appear more frequently. Equation 1 shows the function used to evaluate the relative likelihood of an attack edge, f (e) =
h 1X #He,i h i=1
(1)
where #He,i measures the number of packets having mark vi of marker e. This equation computes, for a marker, the algebraic mean of the occurrence frequencies of its packet marks. Because occurrence frequency of packet marks is proportional to the packet rate, and packet rate is the differentiation criteria between benign users and attackers, the value from Equation 1 gives the relative measure of confidence in determining attackers. The pseudocodes below summarize the path reconstruc-
tion procedure. RPM Reconstruction Start at the victim’s immediate edges Compute mean(edge mark frequencies) (Equation 1) if mean ≥ threshold then Add this edge to the attack graph Move on to upstream edges end if It is assumed attackers are sending at much higher rate than non-attackers. Larger traffic rate thus provides higher confidence in identifying an attack edge. Assuming that the victim is interested in paths with packet rate greater than Ratt , the packet mark threshold for edges at distance t from the victim can be computed as 1 ²(1 − ²)(t−1) Ratt + Z h where Z is an estimated noise level. This can be estimated using the average of a few randomly chosen sets of h tags. RPM and AMS have similar reconstruction cost. Both schemes use topology information to perform a breadth-first search.
4.3
System Parameters
There are two parameters in the model we presented, ² and h. Both of them affects the identification accuracy. The number of tags h each marker should generate plays a very important role in determining a scheme’s effectiveness.
4.3.1
Choice of ²
Assuming the marking probability ² is uniform across all markers, there are two factors affecting the choice of the ² value. One is that the mixture of mark distributions must retain portions of contribution from each upstream marker, as the mixture is the basis for identifying markers. Markers d hops away from the victim has a probability of 1−(1−²)d−1 of its packet marks being overwritten. This probability drops with decreasing ²; larger portions of upstream markers’ contribution can be retained, especially for the farthest markers. The other factor for choosing ² concerns with the marking workload. Smaller ² means lighter workload for each marker. Therefore, small values are preferred for ². Generally, the values between 0.03 to 0.06 provide a good tradeoff. If ² is too small, the victim is required to handle a large amount of traffic before it can gather a converged mixture of packet mark distributions.
4.3.2
Choice of h In this section, we analyze the effect of different h on the false positives, when Bloom filter is used for reconstruction. Recall from Section 3.3 that high entropy tags facilitates high traceback accuracy. However, it is not always true that the higher the packet mark entropy, the better the traceback accuracy. Consider an extreme case where every marker holds 2L distinct tags and uniformly randomly selects them to mark packets. Entropy of the collection of tags is close to the maximum, L, but the ability to differentiate markers is lost. Bloom filter has its fill factor increases quickly with markers, if each marker has many distinct tags; so is the false positive probability. Hence the choice of h is crucial to the scheme’s effectiveness.
False Positives Ratio ( )
100
β
10 1 0.1
h=2 h=4 h=8 h=16 h=32 h=64 h=128 Optimum
0.01
0.001
Table 1: Comparison in bit allocation of PPM Schemes Scheme #Bits Path Info (x) Hash Index (L) (ID Info, Dist) (log2 h) FMS 16 (8, 5) 3 AMS 16 (8, 5) 3 FIT 16+5 (13, 1 + 5) 2 RPM 16 (16, 0) 0 1 0.9
0
2000
4000
6000
Edges False Positives Ratio
0.0001 8000
Number of Attack Edges (m )
Figure 4: Effect of marking component lengths Consider a non-attack node i. It will be wrongly classified as an attack node if all of its associated tags are received by the victim. Let βˆ be the probability that the node is wrongly classified. Since the reconstruction is carried out hop-by-hop, not all nodes in the network will be evaluated. Hence, it is not easy to relate βˆ to the false positive of the overall scheme. Nevertheless, the analysis of βˆ provides some insights on the choice of h. We do not consider false negative since the bloom filter will not miss any attacker. We assume that the tags assigned to the markers are random. Since there are m attack nodes, and each node is assigned h tags, there are a total of mh tags chosen (there are likely to have repetitions within the mh tags). We can approximate this assignment as the random assignment of mh balls into 2L boxes2 , where each box correspond to a tag. WLOG, let us assume that the first h boxes are assigned to the non-attack node i. Hence βˆ can be approximated as the probability that all the first h boxes are filled, which can be approximated by µ ¶h ³ ´h 1 − mh βˆ ≈ 1 − (1 − L )mh ≈ 1 − e 2L (2) 2 where e is the based of natural logarithm. We perform the following simulation to analyze the role of h. The same edges data set as in Section 3.3 is used. L is set to 16. Each edge generates 1,000 packets with h randomly chosen tags. For each h, 1 to over 8,000 edges are randomly chosen as malicious. The false positives ratio β is measured as the ratio of falsely accused edges to attack edges. Figure 4 illustrates how traceback accuracy varies with number of attack edges for different h. From Figure 4, when m = 4, 000, h = 8 or 16 has the lowest false positive ratio. From Equation 2, β is minimized when h = 12. When m = 8, 000, β attains minimum at h = 5. The optimal β, computed using Equations 2, achieved for various number of attackers is also shown in Figure 4. The simulation result largely agrees with the analytical model. When h = 2, β is high even with relatively small number of attack edges. However, β increases slowly as the number of attack edges increases. From Equation 2, h = 1 is the optimal setting if there are about 20,000 attack edges, with β approaches 1.66. As h increases to 24 , false posi2 The two processes are not equivalent since each marker has exactly h distinct tags.
AMS RPM
0.8 0.7 0.6 0.5 0.4 0.3 0.2 0.1 0 0
200
400
600
800
1000
1200
1400
Number of Attack Paths
Figure 5: False positives of AMS and RPM (noiseless) tive tends to be lower for number of attack edges less than 4,000. Beyond 4, β increases for large values of h. For number of attack edges from 4,000 to 8,000, h = 23 is an optimal configuration. In general, the result shows that there is an optimal number of unique tags each marker should generate given the number of attackers. However, as the number of attackers cannot be predicted, h has to be set to a value that is appropriate for the maximum attackers anticipated. Based on the analysis and simulation, it is now useful to compare the configuration of existing PPMs with the model presented. Table 1 summarizes the bit allocations for packet marks of several PPM schemes. These schemes are Fragment Marking Scheme(FMS) [14], Advanced Marking Scheme (AMS) [16], Fast Internet Traceback (FIT) [20] and our proposed scheme, Random Packet Marking (RPM). Randomize-and-Link (RnL) [9] and the algebraic encoding approach [7] both exploit more than 16 bits as L, and have flexible settings in lengths of hash index and path information (Section 3.4.1). Nevertheless, it is interesting to note that most of the schemes, including RnL and the algebraic encoding, use 2 or 3 bits for hash index, thus h is 4 or 8. For a small number of attack edges, h = 22 or 23 suffices though h = 23 is probably a better choice. With h = 23 , the schemes are optimized for more than 4,000 attack edges. For a smaller number of attack edges, h = 24 will be a better choice.
4.4
Performance
For evaluation, we compare RPM to AMS. AMS is selected as it is the most scalable among existing schemes that use 16-bit packet marks. The network topology used is drawn from the Internet Mapping Project [1] data captured on January 2006. The data set contains the route information from a source to 111,342 (∼ 216.8 ) destinations. There
800
Edges False Positives Ratio
Number of False Positive Edges
1 0.9
AMS RPM
0.8 0.7 0.6 0.5 0.4 0.3 0.2 0.1 0 0
200
400
600
800
1000
1200
RPM 600
Number of Attack Edges 500 400 300 200 100 0
1400
0
Number of Attack Paths
are 260,386 (∼ 218.0 ) unique edges or 209,582 (∼ 217.7 ) distinct nodes. The single source is used as the victim. From 100 to 1,250 nodes are randomly chosen as the sources of attack packets. They may reside anywhere in the network. The attack path packet rate is set to 1,000 packets per sec1 ond, and the benign path packet rate is set to 10 of an attack path. Each attack is simulated for 10 seconds. By then, the relative amount of different packet marks are stable, and the collection is enough to reconstruct the attack graph. 1 In the experiments, the parameters for RPM are ² = 16 and h = 16. The setting for AMS is as stated in [14], and referenced in Table 1. Simulations show that both AMS and RPM have negligible false negatives, hence their α lines are omitted from the figures. Their performances are compared only in terms of β, the false positives ratio in identifying edges. Figure 5 shows how β varies with number of attack paths in the noiseless case where only packets from attackers are considered. It can be clearly observed that AMS has exponentially increasing β with the increasing number of attack paths. When there are 1,000 attack paths, or roughly 4,650 attack edges, RPM and AMS have β values of 0.02 and 0.63 respectively. Figure 6 shows the case where packet marks from both user and attacker paths are supplied to the path reconstruction procedure. 200 user paths and varying number of attack paths are simulated. The result is similar, though both AMS and RPM have higher false positives. With 1,000 attack paths, RPM and AMS have β values of 0.09 and 1.28 respectively. The improvement can be explained by comparing the packet marks entropy shown in Figure 3. It shows that the packet entropy of RPM is very close to that of RnL, and is much higher than AMS. Figure 7 shows the number of routers falsely identified at each distance. The number of attack nodes at each distance is also shown in the figure as a reference. In the simulation, there are 1,000 attack paths and 200 user paths. At distances of 9-14 hops away, where there are many routers, AMS generates many false positives. This is because AMS cannot resolve packet mark collisions of routers at the same distance. On the other hand, RPM has small amount of false positives at all distances. Finally, Figure 8 shows β for RPM under different scenarios. The ‘RPM noisy (200 users)’ case maintains 200 normal users, varying the number of attack paths from 100
10
20
30
40
Distance
Figure 7: False positives of AMS and RPM by distance 1
Edges False Positives Ratio
Figure 6: False positives of AMS and RPM (noisy)
AMS
700
0.9
RPM Noiseless
0.8
RPM Noisy (200 Users)
0.7
RPM Noisy (200 Attackers)
0.6
AMS Noiseless
0.5 0.4 0.3 0.2 0.1 0 0
200
400
600
800
1000
1200
1400
Number of Attacker or User Paths
Figure 8: False positives of RPM to 1,250. In the figure, the x-axis represents the number of attack paths for this case. The ‘RPM noisy (200 attackers)’ case keeps a constant number of 200 attack paths, but varies the number of users from 100 to 1,250. The x-axis denotes the number of users in this case. It can be clearly seen that even in the presence of noise, RPM still outperforms AMS (noiseless) by a significant amount.
5. 5.1
DISCUSSION Gossib Attack and RPM’s Survivability
Gossib (Groups of Strongly SImilar Birthdays) attack [19] was proposed by Waldvogel. It can be used to obtain effects similar to a birthday attack on PPM traceback schemes. Gossib increases the state space for the victim to search, by randomly inserting edge fragments into the packet marks. Simultaneously, it inserts misleading edges into the attack graph. In addition, it optimizes the number of packets needed to fake the edges or edge fragments. Gossib attack appears severe to PPM traceback, for a diligent attacker can forge as many packet marks as the amount of traffic it transmits, in comparison to a PPM marker who performs the marking routine at around 1/20 of the time. However, routers can co-operate to proactively identify and filter forged packet marks, using an approach inspired by route-based distributed packet filtering (DPF) [13]. Park and Lee proposed DPF as a defense against address spoofing. A gateway router verifies the incoming addresses with
respect to the topology. When a source address is invalid against an interface, the gateway filters the packet. A number of spoofed packets can survive even with the gateway’s filtering check, which is when the spoofed addresses indeed are expected from the particular interface, but are either behind or in front of the attacker. DPF limits the number of allowed address spoofing. The paper claims with 20% of all gateway routers performing the check, the effect of address spoofing becomes contained. For RPM to defend against the Gossib attack, routers at strategic points are forced to validate if the packet marks are expected to their interfaces. When a mismatch occurs, the packet marks can be safely eliminated, by restoring them to all 0’s. The strategic points can be based on topology and distance between routers. For example, a checking router can be placed at about 5 hops away from another checker. So each checker keeps track of all the possible packet marks of its upstream markers within 5 hops. Using the same bit-allocation of packet marks as in Section 4.4, each checker keeps about 16 packet marks for each nearby upstream router. The coverage effect by 20% routers can be achieved with this simple proposal, and the result of DPF can apply. By placing checkers at strategic points, the bogus packet marks can be eliminated early. More importantly, the number of allowed packet marks each checker needs to keep track of can be minimized. Hence strengthening the differentiability of packet mark validity. The exact placement of the checkers are topology dependent. In general, the rule of thumb is to place them before the bottleneck links, where multiple branches in the network graph merge. As defending against the Gossib attack is not the focus of our paper, we do not reproduce the evaluations similar to the DPF research. It is sufficient to note that it is possible for RPM (and PPM traceback schemes in general) to survive diligent Gossib attackers.
5.2
Extension
RPM can be extended to work when the upstream router map is not available. Assuming the victim has no upstream router map, markers can mark packets with either its node IP address or edge information. For a victim to reconstruct the attack graph, it first identifies the candidate markers using the node information, and then connects the markers based on the edge information. Attack edges are formed by exhaustively pairing the candidate markers found. They are verified if all the marks they can generate are received by the victim. Storing the random identifier together with the path information in packet headers facilitates efficient path reconstruction. Yet keeping random identifier in the packet marks takes up some precious bits that could be used for the path information. Shorter path information has higher collision probability and reduces the identification accuracy. The number of bits available for marking in the packet header is fixed and limited. One approach to increase the amount of information carried by a packet without using more bits in the header is to have an external common random source. Basically, the set of tags Xi associated to identity i is computed using its identity and R, which is obtained from the random source. The external common random source can be time, or random bits that vary with time. Markers can agree on a predetermined random bits schedule. By approximately synchronizing their clocks, in each
interval, all markers use the same random bits. As the interval elapses, e.g., after 1 minute, they all switch to the next random string in the schedule. Markers need not be perfectly synchronized. During the few transitional seconds from one random string to the next, packet marking suspends. The packet marks received during this period are discarded by the victim. When the synchronization of the random string is restored, marking resumes. Compared to storing the random identifier inside the packet header, this approach needs a longer time for the victim’s reconstruction to converge. However, it demonstrates the possibility to use an external random source of arbitrary length.
6.
CONCLUSION
IP traceback has been an actively researched DDoS defence. For attack packets with spoofed source addresses, IP traceback traces the paths they traverse up to the sources. Traceback also benefits traffic accounting applications, such as tracking clients’ bandwidth utilization, or locating the bottleneck links in the network. In this paper, we present a general model for PPM schemes. The general model provides a platform for PPM schemes comparison and helps to identify the appropriate system parameters. We also show that entropy is a good predictor of traceback accuracy and use of hop count information in the tag reduces the entropy. We present a PPM scheme called RPM that has good traceback accuracy and efficient path reconstruction. Simulations show improved scalability and traceback accuracy over prior works. For example, a thousand attack paths induce 63% of false positives in terms of edges identification, using AMS. RPM lowers the false positives to 2%. The effectiveness of RPM demonstrated that imposing sophisticated structures on tags is not necessary. If imposing the structure reduces the randomness in tags, it should be avoided. The improvement of RPM over prior schemes is mainly a result of increasing the information carried in packet marks.
7.
REFERENCES
[1] Internet mapping project. Research, Lumeta, Jan. 2006. [2] Anomalous DNS activity. Current activity archive, US-CERT, Feb. 6, 2007. [3] M. Adler. Tradeoffs in probabilistic packet marking for IP traceback. In Proceedings of ACM Symposium on Theory of Computing (STOC), Nov. 2001. [4] B.Bloom. Space/time trade-offs in hash coding with allowable errors. Communications of the Association for Computing Machinery, 13(7):422–426, 1970. [5] S. Bellovin, M. Leech, and T. Taylor. ICMP traceback messages. Internet draft, IETF, draft-ietf-itrace-01.txt, Oct. 2001. [6] B. Chor, A. Fiat, and M. Naor. Tracing traitors. In Proceedings of CRYPTO, pages 257–270, Aug. 1994. [7] D. Dean, M. Franklin, and A. Stubblefield. An algebraic approach to IP traceback. ACM Transactions on Information and System Security, 5(2):119–137, May. 2002. [8] L. Garber. Denial-of-service attacks rip the Internet. IEEE Computer, 33(4):12–17, Apr. 2000. [9] M. Goodrich. Efficient packet marking for large-scale IP traceback. In Proceedings of ACM CCS, pages
117–126, Nov. 2002. [10] J. Li, M. Sung, J. Xu, and L. Li. Large-scale IP traceback in high-speed Internet: Practical techniques and theoretical foundation. In Proceedings of IEEE S&P, May. 2004. [11] A. Mankin, D. Massey, C.-L. Wu, S. Wu, and L. Zhang. On design and evaluation of intention-driven ICMP traceback. In Proceedings of IEEE Computer Communications and Networks, Oct. 2001. [12] D. McGuire and B. Krebs. Attack on Internet called largest ever. Oct. 2002. [13] K. Park and H. Lee. On the effectiveness of route-based packet filtering for distributed DoS attack prevention in power-law internets. In Proceedings of SIGCOMM, pages 15–26, Aug. 2001. [14] S. Savage, D. Wetherall, A. Karlin, and T. Anderson. Practical network support for IP traceback. In Proceedings of SIGCOMM, Aug. 2000. [15] A. Snoeren, C.Partridge, L. Sanchez, C. Jones, F.Tchakountio, S. Kent, and W. Strayer. Hash-based IP traceback. In Proceedings of ACM SIGCOMM, Aug. 2001. [16] D. X. Song and A. Perrig. Advanced and authenticated marking schemes for IP traceback. In Proceedings of IEEE INFOCOM, pages 878–886, Apr. 2001. [17] I. Stoica and H. Zhang. Providing guaranteed services without per flow management. In Proceedings of ACM SIGCOMM, Aug. 1999. [18] W. Trappe, M. Wu, Z. J. Wang, and K. J. R. Liu. Anti-collusion fingerprinting for multimedia. IEEE Transactions on Signal Processing, 51(4):1069–1087, Apr. 2003. [19] M. Waldvogel. GOSSIB vs. IP traceback rumors. In Proceedings of Annual Computer Security Applications Conference (ACSAC), Dec. 2002. [20] A. Yaar, A. Perrig, and D. Song. Fit: Fast Internet traceback. In Proceedings of IEEE INFOCOM, pages 1395–1406, Mar. 2005.