Journal of Microbiological Methods 131 (2016) 172–180
Contents lists available at ScienceDirect
Journal of Microbiological Methods journal homepage: www.elsevier.com/locate/jmicmeth
A pipeline for developing and testing staining protocols for flow cytometry, demonstrated with SYBR Green I and propidium iodide viability staining Alina Nescerecka a,b, Frederik Hammes b,⁎, Talis Juhna a a b
Riga Technical University, Ķīpsalas Str. 6A, LV-1048, Riga, Latvia Eawag, Swiss Federal Institute for Aquatic Science and Technology, Überlandstr. 133, CH-8600 Dübendorf, Switzerland
a r t i c l e
i n f o
Article history: Received 26 July 2016 Received in revised form 23 October 2016 Accepted 28 October 2016 Available online 31 October 2016 Keywords: Bacteria Propidium iodide Flow cytometry Disinfection Viability Optimization
a b s t r a c t The increasing use of flow cytometry (FCM) for analyses of environmental samples has resulted in a large variety of staining protocols with varying results and limited comparability. Viability assessment with FCM is in this context of particular interest because incorrect staining could severely affect the outcome/interpretation of the results. Here we propose a pipeline for the development and optimization of staining protocols for environmental samples, demonstrated with the common viability dye combination of SYBR Green I (SG) and propidium iodide (PI). Optimization steps included the assessment of dye solvents, determination of suitable PI concentration, and determining the optimal staining temperature and staining time. We demonstrated that dimethyl sulfoxide (DMSO) could impair membrane integrity, when used for SGPI stock solution preparation, and TRIS buffer was chosen as an alternative. Moreover we selected 6 μM as optimal PI final concentration: less than 3 μM resulted in incomplete staining of damaged cells, while concentrations higher that 12 μM resulted in false PI-positive staining of intact cells. Low temperatures (25 °C) resulted in a slow reaction and did not enable the staining of all bacteria, while high temperatures (44 °C) caused damage to cells and false PI-positive results. Hence, 35 °C was selected as optimal staining temperature. We further showed that a minimum of 15 min were necessary to obtain stable staining results. Moreover, we showed that addition of EDTA resulted in 1–39% more PI-positive results compared to an EDTA-free sample, and argue that insufficient evidence currently exist in favor of adding EDTA to all samples in general. Altogether, the data clearly shows the need to be careful, precise and reproducible when staining cells for flow cytometric analyses, and the need to assess and optimize staining protocols with both viable and non-viable bacteria. © 2016 Elsevier B.V. All rights reserved.
1. Introduction Fluorescent staining coupled with flow cytometry (FCM) is often used for quantification and characterization of bacteria in both natural and engineered environmental water samples (Berney et al., 2007; Grégori et al., 2001; Hoefel et al., 2003; Phe et al., 2005). Previous studies have clearly demonstrated that staining results obtained from commonly used dyes such as SYBR Green I (SG) and propidium iodide (PI), and particularly their combination (SGPI), are severely influenced by variations in staining protocols (Barbesti et al., 2000; Falcioni et al., 2008; Grégori et al., 2001; Manini and Danovaro, 2006; Prest et al., 2013; Shi et al., 2007). For example, Prest and colleagues (Prest et al., 2013) demonstrated changes in cell concentrations and fluorescence fingerprints at different SG staining temperatures, while other authors showed changes in the percentage of “dead” cells detected at different ⁎ Corresponding author. E-mail address:
[email protected] (F. Hammes).
http://dx.doi.org/10.1016/j.mimet.2016.10.022 0167-7012/© 2016 Elsevier B.V. All rights reserved.
concentrations of PI (Manini and Danovaro, 2006; Shi et al., 2007; Williams et al., 1998). While a range of commercial dyes can be purchased as of-the-shelve kits, there is a clear and recognized need for protocol optimization and standardization, as well as for a mechanistic understanding of the staining method. Increasingly routine applications of these methods require fixed protocols to produce reliable and comparative data across experimental studies (Prest et al., 2013; SLMB, 2012; Van Nevel et al., 2013). Hence, the aims of the study were (1) to establish a general methodological pipeline for testing and optimization of staining protocols for flow cytometric analysis of bacteria in environmental water samples and (2) to demonstrate this approach and some related challenges for the SGPI viability staining method. Viability staining with SGPI was specifically selected as a good example of the case in point. Based on the LIVE/DEAD® staining method, first proposed by Boulos and co-workers as an alternative to plate counts (Boulos et al., 1999), nucleic acid double-staining using PI combined with membrane-permeable SG as a counter stain is frequently used to
A. Nescerecka et al. / Journal of Microbiological Methods 131 (2016) 172–180
distinguish between membrane compromised (damaged) cells, which are considered to be dead, from intact cells, which are often described as potentially viable cells (Barbesti et al., 2000; Berney et al., 2007; Falcioni et al., 2008; Grégori et al., 2001; Manini and Danovaro, 2006). At least five separate previous studies have worked towards some degree of testing/optimization of the SGPI staining protocols (Barbesti et al., 2000; Falcioni et al., 2008; Grégori et al., 2001; Manini and Danovaro, 2006; Shi et al., 2007), but a comparison of these and a review of currently available literature highlights numerous discrepancies in staining methods (supplementary information, Table S1). For example, reported PI concentrations varied 20-fold from 1.5 to 30 μM when used in combination with SG, and 50-fold (1 to 50 μM) when used alone or with other dyes. Moreover, staining temperatures are often not reported, or reported vaguely as “room temperature”, and staining times varied between 2 and 60 min. In addition, a few authors investigated the use of chelating agents (EDTA, EGTA) for gram-negative bacteria, when PI-based viability determination methods are applied (Berney et al., 2008, 2007; López-Amorós et al., 1995), but without indepth assessment of potential artifacts arising from this. Accurate staining protocols are critical for all dyes, but particularly so for a viability double-staining approach (e.g., SGPI). Firstly, temperature, time and dye concentrations could influence reaction rates and the efficacy of staining. Secondly, a usage of two fluorescent dyes in combination means potential interaction between their excitation/emission spectra (i.e. energy transfer). For example, it was shown that emission spectrum of SYTO9, which is similar to SG spectrum, causes PI excitation with an increase of the signal intensity and quenching of the green fluorescence consequently (Stocks, 2004). Additionally, a displacement of SYTO9 molecule by PI was demonstrated as a possible mechanism occurring when staining with the two dyes. Appearance of “double positive” cells was described in another study, when inadequate PI concentrations resulted in the incomplete energy transfer between SG and PI (Barbesti et al., 2000). Finally, incorrect staining conditions might cause damage to bacteria, thus creating artifact results. For example, it was demonstrated that high temperatures permeabilize cell membranes, while PI could erroneously penetrate cells when used in too high concentrations (Grégori et al., 2001; Williams et al., 1998). Thus variations of the staining method could severely influence the outcome. For this reason it is imperative to assess the dyes within the context of understanding their viability targets and their mechanism of action. In the present study we focused specifically on actual environmental samples, using river water as the bacterial source for most experiments. The specific experimental goals of the study were: (i) to assess the influence of the solvents used for dye preparation on the staining result; (ii) to identify an optimal dye concentration, (III) staining time and (iv) staining temperature. Moreover, we use this to propose a pipeline for testing fluorescent dyes for flow cytometry in general.
2. Materials and methods 2.1. Sampling River water (Chriesbach, Dübendorf, Switzerland) was selected as a water source to provide untreated indigenous bacterial communities for SGPI testing and optimization. Nine additional environmental/drinking water samples were taken to test the optimized protocol and the effect of EDTA, namely, river water (Daugava River, Riga, Latvia), river water (Lielupe River, Jurmala, Latvia), bottled natural mineral water (Mangali, Latvia), bottled natural mineral water (Evian, France), sea water (Baltic sea, Gulf of Riga, Jurmala, Latvia), well water (Babite, Latvia) and three chlorinated tap water samples from different locations (Riga, Latvia). Water was collected in sterile 50 mL tubes, and tests were performed within 24 h.
173
2.2. Composition of dyes solutions The original SG and propidium iodide (PI) staining solution (SGPI) was prepared using SG stock solution diluted in 100× in anhydrous dimethyl sulfoxide (DMSO) and a final PI concentration of 0.3 mM (Van Nevel et al., 2013). For optimization purposes various PI concentrations were tested. For a working solution, SYBR® Green I (SG) stock (Invitrogen AG, Basel, Switzerland) was diluted 100 × in 10 mM Tris buffer (pH = 8.1). Working SGPI solutions were prepared using this SG working solution and addition of PI with a concentrations ranging from 37.5 μM to 2.4 mM (equivalent to 0.375 μM to 24 μM final PI concentration) (details in 2.5.). 2.3. Bacterial inactivation Two types of inactivation treatments were used to produce real water samples with different amounts of intact and damaged bacteria. Heat treatment was used to ensure substantial bacterial damage. For that, 150 μL of the sample was transferred into an Eppendorf tube and incubated at 80 °C for 3 min (Berney et al., 2007). An addition of a moderate chlorine dose (0.35 mg L−1 free chlorine as a final concentration) was applied to inactivate a part of total bacterial community (Nescerecka et al., 2016). The contact time was 5 min and chlorine was quenched with addition of 10 mM Na2S2O3 (1% (v/v)) before staining. Determination of free chlorine was measured using commercially available chlorine test kits (LCK 310; Hach-Lange) and a photometer (CADAS 30, Hach-Lange). 2.4. Fluorescent staining and flow cytometry (FCM) of water samples Measurements were performed using a BD Accuri® C6 flow cytometer (BD Accuri® cytometers, Belgium), or a Partec CyFlow® SL instrument (Partec GmbH, Münster, Germany). The BD Accuri® C6 instrument is equipped with a 50 mW solid state laser emitting light at a fixed wavelength of 488 nm. Green fluorescence intensity was collected 533 ± 30 nm, red fluorescence at N 670 nm, while sideward and forward scattered light intensities were collected as well. Measurements were performed at pre-set flow rate of 66 μL min−1. The CyFlow® SL instrument is equipped with a blue 25 mW solid state laser emitting light at a fixed wavelength of 488 nm. Green fluorescence was collected at 520 ± 10 nm, red fluorescence above 630 nm, and high angle sideward scatter (SSC) at 488 nm. The trigger/threshold for both instruments was set on the green fluorescence channel and data were acquired on twoparameter density plots, while no compensation was used for any of the measurements. All data were processed with the FCM propriety software, and electronic gating was used to separate positive signals from instrument and water sample background (Prest et al., 2013). Three different approaches for fluorescent staining and FCM measurements were applied depending on the purpose (see optimization setup section 2.5.): (i) standard single-sample measurements (with BD Accuri® C6 or Partec CyFlow® SL instruments); (ii) automated 96well multi-plate measurements (with BD Accuri® C6); (iii) high frequency time and temperature controlled measurements (with the BD Accuri C6® partially connected to an online FCM device (Besmer et al., 2014)). Standard measurements were performed as described before (Van Nevel et al., 2013). If not stated otherwise, the samples were preheated at 37 °C (3 min), then stained with either SG or SGPI at 10 μL mL−1 (10,000× final dilution of SG; 3 μM final concentration of PI) followed by 10 min incubation in the dark at 37 °C. When necessary, the water samples were diluted immediately prior to FCM analysis with 0.22 μm filtered commercially available bottled water (Evian, France) to 10% v/v of the initial concentration. For temperature-controlled 96-well multi-plate based analyses, the BD Accuri® C6 instrument equipped with autoloader was placed in a walk-in incubator at 37 °C. 200 μL of the sample were transferred to separate wells (n = 32), pre-heated (3 min), then stained simultaneously with a multi-channel pipette,
174
A. Nescerecka et al. / Journal of Microbiological Methods 131 (2016) 172–180
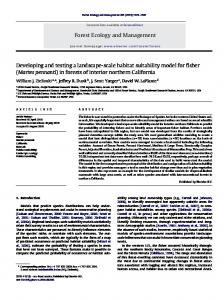
and subsequently 25 μL of each sample was measured (Van Nevel et al., 2013). For high frequency measurements, an online FCM system was used with some modifications from the one described before (Besmer et al., 2014). In short, SG or SGPI (10 μL mL−1) was added into a FCM sampling tube with 2 mL of a water sample, which was pre-heated to the necessary temperature. Directly after addition of the dye, the tube was placed into the FCM sampling port in a temperature-controlled environment and the automated measurement cycle was started. A control unit was programmed to inject sample every 1 min, thus analyzing 19 μL per sampling. 2.5. Staining optimization approach The tests for the optimization approach were performed in the specific order that is schematically demonstrated on Fig. 1. The tests included in this general pipeline were conducted as follows: Dye solvents (Step 2): SGPI working solutions were prepared in either Tris buffer (10 mM, pH = 8.1) or DMSO as described in Section
2.2 to assess impact of the dye solvents on staining results (Fig. 1, Step 2). The dyes were added to the pre-heated (37 °C) river water samples at 3 μM PI final concentration, and measurements were performed using 96-well multi-plate approach. FCM sampling and measurements were done at approximately 50 s intervals, and incubation temperature was constant at 37 °C. Stain concentrations (Step 3): Untreated and heat-treated water samples (Section 2.3) were stained with 0.375, 0.75, 1.5, 3, 6, 12 and 24 μM final PI concentrations to assess the impact of dye concentration on SGPI staining. The samples were stained for 10 min at 37 °C prior measurements. All the samples were prepared in triplicate. The test was done using the standard FCM measurement procedure (described above). Incubation temperature (Step 4): SGPI was added to untreated water samples with 3, 6 or 12 μM final PI concentration, which were measured with the online system approach at 25 °C, 35 °C and 44 °C pre-set temperature to make a decision about optimal staining temperature (Step 4). Stain concentration and incubation time (Step 3 & 5): Untreated and chlorine-treated (Section 2.3) water samples were stained with SGPI dyes with 3, 6 or 12 μM PI concentration, and incubated at 35 °C. Sampling and measurements were done continuously for 25 min with the online system in order to estimate a concentration and time required for stable and optimal staining (Step 5). Additives and different samples (Step 6 & 8): A necessity of EDTA addition was tested. EDTA (5 mM final concentration) was added to different water samples (Section 2.1) together with SG or SGPI dyes, and incubated 15 min at 35 °C. The same samples were stained without EDTA. 2.6. Statistical analysis Statistical analysis was made using MS Excel ANOVA Single factor data analysis tool. 3. Results and discussion 3.1. Solvents can damage cells during staining When SGPI was dissolved and diluted in DMSO prior to use, it appeared that the DMSO progressively caused unwanted cell damage during the staining, and this was not observed when the dye was prepared in TRIS buffer (Fig. 2). With DMSO as solvent for the dye, intact cell concentration (ICC) of an otherwise untreated river water sample reached a maximum after 6 min of staining (6 × 10⁵ cells mL−1), but then gradually decreased with increased staining time. After 25 min, the ICC were only 2.9 × 10⁵ cells mL−1, which is b 50% compared to the maximum ICC and only 29% of the average total cell concentrations (TCC) at the same
Fig. 1. A general pipeline for developing staining protocols for flow cytometric analysis of environmental samples. Steps 3–5 are done either in parallel (this study) or with several iterations to establish optimal conditions. Step 2 is ideally re-done with an optimized protocol if sufficiently different from the original protocol, while adverse/problematic data in Step 8 may well necessitate re-assessment of Steps 3–5.
Fig. 2. The impact of TRIS buffer (pH = 8.1) and DMSO as solvents used for preparing dye working solution on SGPI staining. River water samples were stained 25 min at 37 °C with 3 μM PI in 10,000× diluted SG (n = 30).
A. Nescerecka et al. / Journal of Microbiological Methods 131 (2016) 172–180
time point (supplementary information, Fig. S1A). When the dye was prepared in TRIS buffer, the ICC was 6.5 × 10⁵ cells mL−1 after 6 min (similar to the DMSO result) and continued to increase slightly, indicating that staining is time dependent. Nonetheless, the average ICC value was almost constant at 6.8 ± 0.3 × 10⁵ cells mL−1 (CV = 5%) even within the 6–25 min time interval (n = 23), which was 72% of the average TCC during the same time interval. Notably, TCC values were unaffected by the solvents and were not statistically different between 6 and 25 min of staining, namely 9.88 ± 0.32 × 10⁵ cells mL−1 with DMSO, and 9.51 ± 0.38 × 10⁵ cells mL−1 with Tris buffer (n = 24) (supplementary information, Fig. S1A). Corresponding FCM density plots demonstrated a clear difference between staining with TRIS buffer and DMSO as respective dye solvents after 10 min of staining (supplementary information, Fig. S1B). There was a notable shift from the green fluorescence region (“intact cells”) to the red fluorescence region (“damaged cells”) in the DMSO plot, indicating that membrane impermeable PI molecules penetrated the cells. In turn, the FCM plot, obtained within the same conditions with TRIS buffer as solvent, showed clearly separated intact and damaged cells. The TCC data with TRIS buffer showed the same slight increase as the ICC data (Fig. S1A, Fig. 2), which suggest that this is caused by time-dependent increased staining of cells with SG. This is discussed in detail below (Section 3.4) where we suggest staining untreated samples at least for 10 min to obtain stable results. DMSO is often used as solvent for fluorescent PI based viability dyes (Berney et al., 2008; Lehtinen et al., 2004; Ramseier et al., 2011; Vital et al., 2012; Zotta et al., 2012). However, DMSO has properties that facilitate high cell permeability (Yu and Quinn, 1994), apparently also at the low concentrations used in our study (i.e., 100× dilution). Evidence of the ability of DMSO to make cell membranes thinner and enhance pore formation was observed with eukaryotic cells and demonstrated with molecular dynamics simulations (de Ménorval et al., 2012; Fernández and Reigada, 2014; Gurtovenko and Anwar, 2007; Notman et al., 2006). A similar effect was also observed with bacterial cells, showing 1% DMSO enhanced cell permeability (Chitemerere and Mukanganyama, 2014), which is the same final concentration as was used in the present study. In a series of supporting experiments we furthermore demonstrated that the decrease in ICC was clearly dependent on the DMSO concentration and exposure time (supplementary information, Fig. S2). These concentration and time dependent DMSO reaction data strongly support the hypothesis that DMSO damage of cells is causing a substantial decrease in ICC, and clearly shows the critical impact that a dye solvent can have in the outcome of a viability assay. We conclude that ideally DMSO should not be used to dissolve SGPI working solutions, while other viability dye that targets membrane permeability (e.g., SYTOX Green, ethidium homodimer 2) should be tested on compatibility with DMSO. Some previous studies showed that TRIS buffer could also alter bacterial membranes (Irvin et al., 1981; Vaara, 1992). However, the concentrations used in those studies were higher than what was used in the present work. Since no obvious drawbacks were observed with TRIS buffer, it was chosen as a solvent for SGPI staining for all further tests in the current study.
175
While the PI concentrations varied, the SG concentration had a fixed value (10,000× final dilution from the stock) throughout all tests to ensure the same SG emitted energy and thus direct comparability between data. The results showed that the lowest PI concentration (0.375 μM) already sufficed to detect a 1-log ICC decrease (91%) in the heat treated sample, resulting in 2.83 ± 0.29 × 10⁵ cells mL− 1 of ICC (Fig. 3.1). Higher PI concentrations (3–24 μM) showed considerably more ICC decrease (0.5–1.17 × 10⁵ cells mL−1). Notably the ICC values of the untreated samples varied from 2.15 ± 0.05 × 10⁶ to 2.58 ± 0.16 × 10⁶ cells mL−1 within the entire tested PI concentration range. Moreover, the results were not statistically different with PI concentrations in a range between 0.75 and 12 μM. While doubling the PI concentration caused up to 50% different ICC in heat-treated samples, differences between doubled PI concentrations never exceed 5% in the untreated samples. This indicates that while the dye concentration was less critical for viability evaluation of the untreated samples, it considerably affected non-viable (dead) cell quantification, and thus underlines the need to assess viability dyes specifically with both viable and non-viable target cells. Similarly, the effects of staining caused by different PI concentrations were also observed on FCM density plots from the experiment above. Fig. 3.2 shows FCM density plots after 10 min of SGPI staining with identical SG concentrations and respectively low (0.75 μM), middle (3 μM) and high (24 μM) PI concentrations. While low PI concentrations stained a considerable part of heat-damaged cells, the shift from the “intact” to “damaged” regions was clearly incomplete (Fig. 3.1B; Fig. 3.2A). Although the ICC of the untreated sample (predominantly intact cells) were not statistically different when stained with 0.75 μM and 3 μM PI (P N 0.05), the low concentrations of PI resulted in poor separation between the clusters for intact and damaged cells, which might be an obstacle for correct data gating and interpretation (Fig. 3.2B; Fig. 3.2D). In turn, at high PI concentrations (24 μM) a clear separation of damaged cells in the heat-treated sample was observed (Fig. 3.2E). However, in
3.2. Appropriate dye concentrations for viable and non-viable cells The dye concentration can affect the interpretation of the experimental data, since a too high concentration may lead to false-positive staining, while too low concentrations will inevitably lead to ineffective or false-negative cell staining (Williams et al., 1998). Hence, in the case of a viability dye such as PI, the impact of concentration should be tested with both viable and non-viable bacteria, with the latter treated (killed) in a manner that would actually be detected with the specific dye. Here the test was performed with untreated and heat-inactivated river water, with the latter expected to comprise mostly cells with damaged membranes. We selected a broad range of final PI concentrations based on peer-reviewed literature (supplementary information, Table S1).
Fig. 3.1. The effect of different PI concentrations on SGPI staining results. Untreated (A, circles) and heat-treated (80 °C, 3 min; B, diamonds) river water samples were stained 10 min with doubling PI concentrations (0.375–24 μM final concentrations), while the SG concentration remained constant (10,000× diluted SG).
176
A. Nescerecka et al. / Journal of Microbiological Methods 131 (2016) 172–180
Fig. 3.2. FCM density plots of river water samples stained with different concentrations of PI (selected from Fig. 3.1). Samples were exposed to different PI concentrations for 10 min: heattreated (80 °C, 3 min) river water samples stained with 0.75 μM (A), 3 μM (C), 24 μM (E) and untreated samples with 0.75 μM (B), 3 μM (D) and 24 μM (F) PI, while the SG concentration remained constant in all (10,000× diluted SG). The X and Y axis represent green (FL1-A) and red (FL3-A) fluorescence intensity respectively. The gated area (dotted red line) indicates the region where intact cells (ICC) are located on the plots. (For interpretation of the references to color in this figure legend, the reader is referred to the web version of this article.)
the untreated samples all events (including the intact cells as well as the background) displayed higher red fluorescence intensities than in less PI-saturated samples: a 42% higher median red fluorescence value of the ICC gated events in the sample stained with 24 μM in comparison to 3 μM PI. As a consequence, a fraction of presumably intact cells shifted across the fixed gate into the area allocated to damaged cells, which also explains the 9% ICC decrease in the untreated sample stained with 24 μM PI (Fig. 3.1A). The optimal PI concentration has to provide complete staining of damaged cells without causing false PI-positive results (staining of intact cells). The mechanism of PI viability staining is based on labeling DNA of the cells with damaged membranes: large negatively charged PI molecules are normally unable to penetrate cells with intact
membranes (Boulos et al., 1999; Hewitt et al., 1999). In our case, staining was considered incomplete if the PI concentration was b 3 μM. We argue here that the membranes of the cells in the heat-treated samples were definitely damaged, but insufficient PI penetrated the cells. Moreover, there also has to be sufficient PI in solution to achieve maximum intercalation with all target DNA of damaged cells together with SG. The latter will ensure complete energy transfer from SG to PI (known as fluorescence resonance energy transfer (FRET) or “quenching”), which is responsible for a critical shift in the PI signal intensity, and hence for the ability to differentiate between SG-positive and PI-labeled cells (Stocks, 2004; Berney et al., 2007). This explanation was also proposed in the study of Barbesti and co-authors (Barbesti et al., 2000), where inactivated cells emitted both green and red fluorescence,
A. Nescerecka et al. / Journal of Microbiological Methods 131 (2016) 172–180
when insufficient PI was used. However, we also argue that there is no reason to use higher than 12 μM PI concentrations, since this could pose a risk of false-positive results and/or artifact fluorescence shifts in the FCM plots. The data from earlier studies, obtained with epifluorescence microscopy, showed increased amounts of red fluorescing cells in SGPI and 4′-6′-diamidino-2-phenylindole (DAPI)-PI stained samples, when the PI concentration was higher than 30 μM and 15 μM, respectively (Manini and Danovaro, 2006; Williams et al., 1998). This phenomenon was explained as a staining artifact in both studies, in agreement with our observations above. As a consequence, we conclude that the PI concentration should not be lower than 3 μM and should not exceed 12 μM to obtain reliable results. Hence, three PI concentrations – 3 μM, 6 μM and 12 μM – were selected for further testing in all subsequent experiments. 3.3. Temperature influence the staining reaction The main criteria for selecting a SGPI staining temperature were (a) achieving rapid and complete staining, and (b) avoiding temperatureinduced membrane damage. Samples were stained with the three selected SGPI concentrations at 25 °C, 35 °C and 44 °C and measured at 1-min intervals from the moment of staining onwards. Warmer temperatures (35 °C) improved SGPI staining over the 25 °C sample, but too high temperatures (44 °C) permeabilized bacterial cell walls leading to potentially erroneous results (Fig. 4). At 25 °C the staining reaction was slow; it took nearly 11 min to reach a stable average of 74 ± 2% ICC (as a percentage of TCC (n = 14)). Additionally, both ICC and TCC showed proportionally lower values at 25 °C in comparison with the results obtained at the higher temperatures (see supplementary information, Fig. S3.1). This corresponds with previous studies where warmer staining temperatures resulted in higher TCC values (Hammes et al., 2012; Prest et al., 2013). At 35 °C the % ICC was stable during all 25 min (73% ± 3%; n = 25), suggesting uniform staining with both dyes without apparent cell damage. However, it should be noted that while the % ICC remained constant at 35 °C from the first minute onwards, the actual cell concentrations still required about 8 min to reach steady state (see Fig. 2), similar to previous studies on SG staining (Prest et al., 2013). In contrast, staining at 44 °C resulted in significantly less % ICC than the lower staining temperatures, and the % ICC was furthermore progressively decreasing over time, reaching as low as 63% (25 min). The same effects at the different temperatures were observed with the samples stained with SGPI containing 6 μM and 12 μM PI concentrations (supplementary information, Fig. S3.2). These data indicate that a part of the bacteria became membrane-compromised due to the
Fig. 4. The influence of three different incubation temperatures on the percentage of intact cells (calculated as ICC/TCC × 100) in a river water sample stained with SGPI with 3 μM PI (final concentration). The actual TCC and ICC concentrations are shown in Fig. S3.1 (supplementary information). The measurements were done at 1-min intervals for each sample (n = 25).
177
high temperature. This was not entirely unexpected; it was already demonstrated that heat stress caused by 60–80 °C temperatures resulted in cell membrane disruption (Berney et al., 2007; Falcioni et al., 2008; Williams et al., 1998; Zotta et al., 2012), while a recent study demonstrated an increase of PI-positive cells even at 40 °C (Hammes et al., 2012). The data above emphasizes the importance of establishing an appropriate staining temperature and the absolute necessity of using a fixed value for all measurements. Interestingly, temperature was either not mentioned, or only vaguely described as “room temperature”, in the methods descriptions of several studies (supplementary information, Table S1). Our results suggest that 35 °C is the most suitable temperature, which ensures rapid and balanced staining and does not damage the cell membranes of the investigated bacterial populations. However, a broad temperature range (10 °C differences) was tested in the present study, and minor variations from the selected temperature may well produce satisfactory results. For example, the SGPI (dissolved in TRIS buffer) data from Fig. 2, recalculated as % ICC, showed that 37 °C also provides stable results without damaging cells: % ICC was 70 ± 2% during the all 25 min of staining (n = 30) (supplementary information, Fig. S3.3). This is important because 37 °C is often more advantageous as incubation temperature due to its multi-purpose applications, and it was also used previously for SG and SGPI staining (Barbesti et al., 2000; Van Nevel et al., 2013). Moreover, the SG staining method for total cell concentration measurements was standardized for this temperature (37 ± 2 °C) (SLMB, 2012). In the broader context, this data clearly emphasize the need to consider staining temperature as a critical parameter when testing dyes and staining protocols for quantitative flow cytometry. 3.4. Determination of suitable staining time and final PI concentration Our entire dye-testing approach by default already included staining time as a variable in the tests with respect to PI concentrations and staining temperatures, and evidently the staining time had the most significant effect on ICC during first 10 min (see Figs. 2, 4). A closer look at staining time and PI concentrations specifically showed that maximum ICC values were obtained in an untreated river water sample after 8 min (1.4 × 10⁶ cells mL− 1), 7 min (1.29 × 10⁶ cells mL− 1) and 11 min (1.21 × 10⁶ cells mL−1) as a result of the SGPI staining at 35 °C with 3 μM, 6 μM and 12 μM PI concentration respectively (Fig. 5A). The staining was stable between 10 and 25 min, and the average ICC were 1.33 ± 0.04 × 10⁶ cells mL−1 with 3 μM PI, 1.20 ± 0.04 × 10⁶ cells mL−1 with 6 μM PI and 1.13 ± 0.04 × 10⁶ cells mL−1 stained with 12 μM PI concentration. Thus 10 min was deemed sufficient to distinguish between intact and damaged cells if no additional treatment was applied. In order to test staining time and concentrations on damaged cells, a slightly chlorinated river water sample (0.35 mg Cl2 L−1, 5 min) was used. TCC values were stable throughout staining of the chlorinated sample, namely, 2.75 ± 0.08 × 10⁶ cells mL− 1 (n = 25, CV = 3%) (Fig. 5B). In turn, the ICC decreased logarithmically with an increase of time in chlorinated samples. Comparing to the untreated sample, in the chlorinated sample the results were more stable (smaller CV values) between 15 and 25 min (n = 11) rather than between 10 and 25 min. ICC were 8.26 ± 0.34 × 10⁵ cells mL−1 (30% of TCC, CV = 4%), 7.14 ± 0.37 × 10⁵ cells mL− 1 (26% of average TCC, CV = 5%), 6.54 ± 0.48 × 10⁵ cells mL−1 (24%, CV = 7%) for the 3 μM, 6 μM and 12 μM PI concentrations, respectively. The more stable results obtained after 15 min led to a conclusion that 15 min is optimal time for SGPI staining for both intact and damaged cells. The importance of an appropriate PI concentration and its selection criteria were already discussed in detail in Section 3.2. PI concentrations tested/described in this section (3–12 μM) met our requirements, and therefore selection of the appropriate stain concentration was based on the statistical difference between the measurements. ICC in the treated samples stained with the dyes containing 6 μM and 12 μM of PI were not statistically different (P N 0.05), in other words, doubling the concentration of PI did not result in significant change of ICC. In turn, ICC
178
A. Nescerecka et al. / Journal of Microbiological Methods 131 (2016) 172–180
3.5. Additives: EDTA addition affects SGPI staining
Fig. 5. Determining the optimal PI concentration and staining time by sequential measurements of an untreated river water (A) and chlorinated river water sample (B). Samples were stained and measured at 35 °C with SG for determination of TCC (diamonds) and SGPI with different PI concentrations for ICC: 3 μM (squares), 6 μM (circles) and 12 μM (triangles). A minimum of 15 min staining time and 6 μM PI (final concentration) were selected as the optimal conditions. A dotted vertical line marks time when staining became stable.
obtained with 3 μM and 6 μM PI were statistically different (P b 0.05). In untreated samples, all three PI concentrations were statistically different, however, 6 μM and 12 μM were less different than other combinations (P value in first case was higher than the rest). Additionally, % ICC difference between 6 μM and 12 μM was only 4% after defined staining time (15 min, n = 10), which is not critical for viability assessment as discussed in Section 3.2. Thus 6 μM PI was chosen as an optimal concentration for SGPI dye. The same concentration and staining time were used in some of the studies mentioned before (Lautenschlager et al., 2013; Ramseier et al., 2011; Vital et al., 2012). However, selection of staining time was not explained or justified in those studies. Other studies, which showed dependencies between time and stained bacteria, usually made the conclusion based on the stability of the results. For instance, some researchers compared “live”/total bacteria ratios (Boulos et al., 1999) or the PI-stained cell ratio (Shi et al., 2007), considering the hypothesized physical state of bacteria. In turn, Williams and co-authors were selecting optimal staining time with an aim to avoid cell leakage and false PI-labeled cells, which might appear due to too long exposure to the stain (Williams et al., 1998). Different time values were chosen as optimal in these works: 10 min (Shi et al., 2007), 20 min (Boulos et al., 1999) and 30 min (Williams et al., 1998). Although we can't compare the actual time values between different studies when other parameters were not the same, to our knowledge, staining was not applied for more than 30 min if PI was used with a counterstain (supplementary information, Table S1). With that we conclude that selected 15 min staining time is sufficient time to achieve optimal staining results and generally do not contradict with other studies.
EDTA addition was previously shown to be essential for achieving optimal staining results with pure cultures of gram-negative bacteria (Berney et al., 2007; Hammes et al., 2012; Nebe-von-Caron et al., 2000). But EDTA addition presents an enigma to viability staining, as it is known to alter properties of cellular membranes (Hamilton-Miller, 1966; Vaara, 1992; Virto et al., 2005), hence potentially creating results rather than measuring a result. A broad set of environmental samples measured with and without 5 mM EDTA (final concentration) showed that EDTA addition unevenly increases cell membrane permeability between 1 and 39% (Fig. 6.1.). The largest ICC decrease was observed in a seawater sample (39%), and the least in bottled mineral water samples (1–8%) (the actual TCC and ICC values are shown in supplementary Fig. S4). Moreover, the SGPI staining outcome depended on the EDTA concentration: higher EDTA concentrations resulted in lower ICC values (Fig. 6.2.). In the river water sample, 0.5 mM EDTA (final concentration) caused almost no changes in ICC (P N 0.05), however, ICC decreased from 2.22 ± 0.035 × 10⁶ cells mL−1 (without EDTA) to 1.37 ± 0.06 × 10⁶ cells mL−1 with 5 mM EDTA, which represents 38% ICC decrease in comparison to 0.5 mM EDTA. A further 10-fold increase of the final EDTA concentration resulted in 1.07 ± 0.10 × 10⁶ cells mL−1 ICC, which was only 48%, when compared to ICC obtained without EDTA addition. It is important to highlight that SGPI staining with 50 mM EDTA resulted in only 14% less ICC in comparison to 5 mM EDTA containing sample (relatively to ICC of EDTA-free sample). This indicates that further increase of the EDTA concentration above 5 mM had only a limited effect on membrane permeability and a fraction of the bacterial population remained completely unaffected by EDTA and remained PI-impermeable. What is inconclusive from the data is whether EDTA addition enabled correct observation of damaged cells, or whether EDTA addition caused artifact false-positive staining of intact cells. In earlier studies, the effect of EDTA on membrane permeability was mostly investigated in terms of bacterial susceptibility to various antimicrobial agents, and it was generally concluded that EDTA increases permeability of gram-negative bacteria by chelating metal ions on the outer membrane (Abriouel et al., 1998; Hamilton-Miller, 1966; Khan et al., 2015; Wan Norhana et al., 2012). Much less research has been conducted specifically for gram-positive bacteria. Available sources showed that gram-positive bacteria growth was inhibited in presence of EDTA (Kraniak and Shelef, 1988; Zaika and Fanelli, 2003), and increased permeability was also reported (Khan et al., 2015), however, the mechanism is not clear. These contradicting results suggest that the impact of EDTA addition on bacteria is not completely clear and additional research is needed. However, because of the obvious risk of inducing membrane damage and creating false-positive data, it
Fig. 6.1. The effect of EDTA addition on the percentage intact cells (ICC; calculated as ICC/ TCC × 100) in a variety of water samples with different chemical and bacterial compositions. Tap water samples were chlorinated, but the source and treatment differed; the remaining samples were untreated. The percentage ICC was calculated from mean values of TCC and ICC (n = 3). The actual values and standard deviations are shown in Fig. S4, supplementary information.
A. Nescerecka et al. / Journal of Microbiological Methods 131 (2016) 172–180
179
• Temperature: Low temperatures (25 °C) resulted in a slow reaction and did not stain all bacteria, while 44 °C caused damage to cells and false PI-positive results. Hence, 35 °C was selected as optimal staining temperature. • Time: Approximately 12–15 min were needed to stain all cells and achieve stable results with the selected concentrations and temperatures listed above. • Additives: Addition of EDTA resulted in 1–39% more PI-positive results compared to an EDTA-free sample, clearly calling for further research on whether EDTA should be used or not.
Altogether, the data clearly shows the need to be careful, precise and reproducible when staining cells for flow cytometric analysis. Fig. 6.2. Changes in total (TCC) and intact (ICC) cells with the addition of 10-fold increasing EDTA concentrations. A river water sample was stained at 35 °C for 15 min with respectively SG and SGPI (10,000× diluted SG and 6 μM PI) with or without EDTA. Error bars indicate standard deviation for triplicate experiments.
was decided not to use EDTA for routine analysis of environmental samples until more conclusive data becomes available. 3.6. Considering the mechanism of cell death when assessing viability dyes Bacteria, like other organisms, die from different causes and it is important to understand that currently no viability dye has been identified that universally distinguishes between life and death (Hammes and Egli, 2010). Membrane integrity, determined with SGPI, is a measurement of viability in samples treated with sunlight (Berney et al., 2007, 2006), chlorine (Nescerecka et al., 2016; Ramseier et al., 2011), ozone (Ramseier et al., 2011), heat (Berney et al., 2008) (Fig. 3.1B), ethanol, soap (data not shown). However, SGPI led to erroneous viability interpretation in samples treated with 0.3–4% formaldehyde or 0.01–0.05% sodium azide (supplementary information, Fig. S5). Both of these compounds are toxic to bacteria at these concentrations (MAK, 2002; McDonnell, 2007), but did not cause significant membrane permeabilization. Another example is UV-C light exposure, where bacteria become inactivated (DNA damage) long before the membrane gets damaged (Nocker et al., 2006). A final more complicated example is disinfection with heavy metals. Addition of 4 mg L−1 CuCl2 (equivalent to 1.9 mg-Cu2+ L−1) to river water samples resulted in merely 7% ICC decrease, when the samples were stained with the normal SGPI protocol (supplementary information, Fig. S6A, S6B), but reached 53% with EDTA addition. A similar situation was observed in samples where silver (AgNO3) was added to inactivate bacteria (supplementary information, Fig. S6C). We argue that EDTA addition chelates the membrane-bound metal ions that resulted in a PI-impermeable layer, and thus EDTA treatment is necessary to observe cell damage in this specific case. These results highlight potential risks while using SGPI dye specifically, and underline the fact that all staining protocols should be developed and tested according to the type of samples and applied treatment. 4. Conclusions A pipeline for developing and optimizing staining protocols for flow cytometry was demonstrated in the study with the viability stain combination of SGPI. We specifically showed that: • Solvent: DMSO enhanced membrane permeability in autochthonous bacterial communities and resulted in erroneous data interpretation; TRIS buffer was suggested as alternative. • Concentration: PI addition below 3 μM resulted in incomplete staining of damaged cells, while concentrations higher that 12 μM resulted in false PI-positive staining of intact cells. We selected 6 μM as optimal concentration.
Funding This work was supported by the NMS-CH project “BioWater: Assessment of biological stability in drinking water distribution networks with chlorine residuals” (Sciex-N-7 12.265); Latvian National research program SOPHIS under grant agreement Nr.10-4/VPP-4/11 and Riga Technical University funding for doctoral students based on the agreement Nr.04000-1.1/17. Appendix A. Supplementary data Supplementary data to this article can be found online at http://dx. doi.org/10.1016/j.mimet.2016.10.022. References Abriouel, H., Valdivia, E., Gálvez, A., Maqueda, M., 1998. Response of Salmonella choleraesuis LT2 Spheroplasts and Permeabilized Cells to the Bacteriocin AS-48. Appl. Environ. Microbiol. 64, 4623–4626. Barbesti, S., Citterio, S., Labra, M., Baroni, M.D., Neri, M.G., Sgorbati, S., 2000. Two and three-color fluorescence flow cytometric analysis of immunoidentified viable bacteria. Cytometry 40:214–218. http://dx.doi.org/10.1002/1097-0320(20000701)40: 3b214::AID-CYTO6N3.0.CO;2-M. Berney, M., Weilenmann, H.-U., Egli, T., 2006. Flow-cytometric study of vital cellular functions in Escherichia coli during solar disinfection (SODIS). Microbiology 152: 1719–1729. http://dx.doi.org/10.1099/mic.0.28617-0. Berney, M., Hammes, F., Bosshard, F., Weilenmann, H.-U., Egli, T., 2007. Assessment and interpretation of bacterial viability by using the LIVE/DEAD BacLight Kit in combination with flow cytometry. Appl. Environ. Microbiol. 73:3283–3290. http://dx.doi.org/ 10.1128/AEM.02750-06. Berney, M., Vital, M., Hülshoff, I., Weilenmann, H.-U., Egli, T., Hammes, F., 2008. Rapid, cultivation-independent assessment of microbial viability in drinking water. Water Res. 42:4010–4018. http://dx.doi.org/10.1016/j.watres.2008.07.017. Besmer, M.D., Weissbrodt, D.G., Kratochvil, B.E., Sigrist, J.A., Weyland, M.S., Hammes, F., 2014. The feasibility of automated online flow cytometry for in-situ monitoring of microbial dynamics in aquatic ecosystems. Front. Microbiol. 5. http://dx.doi.org/10. 3389/fmicb.2014.00265. Boulos, L., Prévost, M., Barbeau, B., Coallier, J., Desjardins, R., 1999. LIVE/DEAD® BacLight ™: application of a new rapid staining method for direct enumeration of viable and total bacteria in drinking water. J. Microbiol. Methods 37:77–86. http://dx.doi.org/ 10.1016/S0167-7012(99)00048-2. Chitemerere, T.A., Mukanganyama, S., 2014. Evaluation of cell membrane integrity as a potential antimicrobial target for plant products. BMC Complement. Altern. Med. 14:278. http://dx.doi.org/10.1186/1472-6882-14-278. de Ménorval, M.-A., Mir, L.M., Fernández, M.L., Reigada, R., 2012. Effects of dimethyl sulfoxide in cholesterol-containing lipid membranes: a comparative study of experiments in silico and with cells. PLoS One 7, e41733. http://dx.doi.org/10.1371/ journal.pone.0041733. Falcioni, T., Papa, S., Gasol, J.M., 2008. Evaluating the flow-cytometric nucleic acid doublestaining protocol in realistic situations of planktonic bacterial death. Appl. Environ. Microbiol. 74:1767–1779. http://dx.doi.org/10.1128/AEM.01668-07. Fernández, M.L., Reigada, R., 2014. Effects of dimethyl sulfoxide on lipid membrane electroporation. J. Phys. Chem. B 118:9306–9312. http://dx.doi.org/10.1021/jp503502s. Grégori, G., Citterio, S., Ghiani, A., Labra, M., Sgorbati, S., Brown, S., Denis, M., 2001. Resolution of viable and membrane-compromised bacteria in freshwater and marine waters based on analytical flow cytometry and nucleic acid double staining. Appl. Environ. Microbiol. 67:4662–4670. http://dx.doi.org/10.1128/AEM.67.10.4662-4670. 2001. Gurtovenko, A.A., Anwar, J., 2007. Modulating the structure and properties of cell membranes: the molecular mechanism of action of dimethyl sulfoxide. J. Phys. Chem. B 111:10453–10460. http://dx.doi.org/10.1021/jp073113e.
180
A. Nescerecka et al. / Journal of Microbiological Methods 131 (2016) 172–180
Hamilton-Miller, J.M.T., 1966. Damaging effects of ethylenediaminetetra-acetate and penicillins on permeability barriers in Gram-negative bacteria. Biochem. J. 100, 675–682. Hammes, F., Egli, T., 2010. Cytometric methods for measuring bacteria in water: advantages, pitfalls and applications. Anal. Bioanal. Chem. 397:1083–1095. http://dx.doi. org/10.1007/s00216-010-3646-3. Hammes, F., Broger, T., Weilenmann, H.-U., Vital, M., Helbing, J., Bosshart, U., Huber, P., Peter Odermatt, R., Sonnleitner, B., 2012. Development and laboratory-scale testing of a fully automated online flow cytometer for drinking water analysis. Cytometry A 81A:508–516. http://dx.doi.org/10.1002/cyto.a.22048. Hewitt, C.J., Nebe-Von Caron, G., Nienow, A.W., McFarlane, C.M., 1999. Use of multi-staining flow cytometry to characterise the physiological state of Escherichia coli W3110 in high cell density fed-batch cultures. Biotechnol. Bioeng. 63:705–711. http://dx.doi. org/10.1002/(SICI)1097-0290(19990620)63:6b705::AID-BIT8N3.0.CO;2-M. Hoefel, D., Grooby, W.L., Monis, P.T., Andrews, S., Saint, C.P., 2003. Enumeration of waterborne bacteria using viability assays and flow cytometry: a comparison to culturebased techniques. J. Microbiol. Methods 55:585–597. http://dx.doi.org/10.1016/ S0167-7012(03)00201-X. Irvin, R.T., MacAlister, T.J., Costerton, J.W., 1981. Tris(hydroxymethyl)aminomethane buffer modification of Escherichia coli outer membrane permeability. J. Bacteriol. 145, 1397–1403. Khan, A., Vu, K.D., Riedl, B., Lacroix, M., 2015. Optimization of the antimicrobial activity of nisin, Na-EDTA and pH against gram-negative and gram-positive bacteria. LWT. Food Sci. Technol. 61:124–129. http://dx.doi.org/10.1016/j.lwt.2014.11.035. Kraniak, J.m., Shelef, L.a., 1988. Effect of ethylenediaminetetraacetic acid (EDTA) and metal ions on growth of Staphylococcus aureus 196E in culture media. J. Food Sci. 53:910–913. http://dx.doi.org/10.1111/j.1365-2621.1988.tb08983.x. Lautenschlager, K., Hwang, C., Liu, W.-T., Boon, N., Köster, O., Vrouwenvelder, H., Egli, T., Hammes, F., 2013. A microbiology-based multi-parametric approach towards assessing biological stability in drinking water distribution networks. Water Res. 47:3015–3025. http://dx.doi.org/10.1016/j.watres.2013.03.002. Lehtinen, J., Nuutila, J., Lilius, E.-M., 2004. Green fluorescent protein–propidium iodide (GFP-PI) based assay for flow cytometric measurement of bacterial viability. Cytometry A 60A:165–172. http://dx.doi.org/10.1002/cyto.a.20026. López-Amorós, R., Comas, J., Vives-Rego, J., 1995. Flow cytometric assessment of Escherichia coli and Salmonella typhimurium starvation-survival in seawater using rhodamine 123, propidium iodide, and oxonol. Appl. Environ. Microbiol. 61, 2521–2526. MAK, 2002. The MAK collection for occupational health and safety. The MAK-Collection for Occupational Health and Safety. Wiley-VCH Verlag GmbH & Co. KGaA. Manini, E., Danovaro, R., 2006. Synoptic determination of living/dead and active/dormant bacterial fractions in marine sediments. FEMS Microbiol. Ecol. 55:416–423. http://dx. doi.org/10.1111/j.1574-6941.2005.00042.x. McDonnell, G.E., 2007. Antisepsis, Disinfection, and Sterilization: Types, Action, and Resistance. ASM Press, Washington, D.C. Nebe-von-Caron, G., Stephens, P., Hewitt, C., Powell, J., Badley, R., 2000. Analysis of bacterial function by multi-colour fluorescence flow cytometry and single cell sorting. J. Microbiol. Methods 42:97–114. http://dx.doi.org/10.1016/S01677012(00)00181-0. Nescerecka, A., Juhna, T., Hammes, F., 2016. Behavior and stability of adenosine triphosphate (ATP) during chlorine disinfection. Water Res. 101:490–497. http://dx.doi. org/10.1016/j.watres.2016.05.087. Nocker, A., Cheung, C.-Y., Camper, A.K., 2006. Comparison of propidium monoazide with ethidium monoazide for differentiation of live vs. dead bacteria by selective removal of DNA from dead cells. J. Microbiol. Methods 67:310–320. http://dx.doi.org/10.1016/ j.mimet.2006.04.015.
Notman, R., Noro, M., O'Malley, B., Anwar, J., 2006. Molecular basis for dimethylsulfoxide (DMSO) action on lipid membranes. J. Am. Chem. Soc. 128:13982–13983. http://dx. doi.org/10.1021/ja063363t. Phe, M.-H., Dossot, M., Guilloteau, H., Block, J.-C., 2005. Nucleic acid fluorochromes and flow cytometry prove useful in assessing the effect of chlorination on drinking water bacteria. Water Res. 39:3618–3628. http://dx.doi.org/10.1016/j.watres.2005. 06.002. Prest, E.I., Hammes, F., Kötzsch, S., van Loosdrecht, M.C.M., Vrouwenvelder, J.S., 2013. Monitoring microbiological changes in drinking water systems using a fast and reproducible flow cytometric method. Water Res. 47:7131–7142. http://dx.doi.org/10. 1016/j.watres.2013.07.051. Ramseier, M.K., von Gunten, U., Freihofer, P., Hammes, F., 2011. Kinetics of membrane damage to high (HNA) and low (LNA) nucleic acid bacterial clusters in drinking water by ozone, chlorine, chlorine dioxide, monochloramine, ferrate(VI), and permanganate. Water Res. 45:1490–1500. http://dx.doi.org/10.1016/j.watres.2010.11. 016. Shi, L., Günther, S., Hübschmann, T., Wick, L.Y., Harms, H., Müller, S., 2007. Limits of propidium iodide as a cell viability indicator for environmental bacteria. Cytometry A 71A:592–598. http://dx.doi.org/10.1002/cyto.a.20402. SLMB, 2012. Method 333.1: Determining the total Cell Count and Ratios of High and Low Nucleic Acid Content Cells in Freshwater Using Flow Cytometry. Stocks, S.M., 2004. Mechanism and use of the commercially available viability stain, BacLight. Cytometry A 61A:189–195. http://dx.doi.org/10.1002/cyto.a.20069. Vaara, M., 1992. Agents that increase the permeability of the outer membrane. Microbiol. Rev. 56, 395–411. Van Nevel, S., Koetzsch, S., Weilenmann, H.-U., Boon, N., Hammes, F., 2013. Routine bacterial analysis with automated flow cytometry. J. Microbiol. Methods 94:73–76. http://dx.doi.org/10.1016/j.mimet.2013.05.007. Virto, R., Mañas, P., Álvarez, I., Condon, S., Raso, J., 2005. Membrane damage and microbial inactivation by chlorine in the absence and presence of a chlorine-demanding substrate. Appl. Environ. Microbiol. 71:5022–5028. http://dx.doi.org/10.1128/AEM.71.9. 5022-5028.2005. Vital, M., Dignum, M., Magic-Knezev, A., Ross, P., Rietveld, L., Hammes, F., 2012. Flow cytometry and adenosine tri-phosphate analysis: alternative possibilities to evaluate major bacteriological changes in drinking water treatment and distribution systems. Water Res. 46:4665–4676. http://dx.doi.org/10.1016/j.watres.2012.06.010. Wan Norhana, M.N., Poole, S.E., Deeth, H.C., Dykes, G.A., 2012. Effects of nisin, EDTA and salts of organic acids on Listeria monocytogenes, salmonella and native microflora on fresh vacuum packaged shrimps stored at 4 °C. Food Microbiol. 31:43–50. http://dx.doi.org/10.1016/j.fm.2012.01.007. Williams, S.C., Hong, Y., Danavall, D.C.A., Howard-Jones, M.H., Gibson, D., Frischer, M.E., Verity, P.G., 1998. Distinguishing between living and nonliving bacteria: evaluation of the vital stain propidium iodide and its combined use with molecular probes in aquatic samples. J. Microbiol. Methods 32:225–236. http://dx.doi.org/10.1016/ S0167-7012(98)00014-1. Yu, Z.-W., Quinn, P., 1994. Dimethyl Sulphoxide: a Review of its Applications in Cell Biology. [WWW Document]. URL http://www.bioscirep.org/bsr/014/bsr0140259.htm (accessed 2.18.15). Zaika, L.L., Fanelli, J.S., 2003. Growth kinetics and cell morphology of Listeria monocytogenes Scott A as affected by temperature, NaCl, and EDTA. J. Food Prot. 66, 1208–1215. Zotta, T., Guidone, A., Tremonte, P., Parente, E., Ricciardi, A., 2012. A comparison of fluorescent stains for the assessment of viability and metabolic activity of lactic acid bacteria. World J. Microbiol. Biotechnol. 28:919–927. http://dx.doi.org/10.1007/s11274-0110889-x.