DEVELOPING AND TESTING A METHODOLOGY FOR DESIGNING FOR INTUITIVE INTERACTION
Alethea Blackler¹, Vesna Popovic¹ and Doug Mahar2 ¹School of Design, Queensland University of Technology, Brisbane, Queensland, Australia,
[email protected] 2
School of Psychology and Counselling, Queensland University of Technology, Brisbane, Queensland, Australia,
ABSTRACT:
A set of principles and a conceptual tool for designing for intuitive interaction have been developed based on previous experimental work. This tool has been tested with designers. The first test with one designer showed that analysing other products that the intended user group interacted with enabled him to understand key aspects of products they would already be familiar with, and include them in the design to allow it to be used more intuitively. A refined version of the tool was then tested by seven groups of postgraduate designers. They were asked for feedback via questionnaires. This paper will discuss the designers’ work, their feedback, and the further refinement of the tool. The main finding from the trials is that the tool works well but needs to be easier for designers to understand.
KEYWORDS: Intuitive interaction, intuitive use, design methodology
1
1. INTRODUCTION Intuitive interaction with a new interface requires a user to apply knowledge gained through other products or experience(s). Therefore, products that people use intuitively are those with features they have encountered before. Relevant past experience is transferable between products, and performance is affected by a person’s level of familiarity with similar technologies. Using familiar function, appearance and location for features helps people to use an interface quickly and intuitively the first time they encounter it. Nevertheless, older people use things less intuitively and more slowly than younger ones.
These claims are based on our experimental studies (Blackler, Popovic and Mahar 2003a; b; 2004a; b; 2005; Blackler 2006). We have developed a set of principles, a continuum and a conceptual tool based on our experimental work, with the aim of assisting designers in producing interfaces that are intuitive to use. We have discussed these in depth previously (Blackler et. al., 2005, Blackler, 2006) and will explain them briefly here. However, the main topic of this paper is the testing of the conceptual tool by designers, the work they produced using it, their feedback and the subsequent refinement of the tool.
1.1. FEATURES, FACTORS AND TECHNOLOGY FAMILIARITY Important terms used in the development and application of our methodology are explained here. They have been more thoroughly explained and explored elsewhere (Blackler, et al. 2003a; b; 2004a; b; 2005; Blackler 2006).
The definition of a feature, as the term is used here, is a function of a product that is discrete from others, has its own function, location and appearance and can be designed as a separate entity. A shutter button on a camera, a print icon on software or an earpiece on a stereo are all examples of features.
The experimental work showed that there were three factors of intuitive use for each feature on a product:(i) location of the feature, (ii) appearance of the feature and (iii) function of the feature. Each of these factors can be intuitive or not, without precluding the intuitiveness of other factors of the same feature. We found that
2
appearance is more important for intuitive interaction than location (Blackler, et al. 2004b; Blackler 2006).
Technology Familiarity was an important variable in this research. The technology familiarity questionnaire was designed to reveal information about participants’ experience and behaviour with products possessing similar features to the mediating product. The questionnaire asked participants about how often they used certain products, and how much of the functionality of those products they used. The questionnaire was used to calculate the technology familiarity score for each participant. More exposure to, and knowledge of, the products in the questionnaire produced a higher technology familiarity score. Rudinger et al.(1994) used a similar questionnaire to measure "general technical experience" of participants.
2. PRINCIPLES OF INTUITIVE INTERACTION The following principles have been uniquely combined by these authors specifically to facilitate intuitive interaction and are the foundation for the methodology reported in this paper. Numerous guidelines for detail design are available; colour, placement of text and so on (for examples, see Wickens, Gordon and Liu 1998), but there were previously no guidelines directed explicitly at intuitive interaction. Although application of some existing Human Computer Interaction guidelines may help people to use things intuitively, without guidelines aimed explicitly at intuitive interaction, designers have no way of knowing whether or not they will do so in a particular situation. These principles are developed from our empirical research into intuitive interaction and aimed explicitly at increasing its likelihood. A more in-depth discussion of the principles and their evolution can be found in Blackler et al. (2005, 2006).
2.1. PRINCIPLE 1: USE FAMILIAR FEATURES FROM THE SAME DOMAIN Make function, appearance and location familiar for features that are already known. Use familiar symbols and/or words, put them in a familiar or expected position and make the function comparable with similar functions users have
3
seen before. This is the simplest level of applying intuitive interaction and uses features transferred from similar contexts.
2.2. PRINCIPLE 2: TRANSFER FAMILIAR THINGS FROM OTHER DOMAINS Make it obvious what less well-known features will do by using familiar things to demonstrate their function. Again use familiar function, appearance and location. Principle 2 makes something that is completely new familiar by relating it to something already existing. This principle requires transfer of features from differing domains (either from different types of products or technologies or things from the physical world transferred to the virtual world).
2.3. PRINCIPLE 3: REDUNDANCY AND INTERNAL CONSISTENCY Redundancy involves tactics like using visual and audible feedback, including written labels as well as symbols or icons, and providing different ways of doing things so that both novices and experts, and older and younger users, can use the same interface easily and efficiently. Providing more options will enable more people to use the interface intuitively.
Increase the consistency within the interface so that function, appearance and location of features are consistent between different parts of the design and on every page, screen, part and/or mode. Internal consistency is consistency within a system between its various parts, and keeping internal consistency allows users to apply the same knowledge and metaphors throughout the interface (Kellogg 1989).
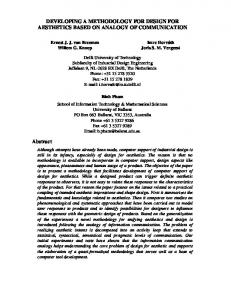
3. THE CONTINUUM A continuum of intuitive interaction was developed based on this research (Fig. 1). Very innovative products (or those based on very new technologies that have
4
no established conventions) may require the application of features from other domains or metaphors, whereas familiar technologies or features can utilise familiar things from similar products, or even standard stereotypes and body reflectors. These terms are shown at the top of the continuum box. Other theories and terms (shown at the bottom of the box) can also be seen as equivalent to these terms. All of these terms, and how they link to each other, are discussed in detail by Blackler et. al (2006), and the ones used in this paper (top line) are briefly explained below.
Fig. 1 also demonstrates how the principles relate to the continuum of intuitive interaction. Principle 1 relates to the simpler end of the continuum, where body reflectors, population stereotypes or familiar things from the same domain are applied. Principles 2 relates to transferring things from other domains, including the use of metaphor. Principle 3, internal consistency and redundancy (represented by the dotted line), needs to be considered at all times and so it surrounds the other principles.
Old
Product context or technology Principle 1
New Principle 2
Principle 3 Figure 1: The intuitive interaction continuum as it relates to the principles
3.1.
BODY REFLECTORS
The simplest application of intuitive interaction would be through body reflectors. Bush (1989) describes body reflectors as products or parts that resemble or mirror the body because they come into close contact with it, and claims that it is not necessary to be familiar with a particular body reflector in order to ascertain its relation to the body. This idea has also been discussed by Norman (2004) in relation to physical, or real, affordances.
5
3.2.
POPULATION STEREOTYPES
At a more complex level, intuitive interaction employs population stereotypes which are engrained from an early age, and derive largely from experience of cultural conventions. Strong stereotypes are less vulnerable to stress, change of body position and use of the non-preferred hand (Loveless 1963) and can shorten reaction or decision times, make operation faster and more precise, increase likelihood of correct first actions, and make learning to use a control quicker (Asfour, Omachonu, Diaz and Abdel-Moty 1991).
3.3.
FAMILIAR FEATURES
At the next level intuitive interaction can work through similar features from the same or differing domains. Our experiments were based on the differentiation of familiar and unfamiliar features, applied from both similar and differing domains, and they all showed that familiarity with a feature will allow a person to use it more quickly and intuitively (Blackler, Popovic and Mahar 2002; Blackler, et al. 2003a; b; 2004b; 2005).
3.4.
METAPHOR
At its most complex, intuitive interaction requires the application of metaphor, used to explain a completely new concept or function. Metaphors are grounded in experience (Lakoff and Johnson 1981), and allow people to transfer knowledge between domains, so when a person has relevant experience in a different domain, metaphors could be used to relate that knowledge to a new situation.
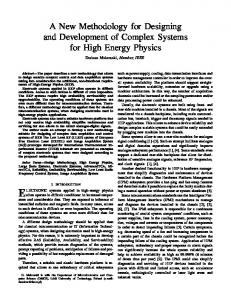
4. CONCEPTUAL TOOL FOR APPLYING INTUITIVE INTERACTION A tool was proposed to assist designers with applying intuitive interaction to new interfaces (Fig. 2). This tool is explained in more depth in Blackler et al. (2006). It includes the continuum (in a vertical orientation) juxtaposed with an iterative spiral, which represents a design process with a variety of entry and exit points.
6
The dotted line surrounding the spiral represents consistency and redundancy, which should be considered at all times during the design process. As indicated at the top of the diagram, before starting design, the designers need to establish who the users are and what they are already familiar with so that they know what stereotypes, features or metaphors would be suitable to apply. This investigation component and its attendant problems will be discussed in more depth later. Designers then need to go through the spiral twice. Firstly the structure or form of the system or product needs to be established. Once this first stage is completed the spiral is used for the detailed design of each feature.
Investigation component
Design process component
Figure 2: Conceptual tool for applying intuitive interaction during the design process
7
Each loop within the spiral has three layers. These layers represent the factors function, appearance and location (Fig. 3). The factors are addressed in this order as appearance has more effect on intuitive interaction than location (Blackler, et al. 2005), so needs to be addressed before location. However, appearance and location cannot be determined for a feature that has no associated function, so function needs to be determined first, followed by appearance and then location.
Figure 3: Detail of the three loops within each spiral.
The conceptual tool has been designed so that a designer can enter the spiral at a suitable point and leave it when necessary. The spiral should be exited at the point at which a suitable level is found, and then the next feature put through the same process. However, it is of course possible to have different features on the same product or system which are at different levels, depending on their function and requirements.
This tool has been tested with student designers to determine its efficacy and to refine it prior to testing with designers in practice. So far two trials have been undertaken and both are described in the following sections.
5. TRIAL ONE An undergraduate industrial designer was asked to design a digital camera over a 10 week period. He designed the form and the interaction of the camera, including all the menu functions, using the tool to consider function, appearance and location of each aspect in detail. The designer found that the tool forced him to spend a great deal more time investigating and analysing the intended users than he would otherwise. The tool encouraged him to gain an understanding of
8
information related to other products that the user group would already be experienced with.
During this process, the designer searched the literature for current trends in digital cameras and their users and buyers. He found that many new digital camera users are first becoming used to the idea of digital photography through using camera phones, and then buying digital cameras because they desire better picture resolution (PC_Magazine 2005). He then used a detailed product review to investigate existing digital cameras and mobile phones in order to establish the function, location and appearance of each feature relevant to digital camera design. The results from this product review were used to decide which features should be transferred to the new camera from existing cameras and camera phones.
The designer believed that this allowed a minor breakthrough to be achieved for the digital camera design (Figs. 4 and 5); the inclusion of soft keys to be used in conjunction with a 4 way navigation tool for menu interaction. By looking at the other products that the intended user group interacted with, he was able to include key aspects of products they would already be familiar with, to enable the new design to be used more intuitively. This is something that he did not believe he could have done if he had followed his usual design process.
Figure 4: Physical aspects of new camera design.
9
The design of the camera (Fig. 4) uses various aspects from the continuum: 1. Hand grip - Body reflector 2. 4 way navigation - Familiar feature from same and other domains (eg. phones, remote controls) 3. DISP button - Familiar feature from same domain 4. Menu navigation buttons - Familiar feature from other domain (mobile phones) 5. LCD screen - Familiar feature from same domain 6. Viewfinder - Familiar feature from same domain 7. Mode slider - Familiar feature from same domain
Figure 5: Menu icons for new camera design
The design of the menu (Fig. 5) uses various aspects from the continuum: o
Gallery and settings icons - Familiar features from other domain (mobile phones)
o
Timer, mode and macro icons - Familiar features from same domain
o
Compactor icon – Metaphor
o
Labels for menu navigation buttons (soft keys) – Familiar feature from other domain (mobile phones)
However, despite having produced a successful design, this designer felt that the significance of the investigation component was not conveyed by the tool in its existing form (Fig. 2). The investigation component (user group and user familiarity) takes up only a very small portion of the page when viewed in comparison with the design process component, which does not accurately portray the importance of the two initial steps. He suggested that the investigation component should have greater presence on the page, and perhaps give a more detailed description of what processes may be involved.
10
6. TRIAL TWO This trial was embedded into a postgraduate unit called “Advanced Ergonomics” as an optional part of the main project, which involved re-design of a consumer product. This is a team project which aims to elaborate on critical ergonomic and design analysis of a selected product. To help students integrate analysis techniques into their design process, they produce concepts for its redesign (Chamorro-Koc 2006).
The tool was tested by seven groups of designers, as their chosen methodology for the re-design project. They had more information and support for the investigation phase than during the previous trial. The two boxes “user group” and “user familiarity” were extrapolated with the use of questions, and also suggested methods for answering those questions (Fig. 6). Students were also provided with suggestions for library searches to help with answering these questions and mentored weekly. At the end of the process they provided us with copies of their designs and accompanying reports and were also asked for feedback via questionnaires.
Who are the users of previous devices or competitor’s products? Who are the users of products that perform similar or equivalent tasks? Are there general demographic trends?
Sales figures and market statistics Demographic data Brief/specification Literature on sales and market trends
Are there predicted trends in this market? Products/devices/artefacts
Literature on sales and trends What do they use?
Sales figures and market statistics Observations of user group
What are they buying? (to use themselves)
What else do they use? (eg at work or in public domain?)
Interviews with user group TF questionnaire
Which features do they use? International standards for relevant features What features do they need on new product?
What can be transferred from these things to a new product? (eg features from same or different domain)
Review of function, appearance and location of features of relevant products
Other experiences What other life experiences do they have that could be transferred? (eg body reflectors, population stereotypes and metaphors)
Observations Interviews Questionnaire or card sorting task for other experiences
Figure 6: Extrapolation of research phases provided for trial two.
11
6.1. INVESTIGATION METHODS Methods the student groups used to investigate the user group and user familiarity and to test their designs included literature searches, product reviews, questionnaires, recognition exercises to identify best icons/symbols, observations, expert analysis and primitive forms of participatory design. Literature search was fairly basic and based on recommended sources for demographic and market data. Some students found useful information but this was probably the most difficult data to find as so much market research is not in the public domain.
Most questionnaires used were based on the Technology Familiarity questionnaire, which was originally designed to elicit information about experiment participants’ use of various features of products (Blackler, et al. 2004a; Blackler 2006). It adapted well to this task and students often got useful information from this kind of exercise. Using this kind of questionnaire before a product review helped students to establish which products might be suitable to review.
Figure 7: Details of part of product review for remote control.
Product reviews (Fig. 7) involve looking at similar products and analysing them so that designers have an understanding of the most common functions, appearances
12
and locations of features that users are likely to be familiar with. Product reviews were used extensively, in fact probably too much, as in some cases they replaced all other research methods, which did not allow for a balanced final design. Really they need to be used in conjunction with other methods so that the whole design is not based only on familiar features from similar products, which can be boring and may have limited target markets.
Recognition exercises (Fig. 8) and observations, although only with limited numbers of users, allowed students to test their conclusions about familiar and intuitive symbols, icons and features, and to make decisions about which may work best if they had come up with two or more.
Figure 8: Example of recognition exercise used for PDA.
Participatory design, although again limited to small numbers, was successfully used to refine designs – for example to help establish location after appearance of features was decided (Fig. 9). Here users were asked to apply the most familiar or expected locations. Some groups also used expert appraisals to fine-tune their designs and make final decisions on appearance and location of features.
13
Figure 9: Images of participatory design session for a PDA.
6.2. DESIGNS Most of the groups produced successful designs, with some particularly thorough. We will discuss two of these here – one a good example of re-design of a product to make it more intuitive without changing its basic method of interaction, the other a good example of an innovative and exciting new product which is still intuitive.
6.2.1 IPOD The first was a re-design of the video IPOD. This group recognised that changing the circular scrolling pad which is the central method of interaction would adversely affect the brand as this has become well-loved by so many people. So they chose to concentrate on re-designing the aspects that their initial testing and interviews revealed as being the most problematic; the hold button, the on/off function, labelling of the back function and the incompatible directionality of the menu interaction. Through the initial “user group” stage of their investigation, the group members found that mobile phones were the products their target market was most familiar with, followed by digital cameras and other mp3 players. It was also felt that, as their biggest seller, the IPOD was a vehicle for Apple to entice people into their world. The new design should encourage this.
14
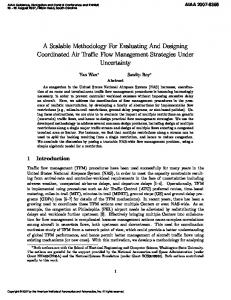
As demonstrated in Fig. 10, the hold feature was given a familiar label and screenbased reminder (familiar feature from mobile phones) and colour coding (population stereotype), although location was kept from the old design. The on/off function was moved from the play/pause button to a standard power button labelled and located as on most mobile phones. The menu/back feature was re-labelled using Apple’s own back symbol from their web browser Safari, which is familiar to those already using Apple computing products and may help to introduce others to Apple’s language while still being familiar enough (through use of backwards arrow) to be intuitive to most people. The menu was made more compatible with the scroll wheel (population stereotype) and also consistent with other Apple interfaces (familiar feature) by making it circular rather than vertical. Finally, the headphone jack was also moved as it was felt that the current position was problematic if the IPOD was kept in a pocket. As a result of thorough research, careful testing and compliance with the tool, an intuitive design which still retained the original feel of the product was achieved. Hold
New power button Old jack plug
Menus
Menu/back icon
Old power button
New jack plug
Figure 10: Old (L) and new (R) video IPOD designs.
15
6.2.2 MICROWAVE The micrwave group followed the tool closely, concentrated on covering all the details and came up with an innovative new design which we believe will be intuitive as well. The original product worked in a similar way to most domestic microwave ovens, with perhaps slightly more obscure functions than normal. The new design addressed all the main problems the students identified with the original product (Fig. 11) and went much further, offering an innovative solution soundly based on the principles and tool for intuitive interaction (Fig. 12).
The design objectives for this redesign were to: eliminate user confusion between buttons; help the user know what the next task is by guiding him/her through with prompts; maintain good feedback; and generate an agreeable relationship between the user and the microwave so that it is a pleasure to interact with
Figure 11: Original microwave design
16
Figure 12: New microwave design
This group discovered that microwave users are extremely diverse – ranging form children to the elderly, and covering all sorts of backgrounds. They used a technology familiarity-type questionnaire to find out which products were commonly used in the everyday lives of 34 microwave users aged 14-69. Results strongly indicated a group of products that were common among microwave users: cook top; refrigerator; ATM; Mp3/music player; television.
The group used card sorting to specifically identify the most suitable icons for the interactive display on the microwave. To conduct this test a number of icons which related to the five main functions were devised using the tool. Participants were asked to identify the most appropriate symbol to the function. A significant change in this area was the exchange of the ‘lightning bolt’ symbol for power level, to a coloured bar like that of a mobile phone (Fig. 13). It was found that all functions with stronger stereotypes such as the time setting function had the same result across all participants whilst less familiar functions such as defrost had more inconsistent and varied results.
17
Figure 13: Chosen icons
Observations were also carried out using paper prototypes of the designs (Fig. 14). The prototypes were set in a vertical position to evoke the feel of interacting with an actual microwave oven. The participants, ranging in age from 18 to 63, were asked to perform some common microwave tasks. The group also used an evaluations checklist (Ravden and Johnson 1989) as well as expert appraisals to help them refine their design.
Figure 14: Paper prototype evaluation
The dial was a considerable change from the numerical keypad (Figs. 11 and 12). The keypad cluttered the interface, made entering time more difficult than necessary and increased confusion with twelve additional buttons. The dial can be used without entering the menu (express cook), or in conjunction with the menu to use timer, defrost, etc. The population stereotype of clockwise to increase has been adhered to here. Because dials are used in a number of products, not just in the kitchen domain, the transfer to the microwave was easy to understand.
The dial incorporates two parts. The outside ring is used to adjust time. The inside button is to start and stop cooking. The ring and button incorporate lights to help the
18
user with understanding what needs to be done to complete the task. The green “START” light illuminates only when enough information has been entered for cooking to start, helping to guide the user through the interface, which was something that was severely lacking in the original product. The red “STOP” light is illuminated when the user can stop or pause cooking (colour coding based on population stereotype).
The deeper menu and use of soft keys allow more detailed information to be displayed, therefore helping to identify the function and use of each option (Fig. 15). The soft keys surrounding the screen correspond to icons which represent different functions. This soft key and screen combination is transferred from an ATM interface, which was found through the TF questionnaires to be commonly used throughout the user group. The screen tells the user which options are available and what needs to be entered next. The user can see all information they have chosen on the screen and the ‘back’ option allows them to easily retreat one level to re-choose options or change functions.
Figure 15: Example sub-menu
The group felt that the microwave would be much easier to use than conventional microwaves, and that the user and product could generate a better relationship. Conventional microwaves can have obscure preset functions that are represented on screen by unfamiliar icons, numbers or letters, and the manual has to be consulted before the user understands them. As the majority of users skip reading the manual (Rettig 1991; Smart, Whiting and DeTienne 2001), in the new design the options are shown on screen, with reasonable descriptions of what they can be used for so that they are easily understood by the entire range of users.
19
The group’s observations suggested that the new product is more intuitive to use than the original. The students believed that the transfer of features from another domain and the focus on the function, appearance and location of each feature was a huge success. The design maximises function with a minimal aesthetic, and the students felt that using our tool was a major factor in the increased usability of the product.
6.3. FEEDBACK Students were asked to fill in a questionnaire at the end of the semester to evaluate the tool. There were 17 responses. Overall, effectiveness of the tool in making their new design intuitive to use was rated at a mean of 5.05 out of 6. The main body of the questionnaire was split into two sections; investigation and design process components of the tool (Fig. 2). The investigation component covered the user group and user familiarity steps (extrapolated in Fig. 6), while the design process component included the spiral section with the continuum alongside. The questionnaire ended with two more general questions.
6.3.1. INVESTIGATION COMPONENT A large proportion (82%) believed this part of tool made them do investigations they would not normally have done as part of the design process, and usefulness of information found through this process was rated at mean 4.52 out of 6. However, ease of use of the question format (Fig. 6) scored a mean of only 4 out of 6, and usefulness of the question format in helping to find information 4.17 out of 6. The directions and hints provided (far right column of Fig. 6 and also additional material provided on library resources) scored 4.4 out of 6 for how helpful they were in helping to find information.
An open ended question asked for any other comments or feedback on this component of the tool. Not many responded but some comments indicated that this component was difficult to understand at first, and that the technology familiarity questionnaire was useful although limited to the products chosen to go into it.
20
6.3.2. DESIGN PROCESS COMPONENT Usefulness of design process component scored a mean 4.58 out of 6, but ease of understanding design process component scored lower at mean 3.79 out of 6. How easy it was to follow as part of design process scored 4.2 out of 6, and how useful it was in applying the information they had researched scored 4.58 out of 6. The two layers in the design process (structure and features) scored 4.1 for usefulness.
The majority (58.8%) got confused or lost at some point in this component. Reasons for this included; not understanding the tool at first, difficulty understanding and remembering the five levels, clarity of what needs to be done at each level, and need for examples for each level.
The open ended question for this component elicited comments such as; I keep forgetting what the three layers are, I do not go consciously through all layers for every feature, good for keeping structure and consistency in testing, I still find it difficult to understand, and it is easy to follow in design process as long as it is understood.
6.3.3. GENERAL QUESTIONS Two questions were used at the end – asking for general feedback on the usefulness of the tool and also what students felt they had learned from the experience.
Responses about usefulness of the tool included: o
There is a need for this and it does aid in designing more usable products.
o
More used as a reminder.
o
Very useful and could have very wide range of applications.
o
Clear and effective.
o
Thorough and made student want to follow it.
o
Helped keep project within scope and direct towards intuitive interaction rather than other aspects.
o
Simple transfer of features useful.
o
Made them think differently about more aspects.
o
Very beneficial.
o
Useful although not well understood at first.
21
o
Final design much different to what it would have been if model not used.
o
Levels good as they kept students focussed and reminded them where to go next.
Students felt they had learned: o
An increased capacity to design for the user.
o
That it was easier than expected to create intuitive design
o
To be open to applying other domains otherwise may not have thought of
o
Broader understanding of the subject.
o
To consider other aspects and explore all sorts of products used by the target market.
Overall, responses to the tool from the students were very positive and they were enthusiastic about its potential to improve interfaces. However, the feedback indicates that the tool is more useful than it is usable.
7. CONCLUSIONS The designs produced during trial two are rated by us as better and more intuitive than the originals. Experimentation will tell empirically if this is the case. Feedback has been overwhelmingly positive and the tool works well in a pedagogical context but is not very intuitive itself. It works in this context as the designers have a detailed introduction and mentoring throughout the process. The two layers (structure/form and features) could be confusing and may be seen as overly proscriptive. Designers know what they need to design and when, so removing the separate system structure and feature design boxes could simplify the tool. The trials have also shown that the tool needs to be more flexible, with better aide memoirs and examples to keep designers on track throughout the process. Paradoxically, it also needs to be simpler and easier to understand.
7.1
EXPERIMENTATION
The microwave interface (Fig. 12) is currently being prepared for testing against the original microwave design (Fig. 11) with groups of old, young-old and young users. This experiment is designed to establish whether the new design is more intuitive (i.e. whether the tool is effective). The experiment is also intended to make it possible
22
to distinguish between differences in performance that are related to loss of faculties through ageing and those that are related to less effective use of intuition, in order to reveal more about the relationship between intuitive interaction and age.
7.2. REFINING THE TOOL Based on the feedback from the second trial, we have extrapolated the research stage using the questions shown in Fig. 6. The processes that might feed in to the user group and user familiarity boxes are shown in Fig. 16. The system and feature layers have also been combined.
Figure 16: Extrapolating the investigation component
This process gives designers a clearer idea of the sort of investigation they would need to do in order to understand what users already know. However, simply adding it to the top of the existing tool adds further complexity. Therefore, we are currently working on refining the tool to make it easier to understand and follow. It will be refined again based on the forthcoming experimental results, then tested with designers in practice and finally developed into an interactive software tool that has the benefits of both simple and intuitive understanding and interaction as well as depth and breadth of information and advice.
ACKNOWLEDGEMENTS: We wish to acknowledge the contributions of the students who took part in the trials, and of our teaching colleagues who welcomed us into the Advanced Ergonomics unit.
23
REFERENCES: Asfour, S.S., Omachonu, V.K., Diaz, E.L., Abdel-Moty, E., 1991. Displays and Controls. In: Mital, A., Karwowski, W. (Eds.), Workspace Equipment and Tool Design. Elsevier, New York, pp. 257-276. Blackler, A., Popovic, V., Mahar, D., 2002. Intuitive Use of Products. In: Durling, D., Shackleton, J. (Eds.), Common Ground Design Research Society International Conference 2002. Staffordshire University Press, London, September 5-7. Blackler, A., Popovic, V., Mahar, D., 2003a. Designing for Intuitive Use of Products. An Investigation, 6th Asia Design Conference, Tsukuba, Japan, October 14-17. Blackler, A., Popovic, V., Mahar, D., 2003b. The Nature of Intuitive Use of Products: An Experimental Approach. Design Studies 24, 491-506. Blackler, A., Popovic, V., Mahar, D., 2004a. Studies of Intuitive Use Employing Observation and Concurrent Protocol. In: Marjanovic, D. (Ed.), Design 2004 8th International Design Conference, Dubrovnik, Croatia, pp. 135-142, May 17-20. Blackler, A., Popovic, V., Mahar, D., 2004b. Intuitive Interaction with Complex Artefacts. In: Redmond, J., Durling, D., DeBono, A. (Eds.), Futureground Design Research Society International Conference. Monash University, Melbourne, November 17-21. Blackler, A., Popovic, V., Mahar, D., 2005. Intuitive Interaction Applied to Interface Design, International Design Congress, Douliou, Taiwan, November 1-4. Blackler, A., 2006. Intuitive Interaction with Complex Artefacts, PhD thesis, School of Design, Queensland University of Technology, Brisbane, Unpublished PhD thesis, available at http://adt.library.qut.edu.au/adt-qut/public/adt-QUT20060926.142725/. Blackler, A., Popovic, V., Mahar, D., 2006. Towards a Design Methodology for Applying Intuitive Interaction. In: Friedman, K., Love, T., Côrte-Real, E., Rust, C. (Eds.), Wonderground, Design Research Society International Conference. CEIADE – Centro Editorial do IADE, Lisbon, Portugal, November 1-4. Bush, D.J., 1989. Body Icons and Product Semantics. In: Vihma, S. (Ed.), Semantic Visions in Design. Univeristy of the Industrial Arts, Helsinki, pp. c1-c14, Chamorro-Koc, M., 2006. ADP218 Advanced Ergonomics. Week One Unit Information. Queensland University of Technology, Brisbane. Kellogg, W.A., 1989. The Dimensions of Consistency. In: Nielsen, J. (Ed.), Coordinating User Interfaces for Consistency. Academic Press, Inc, San Diego, CA, pp. 9-20. Lakoff, G., Johnson, M., 1981. The Metaphorical Structure of the Human Conceptual System. In: Norman, D.A. (Ed.), Perspectives on Cognitive Science. Ablex, Norwood, NJ, pp. 193-206. Loveless, N.E., 1963. Direction-of-Motion Stereotypes: a Review. Ergonomics 5, 357-383. Norman, D., 2004. Affordances and Design, available at http://www.jnd.org/dn.mss/affordances_and_desi.html. PC_Magazine, 2005. Study: Camera Phones Boosting Digital Camera Sales, PC Magazine, available at http://www.looksmarttech.com/p/articles/mi_zdpcm/is_200508/ai_n14909764. Ravden, S., Johnson, G., 1989. Evaluating Usability of Human-Computer Interfaces: A Practical Method. Ellis Horwood Ltd, Chichester. Rettig, M., 1991. Nobody Reads Documentation. Communications of the ACM 34, 19-24. Rudinger, G., Espey, J., Neuf, H., Paus, E., 1994. Aging and modern technology: how to cope with products and services. In: Snel, J., Cremer, R. (Eds.), Work and Aging: A European perspective. Taylor and Francis, London, pp. 163-171. Smart, K.L., Whiting, M.E., DeTienne, K.B., 2001. Assessing the Need for Printed and Online Documentation: A Study of Customer Preference and Use. The Journal of Business Communication 38, 285-314. Wickens, C.D., Gordon, S.E., Liu, Y., 1998. An Introduction to Human Factors Engineering. Addison-Wesley Educational Publishers Inc, New York.
24