estimation system to reduce the uncertainty associated with flood level predictions. ... this early stage that uncertainties in information and data are greatest.
A PRACTICAL APPROACH TO UNCERTAINTY IN CONVEYANCE ESTIMATION CAROLINE MCGAHEY Dr PAUL SAMUELS CEng CMath FIMA MICE MCIWEM HR Wallingford Ltd, Howbery Park, Wallingford, OX10 8BA ABSTRACT Water level prediction is essential for the management of flood management risks through strategic planning, risk mapping, scheme design, forecasting and warning, and channel operation and maintenance. Flood level predictions based on existing software provide no indication of the associated uncertainty. This uncertainty arises from many factors including approximations to the fluid mechanics, natural variability in river resistance and the use of judgement or experience in applying models. These all produce differences between assessment of river channel capacity and its “true” value. In 2001, the Environment Agency commissioned the development of a new conveyance estimation system to reduce the uncertainty associated with flood level predictions. A key component of this work was to quantify the uncertainty in water level for a given flow rate, and present it in a manner which can be readily interpreted by the user and enable better, more informed decisions. This paper provides insight into the selected approach, essentially driven by the identified end-users and their needs, together with a sensitivity analysis of the parameters contributing to the uncertainty. KEYWORDS Flood Modelling, River Resistance, Uncertainty 1. INTRODUCTION - THE CONVEYANCE ESTIMATION SYSTEM PROJECT In the past two decades university led research on the EPSRC Flood Channel Facility at HR Wallingford, in laboratory flumes and on real rivers has resulted in a step advance in the understanding of flow phenomena in complex river and flood plain systems. This major managed research programme centred around the FCF and was co-funded by EPSRC, by the Environment Agency and by the former MAFF and NRA. This research improved understanding of many of the processes that determine the flood capacity of river and flood plain systems. However, this new knowledge was not transferred successfully into practice within the UK flood defence community. The Environment Agency therefore commissioned HR Wallingford in association with nominated experts, to carry out a “Scoping Study for Reducing Uncertainty in River Flood Conveyance” to determine how this knowledge could be implemented in the flood risk management process. A copy of this report will be found on the project website http://www.river-conveyance.net. This scoping study has led to the development of the Conveyance Estimation System (CES) as a part of the Engineering theme of the DEFRA - Environment Agency flood defence R&D programme. The work has been undertaken by HR Wallingford in association with CEH (Dorset), Birmingham, Glasgow and Heriot-Watt Universities and with Edward Evans (Independent Consultant). The CES comprises the Roughness Advisor and the Conveyance Generator implemented both as stand-alone software and enabled within the ISIS river modelling software. The CES provides advice and procedures to estimate the uncertainty in the predictions; this paper presents the approach adopted to the estimation of uncertainty in practice whereas other papers describe other aspects of the work (Samuels et al, 2002a; Samuels et al, 2002b; McGahey & Samuels, 2003; Fortune et al, 2004; McGahey & Samuels, 2004). The potential economic benefits of the use of improved methods for conveyance estimation will come from altering design, operation and maintenance practice as the degree of uncertainty is reduced. Strategic decisions made early in the project life cycle can have far reaching consequences and it is at this early stage that uncertainties in information and data are greatest. There is a close relationship between uncertainty and risk in that the greater the uncertainty the greater the probability of the project or maintenance activity of not achieving its objective. This is linked to the confidence on the performance of the scheme or process to meet its intended objectives. Thus, optimisation of performance and the confidence with which performance can be delivered are linked inexorably with understanding and controlling uncertainty.
10.3.1
2. RISK, UNCERTAINTY, ACCURACY AND ERROR In recent years the emphasis in the UK has moved from Flood Defence to Flood Risk Management. A Defra-Environment Agency R&D report (Environment Agency, 2002) describes the nature and assessment of flood risk. A difficulty with the language of risk is that it has been developed across a wide range of disciplines and activities. It is common to describe risk as a combination of the chance of a particular event (i.e. a flood), with the impact that the event or hazard would cause if it occurred. Evaluating risks involves identifying the hazards associated with the risk issue, i.e. what in a particular situation could cause harm or damage, and then assessing the likelihood that harm will actually be experienced by a particular population and what the consequences would be. Thus to evaluate the risk, it is necessary to consider the three generic components: • the nature and probability of the hazard • the degree of exposure of people and assets to the hazard • the vulnerability of the people, assets etc to damage should the hazard be realised. In describing each of these there is likely to be an element of imprecision depending upon the data available and methods employed. Most engineering “failures” (such as those leading to flooding) arise from a complex and often unique combination of events and thus statistical information on their probability and consequence may be 1 scarce or unavailable. Under these circumstances the engineer has to resort to models and expert judgement. Models will inevitably be an incomplete representation of real life and so will generate results, which are uncertain. Similarly, human expert judgement is subjective and thus uncertain as it is based on mental models and personal experience, understanding and belief about a situation. So in practice every measure of risk has uncertainty associated with it. Uncertainty arises mainly from lack of knowledge or of ability to measure or to calculate and gives rise to potential differences between assessment of some factor and its “true” value. Understanding this uncertainty within our predictions and decisions is at the heart of understanding risk. Within uncertainty we are able to identify: • knowledge uncertainty from lack of knowledge of the behaviour of the physical world, • natural variability from the inherent variability of the real world and • decision uncertainty from the complexity of social and organisational values and objectives. However, this classification is not rigid or unique. For example, uncertainty on weather or climate will be taken as “natural variability” within flood risk management but as “knowledge uncertainty” in the context of climate simulation. It is helpful also to consider the differences between accuracy, error and uncertainty. Accuracy and error differ from uncertainty as defined above but limitations in accuracy or the possibility for human error will contribute to the overall uncertainty. • Accuracy deals with the precision to which measurement or calculation is carried out; potentially, accuracy can be improved by better technology. • Errors are mistaken calculations or measurements with quantifiable and predictable differences 3. COMPONENTS OF UNCERTAINTY IN THE CONVEYANCE ESTIMATION SYSTEM 3.1 Principal influences The uncertainties in conveyance estimation are principally due to natural variability and knowledge uncertainty. Two contributions are normally recognised in knowledge uncertainty; these are: • Process model uncertainty in any deterministic approach used in the assessment • Statistical uncertainty arising from the selection and fitting of statistical distributions and parameters from data within the assessment In the CES no use is made of statistical modelling and so issues of statistical uncertainty do not arise. However, in the overall estimation of flood risk there will be an important component of statistical uncertainty arising from any hydrological estimation procedures for flood flow. The important components of process model uncertainty in the estimation of conveyance are: • process model uncertainty arising from the selection and approximation of physical processes and from parameterisation made in the definition of conveyance • representation of topography through the density of discrete survey points and interpolation rules between them, i.e. the difference between the profile of the river and of the physical features on the flood plain as represented in the calculations and the river in “real” life 1
By “engineer” we include all professionals involved in making decisions related to the management of flood risk whether or not they are Chartered Engineers.
10.3.2
• uncertainty related to data accuracy from the limitations of the survey methods used • uncertainties arising from parameter estimation – particularly the experience and expertise of the modellers who set up and calibrate computational models of river flows
• uncertainties from the model calculation methods, approximations and rules; these are the domain of traditional numerical analysis. The contributions to uncertainty from natural variability include • seasonality of plant growth from variation in temperature, light and nutrients (and hence resistance of vegetation in channels), • “memory” in the system e.g. from vegetation or river bed conditions being changed by a flood or through episodic input of sediments into the river system washed off the land surface, • secondary influences of temperature on water viscosity and hence Reynolds’ number and flow and sediment transport capacity of channels 3.2 Importance of contributions 3.2.1 Physical processes In the development of the CES, a specific mathematical process model has been adopted based upon the fundamental equations of fluid mechanics with empirical models for the effects of river meanders and the variation of the water depth across the section. This process model accounts for a greater diversity of the physics of the water movement in rivers that the methods previously used in standard modelling packages. Thus it is to be expected that the contribution o the process model uncertainty due to the formulation of the physics of the flow has been reduced. 3.2.2 Topographic representation Previous research on the representation of river topography, Defalque et al (1993) indicated that the uncertainties from this source could be controlled by an adequate frequency of survey information. This is achieved by the normal survey specifications used by the Environment Agency. 3.2.3 Data accuracy The development of the CES did not consider specifically the uncertainties from the typical accuracy of the topographic data sources; however, it is expected that these will be similar to their influence on the uncertainty when using the traditional calculation methods. This has been analysed for the procedures in the US for the prediction of the 100-year flood by Burnham & Davis (1990). The Agency is making widespread use of new data sources, for example LiDAR or the new national flood plain mapping project in the preparation of indicative flood plain maps and for CFMP strategies. It would be appropriate to examine the influence of the typical accuracy of these measurements and formulate guidance on the density of the data grid on the consequent flood levels. 3.2.4 Model Parameters The parameters in a model are the “constants”, chosen to represent the chosen context and scenario. In general the following types of parameters can be recognised: • Exact parameters, which are universal constants, such as the mathematical constants, e.g. π • Fixed parameters, which are well determined by experiment and may be considered exact, such 2 as the acceleration of gravity, g (approximately 9.81 m/s ). • A-priori chosen parameters, which are parameters that may be difficult to identify by calibration and are assigned certain values. The values of such parameters are associated with uncertainty that must be estimated on the basis of experience, for example from detailed measurements. • Calibration parameters, which must be established to represent particular circumstances. They are determined by calibrating model results for historical data on both input and result. Parameters are generally chosen to minimise the difference between model results and measurement for the same event. The parameter set for a “satisfactory” calibration is unlikely to be unique. The CES contains several a-priori chosen parameters in the model of velocity variation across the river channel although there is an option which allows the “expert” user to vary these. The CES also contains calibration parameters – these are the values of river resistance which are either determined by systematic variation to match observed flow conditions or estimated from the roughness advisor (i.e. calibrated against vegetation type or spatial location).
10.3.3
3.2.5 Calculation methods The CES contains several numerical methods to generate (approximate) solutions of the mathematical model for any water depth or flow rate. These include an automatic division of the cross-section into a computational grid which is sufficiently fine to ensure that the uncertainty associated with the differences between the numerical solution and the “true” solution of the mathematical model are much smaller than the uncertainties in the selection of the model parameters. 3.2.6 Natural variability The Roughness Advisor includes some account of the typical seasonal variation in resistance due to the growth and decay of vegetation. This generic information has been established from a variety of sources and includes an element of professional judgement. There is no guarantee that any particular year will match the average but the user can explore scenarios of advancing or delaying the seasonal growth-decay cycle and include the effects of river “maintenance” activities. No information can be given on the probability of the seasonality Other factors classified as natural variability are not incorporated in the standard version of the CES; however, there is an “expert” option for researchers to explore the effects of temperature in experimental facilities. Thus the CES has not reduced the uncertainties in conveyance arising from the erosion, transport or deposition of sediments, system “memory” or temperature. 4. REPRESENTATION AND ASSESSMENT OF UNCERTAINTY 4.1 The Italian Flag concept This involves a decision process where the results are given a green light for reliable results, a white light for some uncertainty or a red light for poor results. Each parameter is given a colour rating and the overall colour is then assessed. This method is limited as it is based on subjective decisions, cannot be quantified and within the white area, the level of uncertainty cannot be determined, e.g. closer to green or red. 4.2 Scenario Assessment The Intergovernmental Panel on Climate Change (IPCC) is overseeing the international research effort on assessment of potential climate change, its environmental and social impacts and policy responses. This is an area where complex interactions abound and there is significant uncertainty inherent in the “predictions”. The IPCC has issued guidance on the treatment and interpretation of uncertainty in the context of climate modelling, impact analysis and consequent decisions (IPCC, 2001). Climate change impact analysis is conducted in terms of “scenarios” which set as inputs atmospheric emissions to GCM climate simulations as described in the IPCC (2001) Third Assessment Report. These scenarios are not quantitative predictions about future conditions but are described as “projections” which enable a qualitative assessment to be made on the potential direction and magnitude of impacts. It is a truism that the only definite statement which can be made about the scenarios is that they all have zero probability as accurate forecasts of the future. The Environment Agency (2003) guidance on climate change recommends approaches to include the potential effects of climate change in flood risk management. The guidance suggests the following categories based on the UKCIP02 high, medium and low relative levels of confidence in the results of climate model scenarios • Projection – confidence in the direction and approximate magnitude of change • Contingency – realistic and consistence national allowance to the upper end of the range of “possibilities” • Sensitivity – “What-if” tests but with no confidence in particular scenarios of change Like the Italian Flag concept, this categorisation in scenario assessment provides no information on the probability of any of the results, but gives a framework for judgement of the degree of “belief” which may be given to the results. 4.3 RASP and flood defence planning RASP takes a tiered approach to assessing flood risk expressed in terms of expected economic damage. The amount of resources invested in data acquisition and analysis reflect the importance of the decisions that the risk assessment is being used to inform. The High Level analysis is performed
10.3.4
on a national scale and therefore only data that is available for the entirety of England and Wales can be used. The Intermediate Level incorporates additional information on loading, floodplain topography and defence structure. The Detailed Level uses information about the correlation of loads and composition of the defences and a much more detailed study of their potential to fail to provide the most accurate flood risk assessment. All three tiers of assessment share some common elements: • description of defence response in terms of defence “fragility” • assessment of the loads imposed on the defence system, • estimation of inundation extent for given defence failure scenarios, and, • calculation of damages resulting from flooding. A simple, yet explicit method of representing uncertainty at all stages of the flood risk assessment is applied. The uncertainty is represented by probabilistic description where appropriate and through the identification of upper and lower bounds of the uncertain quantities where such a detailed description is not appropriate, See Figure 4.1.
Water level or damage
upper central lower
Flow/ loading Figure 4.1
Upper and lower uncertainty bands in the RASP analysis
At the High Level, uncertainties in defence fragility, inundation extent and depth and flood damages are captured using upper and lower bounds on each of the parameters. Uncertainty in the loading is 2 captured within the defence fragility bounds . For each parameter a “best judgement” estimate can be taken from within the bounds. This does not always correspond to the arithmetic mean of the upper and lower bounds, for example the “best judgement” damage is taken based on a geometric mean. At the Intermediate Level, defence fragility and flood damages are again defined using bounds. At this level, loads are described probabilistically and inundation depths and extents are taken from hydrodynamic models. Hydrodynamic simulation of a number of river inflow conditions provides a description of the expected annual damage conditional on inflow. Uncertainty in river conveyance could readily be incorporated in estimating the “bounds”. The Detailed level has only been partially explored through RASP and is will likely to consist of a toolbox of solutions. Defence fragility is assessed using reliability methods. Loading conditions are described probabilistically. A more rigorous Monte-Carlo style approach may be appropriate when including river conveyance and flood extent uncertainty, although the extra computational burden may be too great. However, as at the previous two levels the final risk assessment output will be an upper and lower bound with a best estimate. Due to the limited nature of the original high level analysis there is unlikely to be a mechanism with which uncertainty in conveyance estimation can be incorporated into the analysis. Improved understanding and assessment of uncertainty in river conveyance will provide an opportunity to improve outputs from the intermediate and detailed levels of the RASP methodology. Currently, uncertainty associated with the modelling process and data is not considered in detail. The RASP methodologies have been designed not to be limited to specific models and so improvements to the risk assessment can be obtained with little disruption to the methodology and its data requirements. 2 Because no loading of crest level information is available nationally, exceedance probabilities were used to define the loads. Whilst uncertainty in loadings can be captured in the fragility curves (eg. wider bounds for low frequency events), this uncertainty is assumed to be consistent nationally.
10.3.5
4.4 Combined Distribution Analysis Where the quantity of interest is generated from a sum of the factors which are independent and each have a normal distribution, the combined uncertainty as measured by the overall variance, σt, can be calculated from:
σ t = {∑ σ i2 }
1/ 2
4.1
where σi is the standard deviation of the distribution of the i-th factor. However, if the quantity, F, of interest is a more general function of the factors, yi, which are still assumed independent with a normal distribution, and the uncertainty in the individual factors cause only small changes to the quantity of interest, then a first order variation assessment is feasible. We may define the overall influence of the uncertainties as
∂F σ i σ t = ∑ ∂y i
2
1/ 2
4.2
In this expression, all second and higher order terms and cross-correlations have been ignored. The PDF of F will be approximately a Normal Distribution in these circumstances. Where F is not a simple linear function then Equation 4.2 does not hold exactly but is sometimes used as an estimate, it value as an estimate decreases as the non-linearity in F or cross-correlation of factors become more significant. An implication of this is that the most probable value of water level from the rating curve is necessarily the water level associated with the most probable value of Manning’s n (!). Likewise for a general non-linear function F we find that the standard deviation (or variance) of water level is not simply related to the standard deviation of Manning’s n as would be implied by Equation 4.2 Despite these theoretical difficulties the approach of Equation 4.2 to the estimation of the uncertainty in the “result” of a process is recommended in the Environment Agency (2000) guidance on determination of freeboard. It is also the basis of the work of Samuels (1995) on combining uncertainties in flood level assessments from model calibration, numerical error, roughness estimation and topographic survey. 4.5 The Monte Carlo approach This involves determining the uncertainty in water level H from randomly sampling the uncertainty in the various factors which influence H. The value of H is obtained from taking sample values of each of the parameters that influence it e.g. channel and flood plain Manning’s n, bed level at each point across the section etc. The variability of each parameter is described through an associated probability distribution function (PDF) and possibly with cross-correlation relationships. The output H is obtained for a large number (many thousands) of randomly selected samples from each distribution using cross-correlation to obtain conditional probabilities if appropriate. The frequency distribution for H is then compiled from the realisations obtained and possible a new PDF fitted.
Combine many samples to generate output PDF
H = F ( nc , n f yi ,...) Random sample of each PDF
PDF for H
Figure 4.2
PDF for n c
The Monte Carlo approach
10.3.6
PDF for n f
PDF for y i
The advantage of this method is that an uncertainty distribution is obtained based on the sum effect of the individual PDFs and the method can be extended to add in the influence of more factors, such as the variability in the flood flows from hydrological assessment. The method is rigorous if the PDF is known for each of the input parameters, and can be used to estimate the variability of the results from assumptions about the input PDFs where these are not known. However, the approach is computationally intensive where there are many parameters to test and if the method is used to assess the variability of the result to assumptions on unknown distribution. If the approach is set within a larger analysis (such as a computational river model and incorporating hydrological PDFs) then the method my not be feasible for practical use.
5.
PRESENTATION AND USE OF INFORMATION ON UNCERTAINTY A key decision in developing advice and estimates of uncertainty was on how the information should be presented. Several approaches are possible as described above but some require considerable additional information and analysis to generate the results. Thus an appropriate starting point was to consider the users of the CES and how they might incorporate information on uncertainty into their decisions. This led to some requirements of the method in practice, it should: • express uncertainty in water level • link to and inform other Environment Agency - Defra risk approaches • be understandable to the user to facilitate better, more informed decisions in the situations they are responsible for • be as simple as possible in presentation • not require significant computational resources • ideally not require any additional input data • be credible by being based on existing scientific methods for uncertainty where possible. The potential direct and indirect users of the CES information have different needs for information on uncertainty in the decisions and plans they need to make. The project team’s review of needs of different users identified the potential use, importance and form of presentation of information on uncertainty as shown in Table 5.1 below. Table 5.1 Summary of Uncertainty users and their needs User community Use of uncertainty Importance Strategic Planning
Scheme Design
Maintenance
Flood Forecasting and Warning Hydrometry Regulation, insurance
Evaluating / comparing options against criteria such as effectiveness, efficiency, robustness, performance Change in water level for given flow rate (moving towards probabilistic optimisation for describing uncertainty)
High
Timing, scheduling and prioritisation of vegetation cutting and dredging Issue a warning? Operational decisions
Low to medium
Flow rate for a given depth (influences other stakeholders) Water levels, flood outlines, indicative flood risk mapping,
Medium to high
Medium to high
Low
High
Suitable presentation of uncertainty Upper and lower estimates
Upper and lower estimates Potentially probabilistic information for a full riskbased design appraisal of a major scheme Upper and lower estimates or nothing Possibly an upper estimate of flood level (and early estimate of arrival time) Upper/lower estimates Probabilistic Upper/lower estimates
There is a need for quantitative information on uncertainty so that the “Italian Flag” representation cannot be used in isolation. The approach finally adopted to respond to the user requirements combined elements of the other approaches described in Section 4.4 above. In terms of presenting quantitative information on uncertainty the important choices are whether to
10.3.7
• recommend the use of Monte-Carlo testing based • assign probabilities to the information given on uncertainty It was decided not to recommend either of these because making statements on probability would be give an appearance of confidence in the in quantification of information which is partly subjective in origin. In addition: • Monte Carlo testing requires considerable computation, particularly if the testing is embedded in a large flow simulation model. • the underlying information is not available for the probability distribution of river resistance values which is required by Monte Carlo resting • the information on river resistance is not homogeneous in origin • the effects of residual process model uncertainties cannot be quantified in any probabilistic manner • some information in the roughness advisor came from expert opinion rather than measurement However, it is important that the CES includes some quantitative statement on the effects of uncertainty even if probability (or likelihood or frequency) cannot be given. This has been achieved by illustrating the uncertainty in the relationship between water level and discharge through presenting a central estimate and credible upper and lower cases of water level for a given flow rate (Figure 5.1). The stage discharge curve is usually expected to lie within the upper and lower scenario bands, which may not be symmetrical about the mean. These bands should not be interpreted as minimum / maximum envelopes, but rather ‘soft’ boundaries within which the ‘true’ value is likely to occur. The central estimate represents the “best” assessment without any particular definition of “best”. It is important to note that the upper and lower cases • are not necessarily equally distributed about the central estimate (i.e. not just ± x%), • are not upper or lower bounds (i.e. it is possible for some real cases to lie outside the range), • are not for any specific confidence limits (e.g. ± 95%), and • are not simply related to the standard deviation of measured data.
h
∆h
Q Figure 5.1
Q
Representation of uncertainty for a rating curve
Instead they represent a practical choice of a degree of variability to include in the analysis for flood risk management applications, based upon the range of values found in the compilation of data on river roughness. The concentration of the scenarios on the influence of uncertainty in river roughness is justified in terms of the sensitivity analysis undertaken in the testing phase of the CES research. The use of the central estimate with the upper and lower cases ties in well with the accounting of uncertainty in the RASP system used in flood defence planning and also the practice of sensitivity testing usually undertaken as part of scheme design.
10.3.8
6. ESTIMATION OF THE OVERALL UNCERTAINTY 6.1 The dominant factors The dominant factor to be used in the analysis of the estimation of conveyance is the unit roughness as distributed across the section. A thorough review of the sensitivity of water level to both the a-priori chosen and calibration parameters identified roughness as having the most significant contribution to uncertainty in conveyance. The parameters considered were roughness, elevation of the floodplain and main channel, cross-chainage, planform sinuosity, temperature, longitudinal bed-slope and position of top-of-bank markers. The uncertainty of the input survey data depends largely on the method of measurement. The a-priori chosen parameters were the dimensionless eddy viscosity λ, the secondary flow coefficient Γ and the number of lateral divisions for integration. Other possible sources of uncertainty include non-modelled processes such as form losses, vertical accelerations through sudden local changes in depth, energy dissipation from sediment movement over mobile channel beds and lateral variations in surface water level around bends. 6.2 A Framework for Analysis As a pragmatic approach it is recommended that the overall uncertainty in a model application may be estimated from an analysis similar to that of Samuels (1995). The uncertainty in water level ∆hu is given by the “root sum of the squares” of the uncertainties in water level due to different parameters 1/ 2 2 2 2 2 2 (6.1) ∆ h u = ∆ h r + ∆ h s + ∆ h c + ∆ h ∆ x + ∆ h q ......
[
]
where the subscripts are, r for roughness where little or no calibration data exist s for survey data depending upon the method of survey c for calibration and extrapolation away from the calibrated state ∆x for numerical error (grid resolution and physical method) q for flow estimation (outside the use of the CES) and … represents any other commensurate factor The assumptions behind this type of formulation are that the sources of uncertainty are mutually independent and that they are roughly normally distributed. The numerical uncertainty ∆h∆x is small (order of magnitude smaller than the other parameters) and well controlled because the grid can be refined to ensure this i.e. cross-section spacing. The flow estimation or uncertainty due to the hydrometric analysis ∆hq is outside the scope of the CES, but experience shows that this is a key factor in scheme design, contributing about 40% of the overall uncertainty. The remaining factors are thus ∆hr, ∆hs and ∆hc. 6.3 Effect of calibration Calibration of the flow resistance alters the uncertainty in the estimation of conveyance. Calibration data for flow resistance should supersede the generic, non-site specific information in the Roughness Advisor. Calibration may result in a different value for the central estimate of water level for the calibration flow rate and there is no guarantee that a single roughness value will achieve a perfect calibration for water levels and flow rates observed on different occasions (due to natural variability). However, once the model has been calibrated, ∆hr and ∆hs are likely to decrease, narrowing the range of uncertainty but the exact PDFs for the calibrated and uncalibrated cases will be difficult to determine. 7. SOME EXAMPLES FROM THE CES The CES uncertainty approach is applied here to natural channels, assuming no available data. The implication is that the Roughness Advisor values are taken as the ‘best guess’ unit roughness values for the given site. The predicted stage-discharge estimates are then compared to the measured data, and a reasonable result is demonstrated if the observed data fall within the ‘soft’ or credible upper and lower bands. 7.1 River Main, Northern Ireland The first example is the River Main, located in County Antrim, Northern Ireland. Between 1982 and 1986 an 800 m portion of the channel was reconstructed and realigned to form a double trapezoidal channel from Lisnafillan Weir to the junction with Braid River. The final dimensions include a top width of 14 m, a total width inclusive of floodplains of 30 m and a bankfull depth of 0.9 m. The floodplains slope towards the main channel with a 1:25 gradient. The reach-averaged longitudinal bed slope is 1:500. The river-bed consists of coarse gravel with a sediment size of 10-20 mm. The main channel
10.3.9
side slopes consist of quarry stone (0.5 tonne weight, 100-200 mm size) and the with heavy weed growth. The test section is taken in a straight portion of the illustrates the stage-discharge curve as predicted by the CES, with no calibration. and lower uncertainty bands are indicated, and the observed data falls well boundaries.
berms are covered reach. Figure 7.1 The credible upper within these ‘soft’
2
CES central estimate 1.8
Measured data 1.6
Credible upper / lower bands
Stage m
1.4 1.2 1 0.8 0.6 0.4 0.2 0 0
10
20
30
40
50
60
3
Discharge m /s
Figure 7.1
Stage-discharge predictions for the River Main, County Antrim
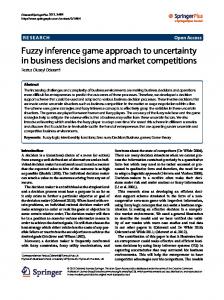
7.2 River Dane, Cheshire The second example is the River Dane, which rises in the Peak District, flows west to join the River Wheelock, and then flows north-west towards Northwick in Cheshire. The upstream catchment area is 2 3 407 km with a mean annual flood discharge of 78 m /s and a 1:100 year flood in the order of 3 161 m /s. The trapezoidal shaped cross-section, located in a fairly straight reach near Rudheath in Northwick, is characterised by thick vegetation growth at the channel edges, and less dense vegetation over the far-reaching flood plains. The main channel is 25 m wide, with a bankfull depth of 5 m, and a reach-averaged longitudinal bed slope of 1:2000. The total channel width, including the flood plains, is approximately 550 m. The available stage-discharge data from the Rudheath gauging station is from the period January to July 1995. Figure 7.2 shows the CES stage-discharge prediction and the corresponding credible upper and lower uncertainty bands. Here, the observed data is well predicted by the mean value, and all data falls within the upper and lower cases. 8. CONCLUSIONS This paper provides a review of current approaches to uncertainty, with emphasis on their applicability to the Conveyance Estimation System (CES) and the end-user requirements. The adopted methodology is based on the Combined Distribution Analysis theory in a form suggested by Samuels (1995). This selection is based on elimination of the other methods that are unsuitable due to their additional requirements such as Probability Distribution Functions for input parameter; a thorough assessment of the user groups and their needs; and the ease with which the method can be incorporated into the CES framework. In evaluating the uncertainty in flood level the key factors are the estimated flow, the channel roughness and the quality of survey data. The numerical grid resolution is of lesser importance. However the skill of the modeller is critical in obtaining a realistic model calibration to observed flow conditions. The uncertainty in the CES is represented through credible upper and lower bands about the stage-discharge curve, which are each based on a central, upper and lower unit roughness value provided by the Roughness Advisor.
10.3.10
7 Measured Data 6
Credible upper / lower bands CES central estimate
Stage (m)
5
4
3
2
1
0 0
20
40
60
80
100
120
140
160
180
200
Discharge (m3/s) Figure 7.2
Stage-discharge predictions for the River Dane, Northwick
The two cases for real river data from the River Main and the River Dane presented here illustrate the effectiveness of the CES uncertainty predictions in the absence of calibration data. In both cases, the measured data falls within the “credible” upper and lower uncertainty bands. The uncertainty approach is thus successful in quantifying the uncertainty in water level for a given flow rate, and presenting it in a manner which can be readily interpreted by the user and enable better, more informed decisions. 9. RECOMMENDATIONS The suggested uncertainty approach should be tested against a variety of real river measurements. Although additional data for determining the input parameter PDFs would be useful in describing the variability about the central value, this information is unlikely to change general practise and may generate additional confusion and difficulty in interpretation. 10. ACKNOWLEDGEMENTS This paper draws upon the Targeted Programme of research commissioned by the Environment Agency as project W5A-057 under the joint DEFRA / Agency Flood and Coastal Defence R&D Programme. We wish to thank Dr Mervyn Bramley, the Agency Project Manager for his encouragement and support. The contributions of all team members and academic expert advisory panel are also gratefully acknowledged. The views expressed in this paper are, however, personal and the publication does not imply endorsement by either the Environment Agency or the Department for Environment, Food and Rural Affairs (DEFRA). 11. REFERENCES Burnham, M.W. and Davis, D.W. 1990, “Effects of data errors on computed steady-flow”, Journal of Hydraulic Engineering, ASCE, 116(7), pp 914-929. Defalque A., Wark J.B. & Walmsley N. 1993, “Data density in 1-D river models”, Report SR 353, HR Wallingford, March. Environment Agency, 2000, “Fluvial Freeboard Guidance Note”, R&D Technical Report 187, Environment Agency R&D Dissemination Centre, c/o WRc, Swindon, SN5 8YF. Environment Agency, 2002, “Risk, Performance and Uncertainty in Flood and Coastal Defence: A Review”, R&D Report FD2302/TR1, Environment Agency R&D Dissemination Centre, c/o WRc, Swindon, SN5 8YF.
10.3.11
Environment Agency, 2003, “UK Climate Impacts Programme 2002 Climate Change Scenarios: Implementation for Flood and Coastal Defence: Guidance for Users”, R&D Technical Report W5B-029/TR, Environment Agency R&D Dissemination Centre, c/o WRc, Swindon, SN5 8YF. Fortune, D., Mc Gahey, C. & Nex A. 2004, “Improved Conveyance Estimation”, Paper to be presented at 6th International Conference on Hydroinformatics, Singapore, 21-24 June, pp 8. Hall J.W, Dawson R.J, Sayers P.B, Rosu C, Chatterton J.B & Deakin R, 2003, “A Methodology for National Scale Flood Risk Assessment”, Jnl Wat & Marit Eng, Proc Instn Civ Engrs, Vol 156, WM3, Proc paper 13074, pp 235-247 Intergovernmental Panel on Climate Change, 2001, Climate Change 2001, Impacts, Adaptation and Vulnerability, Cambridge University Press. McGahey, C. & Samuels, P.G. 2003, “Methodology for conveyance estimation in two-stage straight, skewed and meandering channels”, XXX IAHR Congress, Thessaloniki, Volume C1 of Proceedings published by IAHR. McGahey, C. & Samuels, P.G. 2004, “River Roughness – the Integration of Diverse Knowledge”, Paper to be presented at River Flow 2004, 2nd International Conference on Fluvial Hydraulics, Naples, 24-26 June, pp 10. Samuels, P.G. 1995, “Uncertainty in Flood Level Prediction”, XXVI Biannual Congress of the IAHR, HYDRA2000, London, Sept 1995, Volume 1 of Proceedings published by Thomas Telford. Samuels, P.G., Bramley, M.E. & Evans, E.P. 2002a, “Reducing Uncertainty in Conveyance Estimation”, Paper presented at River Flow 2002, Université Catholique Louvain, September 2002, Papers published by Balkema & Sons. Samuels, P.G., Bramley, M.E. & Evans, E.P. 2002b, “A New Conveyance Estimation System”, Paper presented at DEFRA Annual Conference of River and Coastal Engineers, University of Keele, September, Papers published by DEFRA, London.
10.3.12