Mazu DF-60P antifoam. (Mazer Chemicals, Gurnee, Ill.) was used at 0.625 ml. liter-'. The following nutrients (in grams per liter) were autoclaved separately in a ...
APPLIED AND ENVIRONMENTAL MICROBIOLOGY, Apr. 1991, p. 910-917
Vol. 57, No. 4
0099-2240/91/040910-08$02.00/0 Copyright © 1991, American Society for Microbiology
A Predictive and Feedback Control Algorithm Maintains a Constant Glucose Concentration in Fed-Batch Fermentations GARY L. KLEMAN,1 JEFFREY J. CHALMERS,2 GREGORY W. LULI,lt AND WILLIAM R. STROHL1* Departments of Microbiology' and Chemical Engineering,2 The Ohio State University, Columbus, Ohio 43210 Received 21 September 1990/Accepted 18 January 1991
A combined predictive and feedback control algorithm based on measurements of the concentration of glucose on-line has been developed to control fed-batch fermentations of Escherichia coli. The predictive control algorithm was based on the on-line calculation of glucose demand by the culture and plotting a linear regression to the next datum point to obtain a predicted glucose demand. This provided a predictive "coarse" control for the glucose-based nutrient feed. A direct feedback control using a proportional controller, based on glucose measurements every 2 min, fine-tuned the feed rate. These combined control schemes were used to maintain glucose concentrations in fed-batch fermentations as tight as 0.49 0.04 g/liter during growth of E. coli to high cell densities.
Fed-batch fermentation is commonly used to obtain high cell densities and/or maximal product formation (21, 41). The optimal strategy for the fed-batch fermentation of most organisms is to feed the growth-limiting substrate at the same rate that the organism utilizes the substrate, i.e., to match the feed rate with demand for the substrate (25). This is important, since an accumulation of substrate due to unbalanced feeding can be toxic to the organisms (5), can cause the formation of inhibitory by-products (13, 15, 26, 32), and can inhibit recombinant DNA (rDNA) product formation (2, 9, 16, 19). Four basic approaches have been used in attempts to balance substrate feed with demand (listed in order of increasing accuracy and/or complexity): (i) open-loop control schemes in which feeds were added according to historical data (34, 41, 43) or predicted growth (25); (ii) indirect control of substrate feeds based on non-feed source parameters (e.g., pH [28, 36, 37], offgas CO2 [35, 37], dissolved 02 [7, 23, 31, 42]) including concentrations of organic products (e.g., ethanol [4, 40], acetone, and butanol [17]); (iii) indirect control schemes based on mass balance equations (24), the values of which are calculated from data obtained by gateway sensors; and (iv) control schemes based on direct, on-line measurements of organic (3, 8, 14) or nitrogen (12, 38) substrate concentrations. A major limitation is that most of the current control strategies used and/or proposed, which are based on on-line measurements, respond only to a current change in the measured variable; they do not predict future changes in the substrate demand. This limitation can be particularly detrimental to fed-batch cultures, in which an exponential increase in substrate demand with time is present. We have recently described the construction and use of a glucose feedback control system (14) which was used to grow several Escherichia coli strains to high cell densities in fed-batch fermentation cultures while maintaining relatively low glucose concentrations (15). This system, however, was not sufficiently robust to control glucose concentrations consistently at the desired levels. Here we describe the development of a remarkably simple, two-component control scheme which predicts future glucose demands (GD) on *
the basis of recent rates of glucose consumed by the culture (feed-forward component), and corrects for minor offsets (feedback component). This control scheme has been used to grow E. coli from 1 to 65 g/liter while maintaining the soluble glucose concentration as tight as 0.49 ± 0.04 g/liter during the entire growth period. In an accompanying paper, we explain how we have adapted this control scheme for use with continuous, glucose-controlled nutristat cultures (11).
MATERIALS AND METHODS
Organism and inoculum preparation. E. coli B was obtained from the Ohio State University Culture Collection (OSU 333) and was maintained as slant cultures at 4°C between experiments. E. coli B was grown at 30°C for 48 h on Trypticase soy agar plates. The seed cultures, consisting of 400 ml of Trypticase soy broth, were inoculated from the Trypticase soy agar plates and incubated for 18 h at 32°C at 150 rpm on a rotary shaker. Fed-batch fermentation medium. The base fermentation medium (7.0 liters) consisted of the following (in grams per liter) casein hydrolysate (Delltown CE9OM), 40; KH2PO4, 7.5; Na2HPO4, 7.5; and K2SO4, 0.85. Mazu DF-60P antifoam (Mazer Chemicals, Gurnee, Ill.) was used at 0.625 ml. liter-'. The following nutrients (in grams per liter) were autoclaved separately in a volume of 100 ml and added to the fermentation base medium after cooling: MgSO4 7H20, 0.17; glucose, 0.5; trace elements solution, 0.8 ml liter-'. The trace elements solution was modified from that described by Pan et al. (26) and contained (in grams per liter of 5 N HCl) FeSO4 7H20, 40; MnSO4 H20, 10; AlSO4. 18H20, 28.25; CoCl2. 6H20, 4; ZnSO4 7H20, 2; Na2MoO4 H20, 2; CuCl2 2H20, 1; and H3BO4, 0.5. The final volume of the initial medium was 7.5 liters (7.0 liters of base medium, 0.1 liter of glucose-salts solution, and 0.4 liter of inoculum). Four feed solutions were used for fed-batch fermentation: (i) 2.0-liter solution of glucose (35 g liter-'); (ii) 1.5-liter solution of glucose (250 g- liter-') and MgSO4 7H20 (0.85 g liter-'); (iii) 2.0-liter solution of glucose (780 g liter-1) and MgSO4. 7H20 (8.58 g liter-'); and (iv) 1.0-liter solution of casein hydrolysate (400 g. liter-') and trace elements (32 ml liter-'). The flow rates of the different feed pumps were considered when determining the glucose concentra-
-
Corresponding author.
t Present address: Microlife Technics, Inc., Sarasota, FL 34230. 910
VOL. 57,
1991
911
GLUCOSE-CONTROLLED FED-BATCH FERMENTATION
tions of the feeds. The system is able to deliver glucose to the vessel over a wide range of rates, from approximately 0.5 to 700 g of glucose per h. The feed solutions were aseptically added to the fermentor by three different pumps, each controlled separately by the computer-ISAAC system (34) using a 4- to 20-mA RCA plug. Feed solutions i and ii were added separately by ColeParmer (model 7534-30) pumps (model 7013 pump head), whereas a single Cole-Parmer (model 7520-25) pump equipped with model 7013 and 7014 pump heads was used for feeds iii and iv, respectively. The pumps were calibrated before each run by pumping the feed into a sterile 1-liter Erlenmeyer flask placed on a Mettler PJ6000 balance (14, 15). The change of weight over time determined the flow rate for each setting. A linear regression was performed on the calibrations to obtain a slope and intercept for the feed rate, and this information was entered into the computer to determine the needed electrical output for the calculated feed rate. When calibrating the pump for feed iii, the weight was divided by 1.2 as a correction factor for the density of a 78% glucose solution. Fermentation setup. The fermentation hardware (34) and general on-line glucose measurement procedures (14) have been described previously. To shorten the lag time between the glucose analyzer and the sampling stream, the method for obtaining a clean stream from the Megaflow TM100 tangential-flow filter was modified from the previously described procedure (14). A hole was cut in the filtrate tube approximately 8 cm from the filter assembly, and the model 7014-13 tubing (Cole-Parmer) was inserted to run up to the filter plate within the filtrate tube. The hole with the model 7014-13 tubing was sealed with silicone glue. The number of strokes of the glucose analyzer sample pump per minute was set so that the glucose sample was taken directly from the filter plate. The response time of this modified system was found to be less than 1 min (data not shown). The filtration membrane used in the Megaflow was a Millipore GVLP OHV 0.22-jm-pore-size filter cut to fit the Megaflow design. The on-line glucose analysis system, which used a prototype YSI 2000 glucose analyzer (YSI, Inc., Yellow Springs, Ohio) and an Apple Ile computer linked with an ISAAC-91A A/D-D/A convertor, has been described by Luli et al. (14). Concentrations of 2 and 7 g of glucose liter-' were used for standardization of the on-line system for fermentations controlled at 0.5 and 5.0 g of glucose liter-', respectively. The dissolved oxygen was monitored by a Braun MRR-1 dissolved oxygen meter and an Ingold polarographic oxygen probe. The dissolved 02 was kept at the desired level (70%) by adding pure oxygen while decreasing the amount of air to keep the total gas flow rate at 10 liters min-1. When the oxygen demand required that more than 10 liters of pure oxygen. min-1 be added, the total gas flow (of pure oxygen) was increased according to the demand until it reached 20 liters min-'. The pH was controlled at 7.0 by using a Horizon Ecology Co. pH controller (model 5997) with a sterile 4 M NH40H solution. Control scheme. The control scheme consists of two parts: a feed-forward component which is a "coarse controller" that predicts the future GD and a feed-back component which corrects for minor errors in the predicted GD (finetuning of the controller). Both components are based on on-line glucose concentration measurements taken at 2-min intervals. Since a bacterial fed-batch culture is by definition a non-steady-state process, the rate of glucose consumption by the culture (GD) will be an exponentially increasing
0.07 -
E 0 -j
a
0.06
z
w a w
0.05
Cn
0 0 -J
0
0.04 _ 60
65
70
75
80
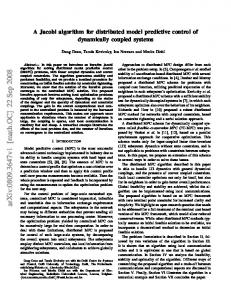
TIME (min) FIG. 1. Mechanics of the feed-forward predictive component of the control scheme. The dashed line is the theoretical GD of the system. A linear regression is performed using the last 5 (t_1 to t-5) calculated GD (0) as a function of time (h). The GD is glucose required by the system based on the consumption of glucose by the microorganism. The slope and intercept obtained from the linear regression are used to predict the GD at the next time point (t,l). The arrow indicates the present time (to).
variable. Thus, for optimum performance, a control scheme of this process will need a feed-forward time-related component. In our control strategy, this feed-forward component is based on predicting future GD by a linear regression (using a linear least-squares algorithm) of the past GD. This allows the controller to anticipate what the GD will be in the future (in this case, in 2 min) and not just respond to past changes. For a growing culture, these GD will increase exponentially with time so that a linear regression of GD versus time will produce an equation for a line with a positive slope. Thus, the predicted GD will be greater than the previously calculated values, as illustrated in Fig. 1. The GD at a particular time, to, is determined by a mass balance on glucose: GD = GF,, ,t + [(ERR, 1 - ERR,o)/At] where GD is the rate of glucose consumed (in grams per liter per minute); GF is the rate of glucose fed to the vessel (in grams per liter per minute); t1, and to indicate the previous time interval and the present time, respectively; ERR is the set point glucose concentration minus the actual glucose concentration (in grams per liter); and At is the time interval between sampling (in this case, 2 min). The future GD at the next sampling time (t) was determined by using the values obtained from the least-squares algorithm (Fig. 1). Since GD was calculated on a per-liter basis, GD was multiplied by a corrected volume (Vl, which was based on a summation of the liquid added to the system by the computer) to determine the demand of the fermentor. Although the feed-forward component of this controller approximates the predicted GD, the glucose concentration in the vessel will not remain at the set-point unless the rate of glucose addition exactly matches the GD. Therefore, a proportional feedback control element was added to finetune the controller. For this feedback component, the glucose feed rate to the vessel was determined as follows: GF1 = PGF1 + (Kc.. ERRo) where GF1 is the actual glucose fed to the vessel (in grams per liter per minute), PGF1 is the predicted glucose feed rate
912
APPL. ENVIRON. MICROBIOL.
KLEMAN ET AL.
(i.e., expected requirement for the next datum point; in grams per liter per minute), based on the linear regression, Kc is the proportional constant, and ERR represents the set point glucose concentration minus the actual glucose concentration. The combination of these two components yields a type of control which essentially is a feedback proportional control around a moving feed rate set point in which the set point is changed to the predicted value from the linear regression of the last five calculated GD datum points. Computer simulations to optimize adaptive control algorithm. To optimize this control scheme, i.e., to adjust the gain on the proportional constant (K,.) and to determine the number of datum points used for the linear regression (N), computer simulations were conducted with the control algorithm. The simulation is based on a basic exponential increase of the dry cell weight (DCW) calculated every 2 min. The theoretical GD is based on a constant yield of biomass from glucose. The glucose concentration is determined by comparing the theoretical GD with the amount of glucose fed over the last 2 min. The error that was normally observed with the glucose analyzer, i.e., random errors of up to ±0.02 g of glucose. liter-' were added to the simulated on-line glucose concentrations. With these assumptions in mind, we performed the simulations by using the control scheme outlined above. In addition, the actual delay experimentally observed between the sampling point and the time at which the calculation was made (ca. 2 min) was included in the simulation. Various values for specific growth rate (p. [per hour]) and cell yield (Yg; grams [DCW] per gram of glucose utilized) were considered during the preliminary stages of this optimization process. It was assumed, however, that these values were constant during a particular simulated fermentation. Culture analyses. Cell growth was monitored during the fermentations by measuring culture turbidity with a KlettSummerson colorimeter using a red filter. DCW was determined by removing 20-ml samples from the culture and pelleting the organisms by centrifugation at 10,000 x g for 10 min. The resulting pellets were washed twice with 20 ml of distilled water and repelleted each time as just described. The final pellets were resuspended in 10 ml of distilled water and poured into preweighed aluminum pans. These pans were then baked at 80°C for 24 h and weighed. All biomass measurements described in this study were the result of direct measurement of DCW (i.e., not derived from conversions from turbidity data). Off-line glucose concentrations were determined by using a YSI model 2000 glucose analyzer. Acetate concentrations of the culture broth were determined by high-pressure liquid chromatography as described by Luli and Strohl (15). RESULTS AND DISCUSSION Construction of predictive control algorithm governing gross glucose concentration. We have previously used a scheduled feed-forward coupled with a glucose feedback control system (14) to grow several E. coli strains to high cell densities in fed-batch fermentation cultures (15). This control algorithm, however, was unable to adjust rapidly enough to dynamic changes in rapidly growing cultures to maintain the desired control of glucose concentration. The predictive control algorithm described herein solves this problem. A computer simulation was run with the control algorithm to optimize the number of calculated GD datum points to be included in the linear regression (N,) and the value of the proportional constant (Kc). In this simulation, the following
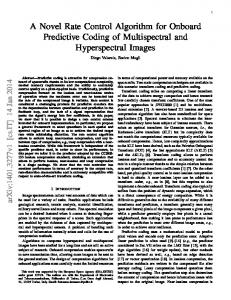
parameters were used: K., 0.2 to 2.0; Nr, 5 and 10; p., 0.67 to 0.976 h-i; and Y,, 0.5 g of DCW per g of glucose utilized. Figure 2 demonstrates the effect that the two variable factors, Kc and Nr, have on attempts to maintain a constant glucose concentration in simulated, fed-batch fermentations to 100 g of DCW liter-1 over a 10-h period. Figure 2A to C shows the effect of changing the proportional constant. Higher proportional constants prevent the drop in glucose concentration at higher cell mass concentrations, but in doing so, the amplitude of the fluctuations is increased. Figure 2D to F demonstrates the effect of a higher or lower p. and the increase in Nr (i.e., from 5 to 10). For a given value of K., an increase in the number of datum points used in the regression or, alternatively, an increase in p. results in an inability of the controller to keep up with GD. Using a larger Nr would average out the random error in the analyzer, but this would also increase the error of approximating an exponential curve with a straight line. This principle would especially be true for high p. or high cell concentrations, which would have high total-culture GD. Higher Kc values may be used to correct this error, but higher K{ values cause greater fluctuations around the set point. On the basis of simulation experiments and preliminary experimental observations (Table 1, fermentations B and C), the optimum Nr was determined to be 5, which corresponds to a window of 10 min. The best value for K, was found to be 0.5, with higher K. values working better for fast-growing cultures and cultures at high cell densities. Predictive control fed-batch fermentations. Using the optimized system (i.e., Kc, 0.5; Nr, 5; 150-s total lag time [i.e., time between a change in glucose concentration and computer response]), E. coli was grown at 32°C in fed-batch culture with the set point for soluble glucose at 0.5 g fiter-' (Fig. 3; Table 1, fermentation A). The initial growth rate was 0.76 h-1 (generation time, 55 min), and the final biomass achieved after 9 h was 65 g. liter-' (based on net DCW). During the first hour, the glucose was allowed to decline from an initial value of 0.8 g- liter-' to the set point, and between hours 1 and 8, the glucose was kept at 0.49 + 0.04 g fiter-1 (Table 1), with a standard error of ca. 0.0047. After hour 8, the culture became anaerobic, and the control scheme was unable to add glucose fast enough to satisfy the GD because this demand exceeded the capacity of the pumps used for feeding glucose; therefore, this was a limitation of the equipment used, not the control algorithm employed. Just prior to the point at which the culture became anaerobic, the dissolved oxygen increased briefly to 100% before declining to zero (Fig. 3); this appears to identify a point at which the organisms shifted from aerobic to anaerobic metabolism and then back to aerobic catabolism of glucose. The GD, the value on which the feed rate was based, increased from an initial value of 0.01 (grams of glucose utilized per liter per minute) to a final value of 0.8 during this fermentation. Two additional E. coli B predictive control fed-batch fermentations were run with a set point of 0.5 g of glucose liter-' (Table 1). The glucose control values for fermentations B and C, run prior to optimization of KC and Nr, had standard errors of 0.010 and 0.014, respectively, and were not as tightly controlled as fermentation A (Table 1). Nevertheless, final cell densities of over 40 g. liter-' were obtained, even though fermentation B was carried out at a temperature of 37°C and the culture had an initial p. of 0.9
h-1.
To demonstrate that glucose could be controlled at higher points, E. coli was initially grown at 28°C in fed-batch
set
VOL. 57, 1991
913
GLUCOSE-CONTROLLED FED-BATCH FERMENTATION 1.0 r
0.81
D
0.8
00.4'6{
0.6 -
~
~
~
-
Om...'
0.4
0.2
b.III .~~~~~
0.2
J
-
0
2
6
4
8
1( o
0.0
--1
0
0)
2
4
6
8
1t
2
4
6
8
11
2
4
6
8
10
c
0
a3) 4-j
0
1-B 0.8 -
4-J
co
c
C
(1) co al)
0 0) C)
C.)
0.4
C 0
0.2 -
L)
0.6 0.4 1.0 0.2
F
0.0 0
2
6
4
8
14
0
0
(D
0.8
.-_
0
0
1.0, _ .w
0.8 -
C
0.81
0.6 -
-._
o(
I° 8 -
_
sh
---
0.4-
0.2-
0.2 0.0
0. 0
2
6
4
8
10
0
Time (hours)
Time (hours)
FIG. 2. Computer simulation of glucose adaptive-controlled fed-batch fermentation. The following parameters were assumed for all simulations: control of glucose, at 0.5 g liter-1; growth yield, 0.5 g of cell per g of glucose utilized. (A) K, 2.0; ,u, 0.76 h-'; N,, 5. (B) K,, 0.5; 0.76 h-1; N,, 5. (C) K, 0.2; 0.76 h-; N,, 5. (D) K, 0.5; 0.976 h -; N,, 5. (E) K, 0.5; p., 0.76 h-1; Nr, 10. (F) Kc, 0.5; 0.67 p.,
p.,
p.,
p.,
h-1; N,, 5.
culture with a glucose set point of 5.0 g liter-' (Table 1, fermentation D). In this culture, the specific growth rate was 0.67 h-' (62-min generation time) and the final biomass obtained was 58 g liter-'. This fermentation also demonstrated that high cell densities could be obtained by using a lower temperature, and therefore a slower growth rate, while maintaining optimal control of the glucose concentration (compare fermentations D and E, Table 1). Between hours 1 and 9, the glucose concentration averaged 5.10 + 0.18 g. liter-'. The GD of the culture increased from an initial value of 0.01 g of glucose utilized liter-' min-' to a final value of 1.0 during this fermentation. The final fermentation (Table 1, fermentation E) was a
repeat of fermentation D, except that the temperature was controlled at 32 instead of 28°C to show the effect of temperature (and therefore ,u) on the ability to obtain high cell densities in the glucose-controlled fermentation system. When E. coli was grown in fed-batch culture at 32°C with a set point of 5.0 g of glucose liter-' (Table 1, fermentation E), the initial growth rate was 0.78 h-1 (53-min generation
time) and the final biomass achieved was 45 g. liter-'. From hour 1 to 8 of the 10-h fermentation, the glucose concentration was maintained at an average of 5.07 + 0.21 g- liter-' (standard error, 0.025). The optimized fermentation controlled at 0.5 g of glucose liter-' was more tightly controlled (based on the
TABLE 1. Glucose adaptive and feedback-controlled fed-batch fermentations of E. coli B Data for fermentation run:
Parameter
Glucose set point (g. liter-) Actual glucose concn (g. liter-l)b Temp (°C) Initial p. (h-1) Final biomass (g liter-') Fermentation time (h) Avg SGCRC Acetate produced (g- liter-s)e
A
Ba
Ca
D
E
0.5 0.49 + 0.04 32 0.76 65 9 1.6 1.73
0.5 0.44 + 0.09 37 0.90 42 7 2.3 3.12
0.5 0.46 + 0.12 32 0.69 48 9 NDd 2.49
5.0 5.10 + 0.18 28 0.67 58 12 1.9 2.85
5.0 5.07 + 0.21 32 0.78 45 10
" Fermentations were carried out before final optimization of the controller, i.e., K, value and N, used for each regression analysis. b Mean ± standard deviation (total of 70 datum points). Data are from hour 1 through hour 8 in all fermentations (prior to onset of anaerobiois). 'See Fig. 4 for details of SGCR as a function of culture density. " ND, Not done. e Duplicate samples taken just prior to onset of anaerobiosis.
1.4 1.94
914
APPL. ENVIRON. MICROBIOL.
KLEMAN ET AL.
20 3 3
8g 100
0
:n 75
CD
tn
x
02)
c)
._
O 50
15 0O
a) >
Z
CA, CD
=
25
01)
0 0
100
B
0
0 0
0
0
m -
cn c
CD cn c
0
10
0
ca
.2' c E1 a)
0
0~~~~~ --.
co
I
0
E 0 CD
0 0 0)
0
OP
10 CD3
C,)
n
0
0
a u
5 =
.o
0 0
- O 0.1
50 0.01 1.0 I 0.8
O
Dry Cell Weight (g/L)
C
FIG. 4. SGCR as a function of culture density in fermentation A.
0.6 O 0.4 ' 0.2 4 5 7 8 6 9 10 Time (hours) FIG. 3. Glucose-controlled fed-batch fermentations of E. coli B grown at 32°C with a controlled constant soluble-glucose concentration of 0.5 g. liter-' (Table 1, fermentation A). (A) Dissolved oxygen versus time of fermentation. (B) DCW of E. coli B (0) and predicted GD (0) versus time of fermentation. (C) Concentration of soluble glucose versus time of fermentation.
1
2
3
standard deviation) than both of the optimized fermentations carried out at 5 g of glucose liter-', which is probably because of the difference between the calibration standards for the glucose analyzer (i.e., a standard of 2.0 g of glucose liter-' was used for the 0.5-g liter-1 controlled runs, whereas a 7.0-g liter-1 standard had to be used for the 5.0-g. liter-1 controlled runs). The lower the calibration standard used, the greater the precision of the glucose concentration observed, since the gain of the analyzer could be increased when the lower-concentration glucose standard was used. SGCR. The specific glucose consumption rate (SGCR; grams of glucose consumed per gram of DCW per hour) was calculated from the GD and DCW for all of the fermentations. The average SGCR for the fermentations ranged from 1.4 to 2.26 g/g h (equaling 7.8 to 12.6 mmol of glucose per g of DCW. h) (Table 1). In all cases, the SGCR peaked very early in the fermentation and then dropped as the fermentation progressed, as shown for fermentation A in Fig. 4. Interestingly, during the period in which the SGCR dropped from its maximal point to about half of that value, the ,. of the cultures was constant, suggesting that casein hydrolysate provided the remainder of the energy to the organism at that time. In fermentations A, D, and E (Table 1), the final SGCR was ca. 0.9 to 1.0 g/g. h (ca. 5 mmol/g h), whereas for fermentation B, the final SGCR was about twice as high (ca. 2 g/g. h [ca. 10 mmol/g- h]). The range of SGCR values obtained in these predictive glucose control high-cell-density
fermentations is similar to values obtained by other researchers (39), who found that chemostat cultures of E. coli had SGCR values of 1.25 to 9.12 mmol of glucose consumed per g of DCW. h, with the upper values being obtained at the fastest dilution rates (0.7 h-1). Advantages and limitations of predictive control scheme and comparison with other algorithms. In theory, the control of feed rate based on substrate concentration is the optimal method for controlling fed-batch fermentations (41). Few fed-batch fermentations, however, that actually operate in this manner have been reported, typically because of the strict requirement for sterilizable, accurate, and fast-response substrate analysis systems that can be linked on-line with the fermentor (29). Only a few fed-batch fermentations have been controlled directly using on-line, direct measurement of a substrate to control the addition of that substrate. For examples, Yamane et al. (40) used a porous Teflon tube device to measure and control the addition of ethanol in a fed-batch fermentation of yeast cells, Ghoul et al. (8) used a glucose analyzer connected to a recirculating loop to control the concentration of glucose in fed-batch fermentations of yeast cells, and Luli et al. (14) used a glucose analyzer connected to a tangential-flow membrane filtration system to control the glucose concentration in a fed-batch fermentation of E. coli. In the few systems which have been developed for direct feedback control of substrate to a fed-batch fermentation, the control schemes typically have consisted of proportional-plus-differential (40) or proportional-plus-integral-plus-derivative (PID) action (4, 8). A major limitation to these methods, however, is that they respond to current changes in the system but lack the predictive capability that our system has. Kishimoto et al. (10) have developed an algorithm which is a combination of dynamic programming and linear prediction based on multiple linear regression of data taken from previous fed-batch cultures. Because this algorithm was based not on deterministic equations but on regressions of data from several experiments, it is more flexible and able to respond to variations during a fermentation. Nevertheless, the algorithm of Kishimoto et al. (10) is
VOL. 57, 1991
GLUCOSE-CONTROLLED FED-BATCH FERMENTATION
still based on a scheduled feed, which, as described previously, is unable to respond to situations that differ from the historical data. The major advantage to the predictive-plus-feedback control scheme used in these fed-batch fermentations is that the investigator does not need to know the metabolic constants for a given organism prior to growth of that organism in this system. Therefore, this system can be used without further instrumentation such as offgas CO2 measurements to calculate mass balance (e.g., the approach used by Mou and Cooney [24]) or alterations of the algorithm or hardware to control glucose-fed fermentations of any organism. Although we used glucose-controlled fermentations in this study, this same algorithm could be applied to any substrate that could be measured on-line (e.g., ethanol, glycerol, NH3, or lactate). A second advantage to our predictive control algorithm is that it is essentially self-correcting; i.e., it is able to adjust to changes in the growth rate and substrate demand of the organism. This self-adjustment is also important for potential mechanical malfunctions in the system. For example, if a pump calibration changes during the fermentation (e.g., if a pump setting of X delivers glucose at a rate of 0.5 X or if tubing stretches and alters the calibration curve), the system corrects itself so that glucose is still maintained at the set point. Finally, the analyzer, as described previously (14), constantly calibrates itself, adding internal reliability to the system.
A regression analysis of past GD was used to predict the future controller action instead of a true proportional-plusdifferential or PID controller for several reasons. (i) It is unnecessary to determine several controller constants based on unknown, poorly understood, or changing cellular constants (e.g., Yg, ,u, or SGCR). (ii) The controller is general and simple to implement, even with no knowledge of these various cellular constants. (iii) The PID controller responds only to changes in concentration relative to the set point and dampens fluctuation in the response. The predictive controller, on the other hand, predicts the glucose requirement of the growing cells rather than having to keep up with changes after they occur, as happens with a PID controller. Moreover, this system has advantages over open-loop feeding strategies based on simulated data because this system is based on real data and therefore has the ability to adapt to changes in yields, growth rates, GD, and other factors. (iv) This system can be used with any organisms that consume glucose as the carbon and energy source. Similarly, if a lactate, ethanol, or sucrose probe or other similar measurement system were used, this controller could be used to control growth by using those parameters. A linear regression rather than an exponential fit was used for several reasons: (i) the cells do not always grow in an exponential mode during the fermentation; (ii) the lag phase of growth can vary, which would offset an exponential fit; (iii) significant deviations from exponential cell growth could not be accounted for; (iv) it allows for the decrease of the substrate demand, which occurs at the end of the fermentation; and (v) it was simple to implement. A major limitation to this algorithm is due to the computer system used: the Apple IIe does not have enough random access memory to incorporate desired additional features such as cubic spline fitting of the regression and more in-depth calculations of the status of the fermentation. Use of the more-powerful microcomputers available today, such as an IBM PS/2 computer, would alleviate these problems. Our use of E. coli B as the model organism shows that
915
scenario (i.e., a very fast growing organism with high GD), the controller works as desired. Although other systems have been used to control a substrate around a set point concentration (3, 8, 12, 14, 18, 22, 38), our system has the tightest documented control yet reported, even at high substrate demands. Moreover, we were able to control glucose with this accuracy at a concentration of 0.49 g liter-1 (2.72 mM) for a fed-batch fermentation and 0.27 g liter-' (1.5 mM) for a continuous culture (11), which are much lower levels than in any other glucosecontrolled fermentations. The slower the growth and demands of an organism, the easier it is to control the substrate at a set point. Thus, no alterations to the system are required for growth of other glucose-consuming industrially important organisms such as, for examples, Bacillus spp., Lactobacillus spp., Pseudomonas spp., Streptomyces spp., yeasts, and filamentous fungi. The major limitation to this system was the use of linear regression to predict GD at the very high GD values obtained late in the fermentations. Under these conditions, the linear regression significantly underpredicts the GD (Fig. 1). This circumstance, however, was observed only in aerobic-toanaerobic (and vice versa) switches at the end of the high-cell-density fermentations and in simulations in which the DCW was greater than ca. 70 g liter-'. The tight control of glucose concentration around the set point was lost when the E. coli cultures reached densities approaching 60 g of DCW liter-1. At that point, the cultures became anaerobic.
even in a worst-case
In our current system, once the culture switches from aerobic to anaerobic growth, the controller causes a fluctuation of glucose concentration, which was mainly observed at the higher glucose level (5 g liter-'). One way to correct this error would be to alter N, from 5 to 3 datum points. This alteration in the control scheme would allow the controller to respond faster to changes, but accuracy would be lost because of the use of fewer points. Since our fermentors have a maximal agitation speed of only 600 rpm, we have been unable to achieve the higher E. coli densities reported by other groups (1, 7, 23, 26, 30) because of the lack of oxygen transfer to the cultures, even under aeration with 20 liters of pure oxygen min-1. Recently, Eppstein et al. (7) reported that the use of a highoxygen-transfer fermentation system allowed growth of E. coli to reach greater than 90 g of DCW liter-' consistently. Coupling of the predictive glucose control system described here to a high-oxygen-transfer fermentation system such as that described by Eppstein et al. (7) should result in maximum productivity of E. coli. A second possible limitation, which has been discussed elsewhere (14), is that our system depends on the presence of an external loop for analysis of the glucose. The delay time between the occurrence of an actual glucose concentration and the actuation of the medium pumps when dilute solutions were used was 150 (lOa). This short delay period is required for optimal control of organisms growing as fast as E. coli (e.g., ,u of 0.9 h-1). At high cell densities, however, the delay was increased by a slower rate of flow through the tangential filter, thus creating additional, albeit minor, errors in the system. This led to an increase in the standard error in the last hour or so of each fermentation. To improve this aspect of the system, we are attempting to decrease the delay time between the sampling period and the point at which the pumps are actuated. Further improvements that could be made to this system might include the use of a polynomial fit for calculation of the predicted GD. This would prevent the errors currently
916
KLEMAN ET AL.
obtained from linear approximation of exponential increases in GD. This improvement, however, will require greater computing power than we currently have with the Apple Ile system. A second improvement will be to increase the value of the proportional gain constant as the GD increases. Either a scheduled gain increase or a simple input command for the increase could be used. Production of acetate by E. coli in glucose-controlled fermentations. It is well established that E. coli cultures growing aerobically in the presence of excess glucose produce acidic by-products, particularly acetate (9, 13, 15, 16, 25, 26, 32). This glucose-mediated aerobic acidogenesis is known as the bacterial Crabtree effect (5, 15, 27). The formation of acetate may be caused by an imbalance between glucose metabolism and respiration (5). This is a condition in which the influx of carbon into the cell exceeding demands for biosynthesis, the presence of excess NADH, the repression of tricarboxylic acid cycle enzymes, and uncoupled metabolism are all likely to be involved (15). In the fed-batch fermentations reported here, the concentration of acetate produced by E. coli B reached approximately 1.5 to 3.1 g liter-'just prior to anaerobiosis, regardless of the glucose control set point (i.e., 0.5 or 5.0 g. liter-'). This is roughly the same concentration of acetate produced by E. coli B in batch cultures and in less tightly controlled fed-batch cultures (15). When the controlling glucose concentration was at 0.5 g liter-', however, fermentation A, which was the most tightly controlled run, yielded 30 to 40% less acetate than the other two runs with glucose at 0.5 g liter-1, which were more loosely controlled. This suggests that oscillations in glucose concentration may promote acetate production. Nevertheless, at these low acetate concentrations (ca. 2 g- liter-1), the concentration of the protonated form (CH3COOH; pH 7.0; derived by the Henderson-Hasselbalch equation), which can cause uncoupling (33), would be ca. 10 mg. liter-', a concentration which was probably too low to inhibit the growth of E. coli to an observable degree (15). In the fed-batch experiments carried out here, the concentration of acetate produced did not appear to be detrimental to cell growth, since 65 g of E. coli B liter-1 was obtained (and eventually limited by oxygen transfer in our system). The ability of microorganisms to uncouple catabolism from anabolism is very important to those interested in process control. It is becoming apparent that the physiological state of the host cell greatly affects the expression of rDNA products and, thereby, the productivity of the fermentation process (2, 9, 16, 19, 27). There is apparently a link between the accumulation of acetate caused by the bacterial Crabtree effect and several important factors in rDNA fermentations, such as final cell concentration, cell yield, genetic stability, and product stability (43). Both rapid growth (5, 20) and high glucose levels (5) apparently contribute to the bacterial Crabtree effect. Using turbidostats, Doelle et al. (6) found that switchover from normal coupled respiration to the bacterial Crabtree effect occurred at 1.5 to 2.0 g of glucose liter-'. Our previous data and the data shown here suggest that control of fed-batch cultures at 0.5 g. liter-' is still above the cutoff point for the Crabtree effect. Nevertheless, when strains that do not accumulate large amounts of acetate, such as E. coli B, are used (15), only minimal effects on the cultures are observed, even at high cell densities. E. coli B, however, is not used as a host for the expression of rDNA products, so that ability to control glucose at low, consistent levels coupled with lowering of growth rates and perhaps other, strain-specific factors may assist in limiting the amount of acidic by-
APPL. ENVIRON. MICROBIOL.
products produced by various recombinant strains. It will be important to determine if the control scheme employed in this work will have an effect on the ability of recombinant E. coli strains to produce their rDNA products at high cell densities. This may be particularly important when other strains of E. coli that may accumulate considerably more acetate than strain B are used as recombinant hosts (15). ACKNOWLEDGMENTS
This work was partially supported by YSI, Inc., Yellow Springs, Ohio. We thank Don Ordaz in the Ohio State University Fermentation Facility for his technical assistance during these investigations. REFERENCES 1. Allen, B., and G. W. Luli. 1987. A gradient-feed process for E. coli fermentations. Biopharm. Manuf. 1:38-41. 2. Brown, S. W., H.-P. Meyer, and A. Fiechter. 1985. Continuous production of human leukocyte interferon with Escherichia coli and continuous cell lysis in a two stage chemostat. Appl. Microbiol. Biotechnol. 23:5-9. 3. Cleland, N., and S. Enfors. 1983. Control of glucose-fed batch cultivations of E. coli by means of an oxygen stabilized enzyme electrode. Eur. J. Appl. Microbiol. Biotechnol. 18:141-147. 4. Dairaku, K., Y. Yamasaki, K. Kuki, S. Shioya, and T. Takamatsu. 1981. Maximum production in a bakers' yeast fed-batch culture by a tubing method. Biotechnol. Bioeng. 23:2069-2081. 5. Doelle, H. W., K. N. Ewings, and N. W. Hollywood. 1982. Regulation of glucose metabolism in bacterial systems. Adv. Biochem. Eng. 23:1-35. 6. Doelle, H. W., N. W. Hollywood, and A. W. Westwood. 1974. Effect of glucose concentration on a number of enzymes involved in the aerobic and anaerobic utilization of glucose in turbidostat-cultures of Escherichia coli. Microbios 9:221-232. 7. Eppstein, L., J. Shevitz, X.-M. Yang, and S. Weiss. 1989. Increased biomass production in a benchtop fermentor. Bio/ Technology 7:1178-1181. 8. Ghoul, M., E. Ronat, and J. Engasser. 1986. An automatic and sterilizable sampler for laboratory fermentors: application to the on-line control of glucose concentration. Biotechnol. Bioeng. 28:119-121. 9. Jensen, E. B., and S. Carlsen. 1990. Production of recombinant human growth hormone in Escherichia coli: expression of different precursors and physiological effects of glucose, acetate, and salts. Biotechnol. Bioeng. 36:1-11. 10. Kishimoto, M., T. Yoshida, and H. Taguchi. 1980. Optimization of fed-batch culture by dynamic programming and regression analysis. Biotechnol. Lett. 2:403-408. 10a.Kleman, G. L. Unpublished data. 11. Kleman, G. L., J. J. Chalmers, G. W. Luli, and W. R. Strohl. 1991. Glucose-stat: a glucose-controlled continuous culture. Appl. Environ. Microbiol. 57:918-923. 12. Kole, M. M., D. Ward, and D. F. Gerson. 1986. Simultaneous control of ammonium and glucose concentrations in Escherichia coli fermentations. J. Ferment. Technol. 64:233-238. 13. Lee, Y. L., and H. N. Chang. 1990. High cell density culture of a recombinant Escherichia coli producing penicillin acylase in a membrane cell recycle fermentor. Biotechnol. Bioeng. 36:330337. 14. Luli, G. W., S. M. Schlasner, D. Ordaz, M. Mason, and W. R. Strohl. 1987. An automatic, on-line glucose analyzer for feedback control of fed-batch growth of Escherichia coli. Biotechnol. Tech. 1:225-230. 15. Luli, G. W., and W. R. Strohl. 1990. Comparison of growth, acetate production, and acetate inhibition of Escherichia coli strains in batch and fed-batch fermentations. AppI. Environ. Microbiol. 56:1004-1011. 16. MacDonald, H. L., and J. 0. Neway. 1990. Effects of medium quality on the expression of human interleukin-2 at high cell density in fermentor cultures of Escherichia coli K-12. Appl. Environ. Microbiol. 56:640-645.
VOL. 57, 1991
GLUCOSE-CONTROLLED FED-BATCH FERMENTATION
17. McLaughlin, J. K., C. L. Meyer, and E. T. Papoutsakis. 1985. Gas chromatography and gateway sensors for on-line state estimation of complex fermentations (butanol-acetone fermentations). Biotechnol. Bioeng. 27:1246-1257. 18. Meschke, J., H. Bennemann, H. Herbst, S. Dormeier, and D. C. Hempel. 1988. On-line HPLC-measurement and control of substrate in a continuously operated biological tank reactor. Bioprocess Eng. 3:151-157. 19. Meyer, H.-P., H.-J. Kuhn, S. W. Brown, and A. Fiechter. 1984. Production of human leukocyte interferon by Escherichia coli, p. 499-505. In Proceedings of the Third European Congress on Biotechnology, vol. 1. Verlag Chemie GmbH, Weinheim, Federal Republic of Germany. 20. Meyer, H.-P., C. Leist, and A. Fiechter. 1984. Acetate formation in continuous culture of Escherichia coli K12 Dl on defined and complex media. J. Biotechnol. 1:355-358. 21. Minihane, B. J., and D. E. Brown. 1986. Fed-batch culture technology. Biotechnol. Adv. 4:207-218. 22. Mori, H., T. Yamane, T. Kobayashi, and S. Shimizu. 1983. New control strategies for continuous cultures based upon a microcomputer-aided nutristat. J. Ferment. Technol. 61:305-314. 23. Mori, H., T. Yano, T. Kobayashi, and S. Shimizu. 1979. High density cultivation of biomass in fed-batch system with DO-stat. J. Chem. Eng. 12:313-319. 24. Mou, D.-G., and C. L. Cooney. 1983. Growth monitoring and control through computer-aided on-line mass balancing in a fed-batch penicillin fermentation. Biotechnol. Bioeng. 25:225255. 25. Paalme, T., K. Tiisma, A. Kahru, K. Vanatalu, and R. Vilu. 1990. Glucose-limited fed-batch cultivation of Escherichia coli with computer-controlled fixed growth rate. Biotechnol. Bioeng. 35:312-319. 26. Pan, J. G., J. S. Rhee, and J. M. Lebeault. 1987. Physiological constraints in increasing biomass concentration of Escherichia coli B in fed-batch culture. Biotechnol. Lett. 9:89-94. 27. Rinas, U., H.-A. Kracke-Helm, and K. Schugerl. 1989. Glucose as a substrate in recombinant strain fermentation technology. By-product formation, degradation and intracellular accumulation of recombinant protein. Appl. Microbiol. Biotechnol. 31: 163-167. 28. Robbins, J. W., Jr., and K. B. Taylor. 1989. Optimization of Escherichia coli growth by controlled addition of glucose. Biotechnol. Bioeng. 34:1289-1294. 29. Schugerl, K., T. Lorenz, A. Lubbert, J. Niehoff, T. Scheper, and W. Schmidt. 1986. Pros and cons: on-line versus off-line analysis of fermentations. Trends Biotechnol. 4:11-15. 30. Shay, L. K., H. R. Hunt, and G. H. Wegner. 1987. Highproductivity fermentation process for cultivating industrial microorganisms. J. Ind. Microbiol. 2:79-85. 31. Shiloach, J., and S. Bauer. 1975. High-yield growth of E. coli at
32.
33.
34. 35.
36.
37. 38.
39.
40.
41.
42. 43.
917
different temperatures in a bench scale fermentor. Biotechnol. Bioeng. 17:227-239. Smirnova, G. V., and 0. N. Oktyabr'skii. 1985. Influence of acetate on the growth of Escherichia coli under aerobic and anaerobic conditions. Mikrobiologiya 54:252-256. (Translated in Microbiology [USSR] 54:205-209.) Smirnova, G. V., and 0. N. Oktyabr'skii. 1988. Effect of activity of primary proton pumps on growth of Escherichia coli in the presence of acetate. Mikrobiologiya 57:554-559. (Translated in Microbiology [USSR] 57:446-451.) Strohl, W. R., P. L. Lorensen, and S. M. Schlasner. 1986. Microcomputer-control of fermentation processes. Biotechniques 4:336-343. Suzuki, T., T. Yamane, and S. Shimizu. 1986. Control of carbon source supply and dissolved oxygen by use of carbon dioxide concentration of exhaust gas in fed-batch culture. J. Ferment. Technol. 64:317-326. Suzuki, T., T. Yamane, and S. Shimizu. 1987. Mass production of thiostrepton by fed-batch culture of Streptomyces laurentii with pH-stat modal feeding of multi-substrate. Appl. Microbiol. Biotechnol. 25:526-531. Suzuki, T., T. Yamane, and S. Shimizu. 1988. Effect and control of glucose feeding on bacitracin production by fed-batch culture of Bacillus licheniformis. J. Ferment. Technol. 66:85-91. Suzuki, T., T. Yasuda, T. Yamane, and S. Shimizu. 1986. Detection and automatic control of ammonium ion concentration in microbial culture with an ammonium ion selective electrode. J. Ferment. Technol. 64:63-70. Tempest, D. W., and 0. M. Neijssel. 1987. Growth and energy distribution, p. 797-806. In F. C. Neidhardt, J. L. Ingraham, K. B. Low, B. Magasanik, M. Schaechter, and H. E. Umbarger (ed.), Escherichia coli and Salmonella typhimurium: cellular and molecular biology, vol. 1. American Society for Microbiology, Washington, D.C. Yamane, T., M. Matsuda, and E. Sada. 1981. Application of porous Teflon tubing method to automatic fed-batch culture of microorganisms. II. Automatic constant-value control of fed substrate (ethanol) concentration in semibatch culture of yeast. Biotechnol. Bioeng. 23:2509-2524. Yamane, T., and S. Shimizu. 1984. Fed-batch techniques in microbial processes, p. 147-194. In A. Fiechter (ed.), Advances in biochemical engineering/biotechnology. Springer-Verlag, Berlin. Yano, T., T. Kobayashi, and S. Shimizu. 1981. Control system of dissolved oxygen concentration employing a microcomputer. J. Ferment. Technol. 59:295-301. Zabriskie, D. W., and E. J. Arcuri. 1986. Factors influencing productivity of fermentations employing recombinant microorganisms. Enzyme Microb. Technol. 9:706-717.