Journal of Electrical Engineering & Technology Vol. 5, No. 3, pp. 407~414, 2010 407
A Probabilistic Approach to the Protection Capability Evaluation of Distance Relay in Transmission Systems Wen-Hao Zhang†, Seung-Jae Lee* and Myeon-Song Choi* Abstract – This paper proposes a probability measure for the evaluation of relay performance from two aspects, namely, correct trip and no-unwanted trip. They are developed based on the relationship between relay settings and relay measurements, which follow a Gaussian probability model. The proposed method based on strict mathematical derivation is applied to protection capability evaluation of distance relays under various settings. Considering the specific attributes of each protection zone, the optimal settings are also determined accordingly. The protection capability could demonstrate clearly the relay performance under various settings and the optimal settings could provide good references for engineering applications. Keywords: Distance Relay, Protection Capability Evaluation, Optimal Settings
1. Introduction The process of determining the settings of protection relays is performed based on setting guidelines and/or engineers’ empirical knowledge. Although this process has a heuristic nature, it works pretty well in most cases since it has been accumulated through experience in the field. Protection engineers hope to secure the best protection performance which, however, can hardly be justified. There were some works on the performance evaluation of protection relaying. Three facets of protection, namely, security, dependability and availability, define performance indicators [1], [2]. A reliability index, based on statistical data of relay operations, has been proposed in [3] and [4], while the parameter sensitivity of the protective relaying algorithms has been studied, based on experimental data in [5]. Due to a lack of relay information, however, the proposed reliability index has been evaluated in a combined manner, which cannot be used to pinpoint the causes of malfunctions. Level ranking using fuzzy methods has been proposed in [6] and [7], in which the authors also agreed on the arbitrary selection of parameters. In [7] and [8], “protectability” has been defined to indicate the performance level of a protection system. It evaluated a protection system, given a certain set of settings from many aspects, such as speed, sensitivity, and backup capability. This study proposes a new analytical method to evaluate the performance of protection distance relays. Specifically, a probabilistic model of relay measurements is hereby proposed. The protection capability of distance, under a given setting, can be evaluated using this probabilistic method from two aspects, namely, correct trip probability and no†
Corresponding Author: Dept. of Electrical Engineering, Myongji University, Korea. (
[email protected]) * Dept. of Electrical Engineering, Myongji University, Korea. (
[email protected],
[email protected]) Received: April 8, 2010; Accepted: June 8, 2010
unwanted trip probability. In addition, the optimal settings of three-stepped-zone distance relay can be determined, considering their specific requirements on the correct trip probability and no-unwanted trip probability. Compared with the indexes based on statistical data or fuzzy estimation, the protection capability index proposed in this paper is based on a strict mathematical and theoretical derivation. It shows clearly the relay performance changes, with respect to relay setting and helps to obtain the optimal settings that have never been achieved in previous studies.
2. Probabilistic Modeling Errors involved in the impedance seen by a relay include CT and VT errors, inaccuracy of line impedances, A/D conversion error, calculation error of relays, etc. A uniform distribution probabilistic model for such relay errors is presented in [9] and [10], both of which show that a combination of such errors also yields an approximate Gaussian function. For a fault happening at l, the apparent distance lR seen by relay is represented by the following probabilistic model: f (lR ) =
⎡ (l − l ) 2 ⎤ 1 exp ⎢ − R 2 ⎥ . 2σ ⎦ 2πσ ⎣
(1)
This distribution function has a mean of actual fault location l and a standard deviation σ that can be determined from MATLAB simulation of relay errors. The following generic equation for impedance calculation, seen by a distance relay for a single line to ground fault given by (2), is used to find the distribution of the apparent distance and its deviation:
A Probabilistic Approach to the Protection Capability Evaluation of Distance Relay in Transmission Systems
408
lR =
Vm ×(1 ± ε ) . [ I m + I 0m ( Z 0 m − Z1m ) Z1m ] Z1m
(2)
Here, Vm, Im and I0m are measurements containing errors; Z0m and Z1m are the line impedances assumed; and ε is the calculation error. Each parameter in (2) is represented by its actual value plus a measurement error. Considering 5% CT error, 5% VT error, 3% impedance error and 5% calculation error, we generated uniformly distributed random data for the parameters in (2). Take the line impedance Z1m with 3% error as an example. Assume that the actual line impedance is “1” and generate 105 random data, following a uniform distribution in [0.97, 1.03] by an equation in MATLAB, as follows: Z1m = 0.97 + (1.03 − 0.97) rand (1e6,1)
expected to trip correctly for a fault if its setting LS is larger than the relay-measured fault location lR. The probability of its correct trip for a fault at l can be given as: P (lR | lR < LS ) = ∫
−∞
f (lR )dlR .
(5)
A fault location l on line l1 itself has random characteristics that can be considered as having a uniform probability density and can be represented by a function of P (l ) = 1/ L1 . The correct trip probability of relay R1 can then be derived by multiplying it to the probability in (5) and integrating it over the whole line range as: Pct ( LS ) = ∫
L1
0
(3)
Substituting all uniformly distributed parameters shown in (3) into (2), and calculating the probability density of random data, lR, would yield an approximate Gaussian distribution with 5% standard deviation, σ, which is used in this paper.
LS
1 ⎡ LS f (lR )dlR ⎤ dl . ⎥⎦ L1 ⎢⎣ ∫−∞
(6)
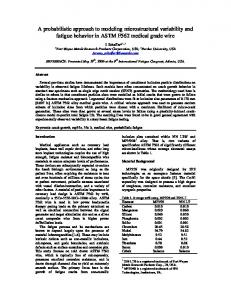
As the apparent setting LS increases, Pct also increases gradually to “1” under the setting 1.14 (Fig. 2), indicating that all the faults on l1 can be correctly tripped. Here, L1 equals “1” and σ equals 5% of the line length. P
1.2
ct
1
3. Probabilistic Evaluation of Protection Ability P
0.6 0.4 0.2 0
0
0.5
1 1.14 Setting
1.5
2
Fig. 2. Correct trip probability.
3.1 Evaluation of the Correct Trip Probability Suppose that relay R1 in Fig. 1 is responsible for the protection of line l1 and does not need a trip for a fault outside l1, then the probability characteristic of its relay measured fault distance lR is represented by a Gaussian density function as: ⎡ (l − l ) 2 ⎤ 1 f (lR ) = exp ⎢ − R 2 ⎥ . 2σ ⎦ 2πσ ⎣
ct
0.8
In order to evaluate the protection capability of a relay, two aspects from the viewpoint of a relay operation are considered in this study, namely, a correct trip for a fault within its protection zone and a no-unwanted trip for a fault outside its protection zone. A probabilistic evaluation of the two factors, i.e., “correct trip” and “no-unwanted trip,” are described below.
(4)
Relay R1 is assumed to have a setting of LS. Relay R1 is
Fig. 1. Correct trip probability (Pct) for a fault in l1.
3.2 Evaluation of the No-Unwanted Trip Probability Relay R1 will not trip if its LS setting is smaller than the relay-measured fault location lR. The probability of nounwanted trip for a fault at l is given as: P (lR | lR > LS ) = ∫
+∞
LS
f (lR )dlR .
(7)
Considering the uniform density function for a fault location that can be represented as P (l ) = 1/ L2 , the probability of no-unwanted trip for any fault in L2 is given as:
Fig. 3. No-unwanted trip probability (Pnt) for fault in l2.
Wen-Hao Zhang, Seung-Jae Lee and Myeon-Song Choi
Pnt ( LS ) = ∫
L1+ L 2
L1
1 ⎡ +∞ f (lR )dlR ⎤ dl . ⎥⎦ L2 ⎢⎣ ∫LS
(8)
As the apparent setting LS increases, Pnt starts to gradually decrease to 0, as shown in Fig. 4, which means that the probability of mis-tripping the fault in the next line gradually increases. P
1.2
4.1 Protection Capability of Zone-1 Zone-1 of a distance relay has two objectives, namely, protect its own line and not overreach beyond the line. The first can be evaluated by the correct trip probability, while the second can be evaluated by the no-unwanted probability. 4.1.1 Correct Trip of Zone-1 According to (6), the correct trip probability, Pct, is given as:
nt
1 0.8
Pct ( L11S ) = ∫
nt
P
409
0.6
L1
0
1 ⎡ L11S f (lR1 )dlR1 ⎤ dl . ⎦⎥ L1 ⎣⎢ ∫−∞
(9)
0.4 0.2 0
0
0.5
0.86 1 Setting
1.5
2
Fig. 4. No-unwanted trip probability.
4.1.2 No-Unwanted Trip of Zone-1 According to (8), the no-unwanted trip probability, Pnt, is given as: Pnt ( L11S ) = ∫
L1+ L 2
L1
1 ⎡ +∞ f (lR1 )dlR1 ⎤ dl . ⎦⎥ L2 ⎣⎢ ∫L11 S
(10)
A numerical evaluation of two indices is depicted in Fig. 7, in which a solid line represents the correct trip probability, which keeps increasing and reaches “1” if the apparent setting goes beyond the value of 1.14. With a long enough setting, Zone-1 is expected to trip for all the faults in L1 with 100% probability. Meanwhile, with an increase in setting, Zone-1’s no-unwanted trip probability would remain at “1” until it reaches a setting value of 0.86; this then decreases to 0, as shown by the dotted line in Fig. 7. Zone1 does not trip for the fault in its next line when the setting is small, but if it becomes bigger than a certain value, then an unwanted trip occurs with a high probability. P
1.2
P
nt
1
ct
A three-step distance protection is one of the most popular schemes in transmission line protection; in this scheme, each zone of distance relay has a protection reach set by a certain setting rule. The typical setting rules, which might vary from one utility to another, are described below. Zone-1 was set at 80% to 90% of the line impedance, with no intentional time delay in order to provide a fast main protection. Zone-2 was set at 50% into its next adjacent line, with a time delay in order to complete the main protection of its protecting line and provide a partial backup protection for its adjacent lines. Zone-3 was set at 25 % into the adjacent line in order to provide a full backup protection for all the adjacent lines [11]. As the setting of each zone becomes bigger, a faster protection is provided for a larger part of the line; at the same time, this increases the probability of tripping for the fault, which is not supposed to be covered. Although the setting to secure the correct trip and correct no-unwanted trip is required, it is difficult to know whether or not the setting satisfies the conditions due to the heuristic nature of the setting rules currently being used. With two probability measures introduced in this study (Pct and Pnt), it is possible to analytically determine the optimal settings. These are explained in this section, using a system that has three lines of the same length (Fig. 5).
Fig. 6. Correct trip probability for fault in l1.
P &P
4. Application to Distance Relay
ct nt
0.8 0.6 0.4 0.2 Optimal Setting 0
Fig. 5. Three-step distance protection.
0
0.5
0.86 1 Zone 1 Setting
1.5
Fig. 7. Protection capability of Zone-1.
2
410
A Probabilistic Approach to the Protection Capability Evaluation of Distance Relay in Transmission Systems
4.1.3 Optimal Zone-1 Setting
zone 3
Zone-1 does not need to trip for a fault outside of its protection zone. As such, the optimal setting is determined at the value which guarantees a Pnt of 1 while maximizing Pct for a fault inside the protection zone. Finding an optimal setting becomes the problem to determine a value, which maximizes Pct subject to a Pnt of 1. Fig. 7 shows that 86% of the line impedance is optimal for Zone-1, with Pct at 0.8600; this value is almost the same as the one previously applied in practice.
zone 1
G
l1
R1
zone 2 L1
L2 l2
R2
L3 l3
R3
lR1 L2
L1 l1
R1
R2
L12S l
l2
L3 l3
R3
lR
4.2 Protection Capability of Zone-2 lR2
The evaluation of the protection capability of Zone-2 can be performed in a similar way as that used for Zone-1. The difference is that Zone-2 has to trip correctly for the fault in the entire line. However, in order to secure selectivity, it should not trip for a fault supposedly protected by its forward Zone-2. 4.2.1 Correct Trip of Zone-2 Any fault in line l1 should be detected by Zone-2, and as such, its correct trip probability (Pct) is determined according to (5); this can be expressed as: Pct ( L12 S ) = ∫
L1
0
1 ⎡ L12 S f (lR1 )dlR1 ⎤ dl . ⎥⎦ L1 ⎢⎣ ∫−∞
(11)
4.2.2 No-Unwanted Trip of Zone-2 Relay R1’s Zone-2 setting is L12S, and relay R2’s Zone-1 setting is L21S. The fault at l is supposed to be cleared by the Zone-1 of relay R2 (Fig. 9). However, because of the measurement errors, the relay R2 measured fault distance, lR2, could be larger than its Zone-1 setting L21S. This leads to an under-reach for the fault; the fault would then be tripped by its Zone-2. Meanwhile, the relay R1 measured fault distance, lR1, could be smaller than its Zone-2 setting, L12S, which results in an overreach for the fault. This means that the under-reach of R2’s Zone-1 and the overreach of R1’s Zone-2 would lead to an overlap of two protection zones, and both Zone-2s would trip for a fault on this overlapped region, losing selectivity. Zone-2 should not trip for a fault in the next line, supposedly covered by its forward Zone-2. The unwanted trip happens when Zone-2 of R1 sees a fault in the next line (l2), whereas Zone-1 of R2 does not
Fig. 8. Correct trip probability for fault in l1.
L1 l1
R1
R2
L2 l L2 R 1S 3
l2
L3 l3
lR
Fig. 9. Mis-coordination between Zone-2 of R1 and Zone1 of R2. see the same fault. Its probability can therefore be calculated as a multiplication of two probabilities, namely, for a fault in the next line l2, the probability of Zone-2 to trip, and the probability of its forward Zone-1 not to trip. The first one is given as: P (lR1 | lR1 < L12 S ) = ∫
L12 S
−∞
f (lR1 )dlR1 .
(12)
The latter is given as: P (lR 2 | lR 2 > L21S + L1) = ∫
+∞
L 21 S + L1
f (lR 2 )dlR 2 .
(13)
Therefore, the unwanted trip probability is given as: Put = P (lR1 | lR1 < L12 S ) P(lR 2 | lR 2 > L21S + L1) .
(14)
Then, focusing on the fault on L2, Pnt can be obtained by subtracting it from 1, and then integrating it over the fault location region (L2) and multiplying it by the fault location probability (1/L2) as represented by: Pnt ( L12 S ) = ∫
L1+ L 2
L1
L12 S +∞ 1 ⎡ 1− ∫ f (lR1 )dlR1 ∫ f (lR 2 )dlR 2 ⎤ dl ⎢ ⎥⎦ −∞ L 21 S + L1 L2 ⎣ . (15)
This probability is dependent on the setting of Zone-1 of R2 and, in this study, it is assumed to be 85% of its own line impedance. Fig. 10 shows the two probability curves for a system, with L1 and L2 having the same length. Pct increases as the setting increases, reaching 1 at the setting of 1.14, whereas Pnt decreases from 1 at the setting of 1.6. There is a band of setting [1.14, 1.6] for two curves to have the same probability of 1.
Wen-Hao Zhang, Seung-Jae Lee and Myeon-Song Choi
P
1.2
P
P ct & Pnt
1
ct
where ωi is the weighting factor to be determined by an engineer’s judgment or is a utility policy reflecting its priority on each factor. For the two cases, namely, ( ω1 =0.5, ω2 =0.5) and ( ω1 =0.75, ω2 =0.25), the resulting protection capability graph is shown in Fig. 12, where the optimal setting is given as 1.06 and 1.08, respectively, for the case of L2 at 0.2.
nt
0.8 0.6 0.4 0.2 0
0
0.5
1 1.14 Zone 2 Setting
1.5 1.60
2 1
Fig. 10. Protection capability of Zone-2.
0.9
Zone-2 needs to satisfy two conditions, namely, 100% trip probability, Pct, for the fault in the line; and 100% nounwanted trip, Pnt, for the fault in the forward line, supposedly protected by its forward Zone-2. The first condition aims to provide a fast protection for that part of the line left unprotected by Zone-1; the second aims to avoid the miscoordination problem or to secure the selectivity. As seen in Fig. 10, it is the setting band of [1.14, 1.60], which satisfies these conditions. If the objective of Zone-2 is to complete the primary protection as in Zone-1, then any of the values can be used. If the backup capability is also expected, then the optimal setting would be the largest one in the band. The lower limit of the setting band does not change as the variations in L2 length; however, the upper limit decreases with a decrease in L2 length because of the decreased Pnt; this is depicted in Fig. 11 and Table 1. If L2 is shorter than 28% of L1, then there is no feasible setting band. In this case, the optimal setting is determined by the one that maximizes the following protection capability function: F = ω1 Pct + ω2 Pnt ,
(16)
P
nt
&P
0.6 0.5
ω1=0.75 ω2=0.25
0.4 0.3 0.2
0
0.2
0.4
0.6 0.8 Zone 2 Setting
1.06 1
1.08 1.2
1.4
Fig. 12. Zone-2 protection capability under different weighting factors.
4.3 Protection Capability of Zone-3 Zone-3 needs to identify accurately a fault in the next forward line to provide a full backup protection. Its protection reach, however, should not overlap with its forward Zone-3; otherwise, selectivity will be lost. Evaluation of its protection capability is performed as in Zone-2. 4.3.1 Correct Trip of Zone-3 Any fault in its own line (l1) and the next line (l2) should be detected by Zone-3, so its correct trip probability (Pct) is given according to (5) as: L1+ L 2
0
1 ⎡ L13 S f (lR1 )dlR1 ⎤ dl . ⎦⎥ L1 + L2 ⎣⎢ ∫−∞
(17)
nt
1
4.3.2 No-Unwanted Trip of Zone-3
0.8
L2=0.2
0.6
P
ct
ω1=0.5 ω2=0.5
0.7
Pct ( L13S ) = ∫
Pct
1.2
Protectability
0.8
4.2.3 Optimal Setting of Zone-2
L2=0.5
0.4
L2=1
0.2 0
411
0
0.5
1 1.14 1.24 Zone 2 Setting
1.5 1.60
2
Fig. 11. Protection capability of Zone-2 with varied L2. Table 1. Protection capability of Zone-2 Length (L1-L2)
Optimal Setting
Pct
Pnt
1-1
[1.14,1.60]
1
1
1-0.5
[1.14,1.24]
1
1
1-0.2
1.14
1
0.9897
As seen from Fig.13, a fault at l is supposed to be tripped by R2’s Zone-2. However, the L22S setting could under-reach the fault because it is smaller than the relay R2 measured fault distance, lR2. The fault must therefore be tripped by R2’s Zone-3. In addition, R1’s Zone-3 L13S setting could over-reach the fault because it is larger than the relay R1 measured fault distance, lR1. As such, both Zone-3s would trip for the fault, thereby losing selectivity. Zone-3 should not see a fault in the next two lines, which is supposed to be covered by its forward Zone-3. Similarly, in Zone-2’s case, the no-unwanted trip probability was calculated by first calculating the unwanted probability and subtracting it from 1. The unwanted trip occurred when Zone3 of R1 (Fig. 13) identified a fault in the next two lines (l3), whereas Zone-2 of R2 did not see the same fault.
A Probabilistic Approach to the Protection Capability Evaluation of Distance Relay in Transmission Systems
412
Fig. 14 shows the two probability curves for a system, with L1, L2, and L3 having the same lengths. Pct increases as the setting increases and reaches “1” at a setting of 2.14, whereas Pnt decreases from “1” at a setting of 2.0. 4.3.3 Optimal Zone-3 Setting Unlike Zone-2, there is no setting to satisfy a 100 % probability for both Pct and Pnt. Therefore, there is a need for a compromise in the optimal setting. If a 100% backup capability for a fault on L2 is pursued, then the optimal setting becomes 2.14, which minimally sacrifices the capability of a no-unwanted trip; and if a 100% secured nounwanted trip is pursued, then the optimal setting becomes 2.0, which minimally sacrifices the backup capability. More generally, the optimal setting is determined by finding the one, which maximizes the following objective function:
Fig. 13. Zone-3 coordination with next Zone-2. Thus, its probability can be calculated as a multiplication of two probabilities, i.e., for a fault in line L3, the probability of R1’s Zone-3 to trip, and the probability of R2’s Zone2 not to trip. The first one is given as: P (lR1 | lR1 < L13S ) = ∫
L13 S
−∞
f (lR1 )dlR1 .
(18)
The second one is given as: P ( lR 2 | lR 2 > ( L22 S + L1) ) = ∫
+∞
L 22 S + L1
f (lR 2 )dlR 2 .
(19)
The unwanted probability, therefore, becomes: Put = P (lR1 | lR1 < L13S ) P (lR 2 | lR 2 > L2 2 S + L1)
(20)
This probability is dependent on the settings of the Zone-2 of R2. In this study, it is assumed to be set as 115% of its next line (l2). Then, focusing on the fault in l3, the probability of no-unwanted trip can be obtained as Pnt ( L13S ) = ∫
L1+ L 2 + L 3
L1+ L 2
F = ω1 Pct + ω2 Pnt .
(22)
The weight factor, ωi , needs to be determined by an engineer’s judgment or by a utility’s policy. For the two cases, namely, ( ω1 =0.5, ω2 =0.5) and ( ω1 =0.75, ω2 =0.25), the resulting protection capability graph is shown in Fig. 15, where the optimal settings are given as 2.02 and 2.04, respectively. The protection capability varies, depending on the lengths of L2 and L3. As seen from Table 2 and Fig. 16 (a), with a fixed L2 and a varied L3, the optimal setting does not change because it only relies on its protected line. However, when L3 decreases, there is a higher unwanted trip probability with an increase in setting; the optimal protection capability decreases accordingly. Fig. 16 (b) shows Pct and Pnt curves under a varied L2 and a fixed L3. The optimal setting decreases if L2 decreases according to the above analysis. Although L3 is fixed, the optimal protection capability still decreases; this is because the decrease in L2 brings higher unwanted trip probability.
L13 S +∞ 1 ⎡ f (lR1 )dlR1 ∫ f (lR 2 )dlR 2 ⎤ dl 1− ∫ ⎢ ⎥⎦ −∞ L 1+ L 22 S L3 ⎣
1
(21)
0.9 0.8
P
nt
0.8 0.6
0.7 0.6
ω1=0.75 ω2=0.25
0.5
0.4
0.3
0.2
0.2 0
0
ω1=0.5 ω2=0.5
0.4
P
ct
&P
nt
1
ct
Protectability
P
1.2
0
0.5
1
1.5 Zone 3 Setting
2 2.14
2.5
Fig. 14. Protection capability of Zone-3.
3
0.5
1 1.5 Zone 3 Setting
2.02 2.04 2
2.5
Fig. 15. Zone-3 protection capability under different weighting factors.
Wen-Hao Zhang, Seung-Jae Lee and Myeon-Song Choi
P
1
P
ct
&P
nt
P
References
ct
L3=0.2
nt
0.5
[1]
L3=0.5 L3=1
0
0
0.5
1
1.5 2 2.14 (a) Zone 3 Setting
2.5
3
1.2 P
1
0.5
ct nt
L2=0.2
P
ct
&P
nt
P
0
0
0.5
L2=0.5 L2=1
1
L2=0.2
L2=0.5
1.32 1.51.64 2 2.14 (b) Zone 3 Setting
2.5
L2=1
3
Fig. 16. Protection capability of Zone-3 under varied line lengths. Table 2. Protection capability of Zone-3. Length (L1-L2-L3) Varied L3
Varied L2
413
Optimal Setting
Pct
Pnt
1-1-1
2.14
1
0.9920
1-1-0.5
2.14
1
0.9844
1-1-0.2
2.14
1
0.9702
1-1-1
2.14
1
0.9920
1-0.5-1
1.64
1
0.9522
1-0.2-1
1.34
1
0.8995
5. Conclusion In this paper, a probabilistic model for measurement errors was presented and the protection capability of a protective relay was proposed from the correct trip and nounwanted trip points of view. The application of the proposed concept to distance relays, to evaluate protection performance, and determine the optimal setting for each zone were described as well. The conventional setting rule of distance relays were found to be in accordance with the result of the theoretical analysis. The study was performed for the single adjacent line to illustrate the basic idea and to show the effectiveness of the proposed algorithm. However, the practical power systems were far more complex than a single adjacent line system. Thus, the protection capability evaluation of complex systems, including infeed, outfeed and other effects, need to be studied further for engineering applications.
Acknowledgments This work was supported by the Korea Research Foundation Grant, funded by the Korean Government (MEST)" (KRF-2007-211-D00044).
IEEE PSRC Working Group D5 (chaired by E. A. Udren). “Proposed Statistical Performance Measures for Microprocessor-Based Transmission-Line Protective Relays. Explanations of the Statistics”, IEEE Transactions on Power Delivery, Vol. 12, No. 1, pp. 134-143, Jan.1997. [2] IEEE PSRC Working Group D5 (chaired by E. A. Udren). “Proposed Statistical Performance Measures for Microprocessor-Based Transmission-Line Protective Relays. Collection and Uses of Data”, IEEE Transactions on Power Delivery, Vol. 12, No. 1, pp. 144-156, Jan.1997 [3] F. C. Chan, “Performance Assessment and Control of Power System Relaying”, IEEE Transactions on Power Delivery, Vol. 4, No. 2, pp. 986-994, April 1989. [4] Working Group on Protective Relaying Performance Criteria of the Power System Relaying Committee, “Protective Relaying Performance Reporting”, IEEE Transactions on Power Delivery, Vol. 7, No. 4, pp. 1892-1899, October 1992. [5] M. Kezunovic, J. T. Cain, B. Perunicic, S. Kreso, “Digital Protective Relaying Algorithm Sensitivity Study and Evaluation”, IEEE Transactions on Power Delivery, Vol. 3, No. 3, pp. 912-922, July 1988. [6] Mladen Kezunovic, Bogdan Kasztenny, “Design Optimization and Performance Evaluation of the Relaying Algorithms, Relays and Protective Systems Using Advanced Testing Tools”, IEEE Trans. On Power Delivery, Vol. 15, No. 4, Oct. 2000 [7] S. J. Lee, et al, “Protection Levels Evaluation of Distribution Systems Based on Dempster-Shafer Theory of Evidence”, Power Engineering Society Winter Meeting, 2000. IEEE, Vol. 3, pp. 1894-1899, Jan. 2000. [8] S.J. Lee, S. H. Kang, M. S. Choi, S. T. Kim, C. J. Kim, “ A new evaluation methodology for system of primary distribution systems considering multifactors based on dempster’s combination rule”, Trans. of KIEE, Vol. 48, No. 11, Nov.1999. [9] E.R. Sexton and D. Crevier, “A Linearization Method for Determining the Effect of Loads, Shunts and System Uncertainties on Line Protection with Distance Relays”, IEEE Transactions on PAS, Vol. 100, No. 11, pp. 4434-4441, Nov. 1981. [10] J. Pinto de Sa, J. Afonso, “A Probabilistic Approach to Setting Distance Relays in Transmission Networks”, IEEE Transactions on Power Delivery, Vol. 12, No. 2, April 1997, pp. 681-686
414
A Probabilistic Approach to the Protection Capability Evaluation of Distance Relay in Transmission Systems
Wen-Hao Zhang was born in Shanxi, China in 1982. He received his B.E. degree in Electrical Engineering from the Harbin Institute of Technology, Harbin, China in 2003. He received his M.S. degree in Electrical Engineering from Xi’an Jiao Tong University, Xi’an, China in 2006. He is now working towards his Ph.D. at Myongji University. His research interests include power system protection and control, and power system automation. Seung-Jae Lee was born in Seoul, Korea in 1955. He received his B.E. and M.S. degrees in Electrical Engineering from Seoul National University, Korea in 1979 and 1981, respectively. He received his Ph.D. in Electrical Engineering from the University of Washington, Seattle, USA in 1988. Currently, he is a Professor at Myongji University and a Director at the Next-Generation Power Technology Center (NPTC). His major research fields include protective relaying, distribution automation, and AI applications to power systems.
Myeon-Song Choi was born in Chungju, Korea in 1967. He received his B.E., M.S., and Ph.D. degrees in Electrical Engineering from Seoul National University, Korea in 1989, 1991 and 1996, respectively. He was a Visiting Scholar at the University of Pennsylvania State in 1995. Currently, he is a Professor at Myongji University. His major research fields include power system control and protection, including artificial intelligence applications.