spectral density (PSD) of the low-frequency noise always .... best threshold for extracting the 1/f noise spectrum. The ... PSD at lHz) and y is the flicker slope.
Instrumentation and Measurement Technology Conference - IMTC 2007 Warsaw, Poland, May 1-3, 2007
A Procedure For Extracting 1/f Noise From Random Telegraph Signals Gino Giusi. Felice Crupi, Calogero Pace
DEIS, University of Calabria, Via Pietro Bucci 42C, 87030 Arcavacata di Rende (CS), Italy Phone: +39-0984-494767, Fax: +39-0984-494834, Email: g.giusi@,&ingegneria. unime. it, crupi@4,unical. it, cpace@4,unical. it
belonging to an RTS level. The main drawback of this procedure is that it works only in the case of a two-level RTS with a constant amplitude. In this work, we propose a new algorithm which allows to extract the 1/f noise even in presence of several RTS with different corner frequencies.
Abstract - This work proposes a procedure for separating the 1if noise from RTS noise in the time domain. The main advantage, respect to other methods, is that it does not assume a single hidden RTS, but it can extract the 1f component even in presence ofseveral RTS with different corner frequencies. The procedure has been validated through low-frequency noise measurements of the gate current in a MOSFET device. Keywords - Low frequency noise, If noise, Random Telegraph Signals, gate current noise.
I.
II. TUE PROPOSED ALGORITHM The 1/f noise is extracted by a threshold based algorithm. The role of the algorithm is to detect jumps, which are the RTS components hidden in the signal trace. The algorithm is divided into 3 major parts: 1) set of a threshold value, 2) rising/falling edge identification in the signal trace, 3) jumps detection. With the word, edge, we intend a rising/falling monotonous succession of points in the signal trace. If the magnitude of an edge is equal or greater than the threshold, the edge is classified as a jump. The flow chart of the procedure is shown in Fig. 1. Once that we have stored in memory the signal trace we must define a threshold array, which is the window of possible thresholds. The first threshold is set and the signal trace is scanned for detecting edges. Once an edge is detected, its magnitude is compared with the threshold. The magnitude is calculated by averaging for n points before the begin of the edge, and for m points after the end. This averaging is useful to exclude large peakto-peak magnitude background noise. If the magnitude is equal or greater than the threshold the edge is classified as jump and the start/stop edge indices of the signal trace array are recorded. Indeed the edge is filtered by recalculating the start/stop indices. This procedure works as follows: 1) the maximum derivative is calculated in the signal edge, 2) only the points whose derivative value is comprised into a fixed range, fraction of the maximum derivative, are points of the jump. In this work only points that are into the 9000 of the maximum derivative values are points of the jumps. With this filter the recovered RTS signal is squared. The lack of "squaring" in the signal trace could be due to a poor bandwidth in the measurement system and/or to a poor sampling frequency. At the end of the scan of the signal trace we have in memory two arrays: the first array holds the indices of the begin of the detected jumps, and the second array holds the indices of the end of the detected jumps. The RTS is simply extracted by averaging the acquired signal trace points comprised between the end of each jump and the begin of the next one. The flicker noise component is then
INTRODUCTION TO TlHE PROBLEM
Low-frequency current noise measurement is one of the most powerful probe for sensing the defects and the conduction mechanisms in CMOS devices [1-5]. The power spectral density (PSD) of the low-frequency noise always presents a flicker component or 1 /f component, with y typically close to one (for this reason, in the following we will refer to this component as 1/f noise). In some frequency interval, the 1/f component can be hidden by single lorentzian components due to random telegraph signals (RTS) [6]. Both noise effects, 1/f and RTS, are ascribed to the same cause which is the trapping and detrapping of charge carriers at the silicon/oxide interface or in the oxide. As a matter of fact, the 1/f noise can be obtained as a superimposition of several RTS components [2]. The main difference is that the study of the 1/f noise is used for extracting the properties of the whole set of traps (i.e. defect density, energy distribution, spatial distribution) while the study of the RTS noise is used for evaluating the properties of a single trap (i.e. capture time, emission time, energy level, spatial position). The measurement of the 1/f noise of the drain current in MOSFET is widely used for extracting the defect density in gate dielectrics. As the device dimensions shrink, the total number of defects is reduced and single RTS components can dominate the low-frequency spectrum, thus making unfeasible the 1/f noise measurements. This problem is usually bypassed by using large area devices and by assuming that noise mechanisms and defect density are independent on the device geometry. As a consequence, drain and gate current 1/f noise measurements can not be easily performed in short channel MOSFETs with channel length lower than about 1 gim. In order to overcome this limit, time domain analysis procedures for the separation of RTS from 1/f noise have been proposed [7, 8]. They are based on the analysis of the level histogram of the measured signal and the separation of the data points into two sub-records each
1-4244-0589-0/07/$20.00 ©2007 IEEE
1
Fig.l. Flow chart of the proposed algorithm.
calculated by simply evaluating the spectrum of the difference between the extracted RTS signal and the original signal trace. At this point the next threshold of the array is chosen and the cycle restarts. Once we have in memory the spectra for all the threshold values, the algorithm chooses the best threshold for extracting the 1/f noise spectrum. The evaluation the of the best threshold is performed by plotting the flicker parameters A, y as a function of the threshold value, where A is the flicker coefficient (i.e. the flicker noise PSD at lHz) and y is the flicker slope. The presence of a plateau in the plot indicates that there is an interval of threshold values in which the algorithm result is independent on the threshold. As one can imagine one plateau always exists and it corresponds to threshold values greater than the maximum peak-to-peak amplitude of the acquired signal trace. The flicker parameters corresponding to this "saturation plateau" are the ones which are obtained without extracting
the RTS. For lower threshold values the flicker parameters decrease with the threshold amplitude. If another plateau exists in this region the algorithm can works and the best threshold is chosen as the middle value of the threshold values in this "useful plateau". If no other flat region exists and the plot goes down monotonically with lower threshold values, the proposed algorithm does not work because its result is dependent on the particular chosen threshold. In presence of several RTS, several plateaux can be observed and in this case we choose the lowest plateau as the "useful plateau". The main advantage of this method is that it does not assume a single hidden RTS as previous methods [7, 8], but it can extract the 1/f component even in presence of a mix of RTS with different corner frequencies. Moreover, once the threshold parameter has been chosen, the method can be applied also in real time, without requiring a post-acquisition statistical analysis of the measured signal.
Transimpedance
Gain
Pass Filter
DUT
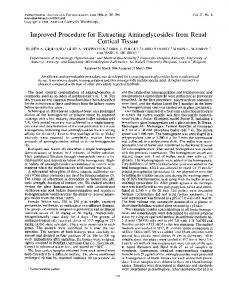
Bias Stage Fig. 2. Schematic of the measurement system composed of a low noise amplifier coupled to a PC based spectrum analyzer. The gate current signal is amplified by a trans-impedance amplifier with a 1 MQ feedback resistor and by a voltage amplifier with gain equal to 101. The signal is AC coupled with a cutoff frequency of 100 mHz. The method is validated by measuring the gate current noise of a nMOSFET.
III.
EXPERIMENTAL VALIDATION
1 Ox10-9
8.0x1O-10 _
In order to validate the proposed method, gate current noise measurements were performed. The device under test is a nMOSFET with strained silicon with W= 10 ptm and L=1 ptm [9]. The measurement system (see Fig. 2) is a low noise amplifier coupled to a PC based spectrum analyzer [10]. The DUT is connected in the capacitor configuration with drain, source and bulk tied together. The gate voltage is applied by a low noise bias stage through the virtual short circuit between the inverting and not inverting input of the trans-impedance amplifier. To increase the signal-to-noise ratio the current noise is amplified by a gain stage which is AC coupled (to prevent saturation) to the trans-impedance amplifier. The trans-impedance gain is 1MQ, the cutoff frequency of the AC filter is 100 mHz and the gain of the voltage amplifier is equal to 101. The PSD of the amplified signal is evaluated by a PC based spectrum analyzer. A time window of the acquired signal is shown in Fig. 3. The jumps in the signal due to RTS phenomena are evident. The chosen values of n and m are 3 and 1 respectively in this experiment. Plots of A and y as a function of the threshold are shown in Fig. 4. Indeed the A parameter (which is the PSD value at 1 Hz) is substituted by the PSD value at 60 Hz because of the AC coupling. As one can see for both parameters exists two flat regions. The higher flat region is the always present "saturation plateau" due to threshold current values greater than the maximum peak-to-peak
6.0x10 -10 I-,
a)
4. Ox1 10 _ 2. Ox1 -10 _ 0.0
QD
-2.0x1 0-10
-4.0XOx
-10
_
-6. Ox1G0 _0 4.62x1 05
4.63x10⁵
4.64x1 05
4.65x1 05
Time (s)
Fig. 3. A window of the acquired signal (symbol) and the RTS extracted by using the proposed algorithm (line) with a threshold value of 400pA.
amplitude of the acquired signal. The lower flat region is the "useful plateau", which indicates the presence of a threshold range in which the algorithm result is independent on the threshold. Because this plateau appears in the A plot and in the y plot for the same range of threshold currents, the extracted spectrum does not change in that range. Finally we assume as the best threshold the value of 400pA, which is the middle value in the plateau. Fig. 3 shows the acquired signal with the fit obtained with this particular choice. The fit line is the extracted RTS signal. The spectra before and after the extraction procedure are reported in Fig. 5. The extracted slope is 0.9 (typical for 1/f noise spectra) while the original 3
N
10
N
-2
N
102
I
to
00
useful plateau *
-
CD
.D
frequencies. Once the threshold parameter has been chosen, the method can be applied also in real time, without requiring a post-acquisition statistical analysis of the measured signal. The procedure has been validated through low-frequency noise measurements of the gate current in a MOSFET device.
- *00***
10 23
E 1lo-24
1
V. ACKNOWLEDGMENT
plateau
(a)
0
Ea
a)
saturation
(
5
0
This work has been partially supported by the Italian Ministry of Foreign Affairs under the RHESSA project. The authors wish to thank Prof. Guido Groeseneken from IMEC for sample provision.
saturation plateau
-.* 0.0
useful plateau
REFERENCES (b)
[1]
4.0x10⁻¹⁰ 8.0x10⁻¹⁰ 1.2x10⁻⁹ Threshold (A)
[2] [3]
Fig. 4. The spectrum amplitude at 60 Hz (a) and the spectrum slope (b) as a function of the threshold. Both parameters are extracted by fitting the PSD of the signal in the range 6OHz-9OHz.
[4] [5]
N
[6]
10
N
signal before RTS extraction
[7]
,-,
>% 10 C/,
[8]
22
-au (U)
QL
U) 1 o0 0
n
23
I
[9]
signal after RTS extraction
)24 10
[10]
1 00
Frequency (Hz) Fig. 5. The spectrum before and after the extraction of the RTS noise (threshold equal to 400pA). The slope changes from 2.0 to 0.9 (see also Fig.4b).
slope is 2.0 (typical for RTS spectra). It is worth to note that after the RTS extraction the spectrum shows two evident peaks at f-50 Hz and f=O100 Hz. These peaks are due to the noise induced by the power line which is hidden in the original acquired signal because of the relative high PSD value at these frequencies. IV.
CONCLUDING REMARKS
In this work, we have proposed a procedure for separating the 1/f noise from RTS in the time domain. The algorithm is based on the choice of a single threshold parameter. Its main advantage is that it does not assume a single hidden RTS as previous methods [7, 8], but it can extract the 1/f component even in presence of several RTS with different corner 4
A. Van der Ziel, "Noise: Sources, Characterization, Measurement", Englewood Cliffs, NJ: Prentice-Hall, 1970 M.J. Kirton and M.J. Uren, "Noise in solid-state microstructures: A new perspective on individual defects, interface states and lowfrequency (1/f) noise", Advances in Physics vol. 38, pp. 367-468, 1989. R. Jayaraman, C.G. Sodini, "A 1/f noise technique to extract the oxide trap density near the conduction band edge of silicon", IEEE Trans. Electron Devices, vol. 36, n. 9, pp. 1773-1782, 1989. K.K, Hung, P.K. Ko, C. Hu, Y.C. Cheng, "A unified model for the flicker noise in metal-oxide-semiconductor field-effect transistors", IEEE Trans. Electron Devices, vol. 37, n. 3, pp. 654-665, 1990. E. Simoen, C. Claeys, "On the flicker noise in submicron silicon MOSFETs", Solid-State Electron., vol. 43, pp. 865-882, 1999. S. Machlup, 'Noise in Semiconductors: Spectrum of a Two-Parameter Random Signal,' J. Appl. Phys., vol. 25, no. 3, pp. 341-343, 1954 Y. Yuzhelevski, M. Yuzhelevski, and G. Jung, 'Random Telegraph Noise Analysis in Time Domain,' Rev. Scientific Instruments, vol.71, no.4, 2000 J.S. Kolhatkar, L.K.J. Vandamme, C. Salm, and H. Wallinga, "Separation of Random Telegraph Signals from 1/fNoise in MOSFETs under Constant and Switched Bias Conditions", Proceedings of ESSDERC, pp. 549-552, 2003 G. Giusi, F. Crupi, E. Simoen, G. Eneman, M. Jurczak, "Performance and reliability of strained silicon nMOSFETs with SiN cap layer", IEEE Trans. Electron Devices, vol. 54, n. 1, pp. 78-82, 2007. G. Giusi, F. Crupi, C. Ciofi, C. Pace, "Instrumentation design for gate and drain low frequency noise measurements", IMTC Conf Proc., pp. 1747-1750, 2006