should also be grouped within a bounding box called textbox. ... illustration of charbox and textbox. ...... [14] http://graphics.nynexst.com/iapr-tc10/contest.html.
A Proposed Scheme for Performance Evaluation of Graphics/Text Separation Algorithms Liu Wenyin
Dov Dori
Faculty of Industrial Engineering and Management TechnionIsrael Institute of Technology, Haifa 32000, Israel {liuwy; dori}@ie.technion.ac.il http://iew3.technion.ac.il:8080/{~liuwy; Home/Users/dori.phtml} We propose an objective, comprehensive, and complexity independent metric for performance evaluation of graphics/text separation (text segmentation) algorithms. The metric includes a positive set and a negative set of indices, at both the character and the character string (text) levels, and it evaluates the detection accuracy of the location, width, height, orientation, skew, string length, and the fragmentation of both characters and strings. Assigning a Segmentation Difficulty (SD) value to the ground truth characters, the performance indices are normalized with respect to the character SD and are therefore independent of the ground truth complexity. The evaluation provides an overall, objective, and comprehensive metric of the text segmentation capability of various algorithms aimed at performing this task. Keywords: Performance Evaluation, Text Segmentation, Document Analysis and Recognition
1. Introduction Performance evaluation is a rather new research topic in the field of documentation analysis and recognition (DAR). We view performance as a set of interesting metrics on the output data that an algorithm or a system produces. Usually, these metrics are expressed in terms of the difference between the expected output and the actual output of the algorithm or system. Accepted relevant metrics may help compare, select, improve, and even design new methods to be applied in new systems designed for some specific application. Performance evaluation has been recognized as an important factor in advancing the DAR research. Most work to date has been done for the performance evaluation of thinning algorithms and line detection algorithms. Haralick [1] has been the first to propose a general approach for performance evaluation of image analysis, with thinning taken as a case in point. Evaluation and comparison of thinning algorithms has also been carried out by Lee et al. [2], Lam and Suen [3], Jaisimha et al. [4], and Cordella and Marcelli [5]. Some of these evaluation and comparison works were done from the viewpoint of Optical Character Recognition (OCR), while the work of Jaisimha et al. [4] is domain independent. Performance evaluation of vectorization
and line detection have been reported recently by Kong et al. [6] and Hori and Doermann [7], and Liu and Dori [8]. To evaluate the performance of DAR algorithms we need three elements. First of all, we need to know the expected output—the ground truth—so that it can be compared with the actual output—the segmentation results. Therefore, a sound methodology of acquiring the appropriate ground truth data is required. Secondly, Since both the ground truth and the segmentation results consist of many graphic objects, individual comparison of each ground truth to its matching segmented object should be done first. To do this, each ground truth graphic object must first be matched with one or more objects from the segmented objects set. Hence, a sound matching method is needed. Finally, quantitative indices that measure the interesting metrics should be defined uniformly. These three elements—(1) ground truth and segmented graphic objects, (2) matching procedure and (3) metric definition— comprise a DAR performance evaluation protocol. Segmentation of text from graphics-rich documents (e.g., engineering drawings), which may also be referred to as graphics/text separation, plays an important role in DAR since it constitutes the basis for correct text recognition—an integral part of DAR. A number of text segmentation algorithms have been developed by Fletcher and Kasturi [9], Chai and Dori [10], Gao et al. [11], Dori and Liu [12], etc., but the detailed performance of these methods and systems are at best reported by their developers. Frequently, the evaluation is based on perceptual, subjective, and qualitative human vision evaluation. Objective evaluations and quantitative comparisons among existing text segmentation algorithms are not available. This is due to the lack of a protocol that provides for the three elements discussed above: quantitative measurements of interesting metrics, a sound methodology for acquiring appropriate ground truth data, and adequate methods for matching the ground truth data with the segmentation data. In this paper we propose an objective, comprehensive, and complexity independent performance evaluation protocol for text segmentation algorithms, which is an extension of our line detection algorithm performance evaluation protocol discussed in [8]. The protocol includes a positive set and a negative set of indices, at both the character and the character string (text) levels, and it evaluates the detection accuracy of the location, width, height, orientation, skew, string length, and the fragmentation of both characters and strings. However, the correct character recognition is not included in the protocol. Assigning a segmentation difficulty (SD) value to the ground truth characters, the performance indices are normalized with respect to the character SD and are therefore independent of the ground truth complexity. As we experiment with some typical segmentation errors and the text segmentation results of the Machine Drawing Understanding System (MDUS) [13], the evaluation provides an overall, objective, and comprehensive metric of the text segmentation capability of various algorithms aimed at performing this task.
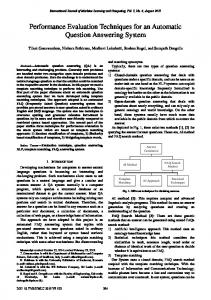
2. The Segmentation Difficulty Indices DAR algorithms process binary document images to output a set of recognized graphic objects, including text. The purpose of text segmentation is twofold: recognition and layer separation. For recognition, the character box (charbox), which is the minimal area that bounds the character’s image, should be found so that the image within it can be input into an OCR module. To ensure the OCR accuracy, the charbox should be bounded such that all the black pixels belonging to the character and only these pixels should be included within it. To improve text understanding at a higher level, all the characters belonging to the same string (word, number, phrase) should also be grouped within a bounding box called textbox. See Figure 1 for illustration of charbox and textbox. The purpose of layer separation is to clear the document image so that only graphics are left for further processing. In this case, the charboxes need not be as precise as they need to be for OCR. Since we focus on the purpose of OCR, our protocol requires that the charbox be precise.
width skew angle
fine charbox
center
height normal charbox
base line
textbox
anchor point
Figure 1. Illustration of a textbox and its constituent charboxes.
Segmentation of text from graphics-rich documents is more complex than that of conventional OCR. Difficulties are due to a variety of factors, including text/graphics mixture; low image quality; handwriting of characters; character connectivity (mainly with nearby graphic objects); and variation in character location (anchor point), orientation, size, font and skew angle. To make the charbox as small and isolated as possible, instead of an upright rectangle, we define the charbox as a slanted parallelogram. Figure 1 illustrates the relevant definitions. The baseline is the text orientation and the side edge is the skew of the font from the text orientation. The charbox center is defined as the crossing point of the parallelogram diagonals. The ground truth used for performance evaluation of text segmentation algorithms is a set of expected output expressed in the vector form. The ground truth data includes the position, orientation, font style, skew, size (height), width, and
character density. Character density is defined as the number of characters per normal character space for a given font. The normal value of character density is 1. If the value is greater than 1, the string is sparse, while if the value is less than 1, it is dense. The segmentation difficulty (SD) index is an index that expresses the difficulty of segmenting a ground truth character. It depends on two factors. The first has to do with the variation of character font and orientation. We assume that a precise segmentation of a given charter from a slant orientation is more difficult than that from a vertical orientation, which, in turn, is more difficult than that from a horizontal orientation. A skewed font is more difficult to segment than an upright one since the former way include neighboring strokes. The second factor is the character itself. For the same orientation and the same font, small, narrow, wide, short characters, and those with isolated strokes (such as “=”, “;”, and “%”) are more difficult to segment than big, normal width, tall characters, and those with connected strokes. Hence we include the character orientation, skew, width, height, and number of isolated strokes as factors that affect the segmentation difficulty of a character. The performance evaluation protocol is designed for segmentation of all characters that may appear in graphics-rich documents, and in particular, engineering drawings. The set includes all visible ASCII characters and all the special characters. We define SD Level (LSD) for ground truth characters depending on the following factors. 1. Character Connectivity: For each character c, the initial SD level, LSD(c), is set to the number of connected stroke segments, which is 1 for most of characters, 2 for those which have two groups of connected strokes, like “=”, “:”, etc., 3 for those having three groups of connected strokes, like “≡” and so on. 2. Charbox Width: If the difference between the charbox width of c, W(c), and the normal width (WN) of the same font is greater than WN/3, LSD(c) is increased by 1. “1”, “I”, “.”, and “;” are examples of characters which are much narrower than the normal width. Similarly, for some fonts, “W” and “M” are much wider than the normal width. 3. Charbox Height: If the difference between the charbox height of c, H(c), and the normal height (HN) of the same font is greater than HN/3, LSD(c) is increased by 1. “.”, “=”, “-”, and “:” are much shorter than the normal height. 4. Skew: If the font of c is skewed, i.e., the skew angle is not zero, LSD(c) is increased by 1.
5. Orientation: If the orientation of c is vertical, LSD(c) is increased by 1. If the orientation of c is neither vertical or horizontal, LSD(c) is increased by 2. 6. String Length: If c is within a string whose length is 1, LSD(c) is increased by 1. 7. String Density: If c is within a string whose density is not 1, LSD(c) is increased by 1.
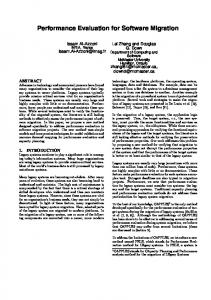
3. The Matching of the Ground Truth and the Segmentation Since the unit of text is character, we first match charboxes. The matching of the ground truth and the segmentation results is based on their overlap area. We adapt the line matching in [8] to handle a pair of a ground truth charbox and a segmented charbox. The two match if their areas overlap at least partially. As illustrated in Figure 2, the overlap area represents the extent of the matching, as it is used as the weight of the segmentation quality. Given two charboxes, if one’s center falls inside the other, they overlap each other. Otherwise, if any one of the four corners of one charbox falls inside the other charbox, they overlap. We match character strings (textboxes) based on their constituent characters’ matching results. A pair of a ground truth text and a segmented text is defined as matching if at least a character in the ground truth text matches a character in the segmented text. The overlapping substring is used similar to the overlap area of charboxes. The length (number of the charboxes) of the overlapping substring represents the extent of the string matching. Figure 2 illustrates some cases of matching of charboxes and text, where dotted lines are charboxes and dashed lines are textboxes, gray lines are ground truths and black lines are the segmentation. In Figure 2(a) a bigger charbox is matched with the ground truth charbox. In Figure 2(b) a smaller charbox is matched with the ground truth charbox because the its center falls in the ground truth. In Figure 2(c) a totally different charbox is matched with the ground truth charbox because they intersect. In Figure 2(d) the vertical textbox is matched with two horizontal textboxes.
2
2 O E — E
(a)
(b)
(c)
(d)
Figure 2. Matching ground truth and segmentation, charboxes and textboxes.
4. The Performance Indices of Characters and Text We evaluate the segmentation accuracy on charbox location, orientation, width, height, slant angle, and the text string. The location accuracy is reflected by the overlapping area. Hence we do not evaluate it separately. The character level segmentation performance indices include the basic character segmentation quality, which is the combination of the detection quality of height, width, orientation, and font slant of the character box, and the character segmentation fragmentation quality. The product of the basic character quality and the fragmentation quality is the overall segmentation detection quality. The string level indices include the basic string segmentation quality, which is the SD-weighted average of its constituent characters' overall detection quality and string segmentation fragmentation quality. Both character level and string level indices are normalized according to the complexity of the ground truth. Segmentation rate and false alarm rate are calculated from these indices. 4.1 The Charbox Segmentation Quality of the Charbox Overlap Consider a matched pair of a segmented charbox s and a corresponding ground truth charbox g. Let their virtual overlapping charbox be c. The charbox segmentation quality of c (Qc(c)) is the weighted product of the following four quality factors: Orientation Quality—QO(c), Width Quality—QW(c), Height Quality—QH(c), Skew Quality—QSk(c), which are defined below. For the sake of simplicity, the weights in the product are taken to be equal. The total charbox segmentation quality is the geometric mean of the four quality factors, as expressed in Equation 1.
(
)
Qc(c ) = QO(c)QW (c)QH (c )QSk(c )
1/ 4
(1)
where, −
QO(c) = e QW (c) = e QH (c) = e
|O ( g ) − O ( s )| π /2
|W ( g ) − W ( s )| − WN / 2
| H ( g )− H ( s )| − HN 2
(2) (3) (4)
|Sk ( g )− Sk ( s )| − π /2
(5) QSk (c) = e We define the SD value (VSD) at a given SD Level, VSD(LSD), such that VSD(LSD) increases as LSD increases. It may be assigned after some experiments. Currently, we use a square root function defined in Equation 6 and the SD independent charbox segmentation quality is therefore defined in Equation 7.
VSD( LSD) = LSD
(6)
QSD(c ) = Qc(c )
1 VSD ( g )
= Qc(c)
1 L SD( g )
(7) Since a single ground truth character may be segmented as several charboxes, its segmentation quality is defined in terms of two elements. The first element is the character’s Basic Quality (Qb(g)), which is the area size weighted sum of the charbox segmentation qualities of the overlapping area between the ground truth charbox and each of its segmented charboxes. The second element is the Fragmentation Quality (Qfr(g)), which indicates how fragmented the segmented charbox is with respect to the ground truth charbox. Denote by S(g) the set of the segmented charboxes that (fully or partially) overlap ground truth charbox g. Let k be an element of S(g) and let A(a) be the size of any area a. The Basic Quality of ground truth charbox g is defined as
∑ (Q
(k ∩ g) A(k ∩ g))
SD
Qb(g) =
k ∈S ( g )
∑ A(k ∩ g))
max( A( g),
(8)
k ∈S ( g )
where, k∩g is the virtual overlapped charbox of k and g, and A(k∩g) is its size. Qfr(g) is defined in Equation (10) as the average of the squared overlapping charbox size, such that the more equally broken the segments are, the smaller is the Fragmentation Quality.
Qfr ( g) =
∑ A(k ∩ g)
2
k ∈S ( g )
∑ A( k ∩ g)
(9)
k ∈S ( g )
The total charbox segmentation quality of g is defined as
Q( g ) = Qb ( g )Qfr ( g )
(10)
Similarly, the total charbox segmentation quality of s is defined as
Q(s ) = Qb (s)Qfr (s )
where,
∑ (Q
(11)
(k ∩ s ) A( k ∩ s ))
SD
Qb(s) =
k ∈G ( s )
max( A(s),
∑ A(k ∩ s))
(12)
k ∈G ( s )
Qfr (s ) =
∑ A(k ∩ s)
k ∈G ( s )
∑ A(k ∩ s)
2
(13)
k ∈G ( s )
where, G(s) is the set of the ground truth charboxes that (fully or partially) overlap segmented charbox s, and k is an element of G(s).
Consider a matched pair of a segmented string s and a corresponding ground truth string g. Let the substring which consists of all g’s characters that have matched character in s be STRG(g∩s), the substring which consists of all s’s characters that have matched character in g be STRS(g∩s), and L(str) be the length of a string str. The ground truth text quality of STRG(g∩s), (Q(STRG(g∩s)) is the average of the charbox segmentation quality defined in Equation 10 and the segmented text quality of STRS(g∩s), (Q(STRS(g∩s)) is the average of the charbox segmentation quality defined in Equation 11.
Q(STRG(g ∩ s )) =
L ( STRG ( g ∩s )) 1 ∑ Q( gi) L( STRG(g ∩ s)) gi∈g,i =1
(14)
Q(STRS( g ∩ s)) =
L ( STRS ( g∩ s )) 1 ∑ Q(si) L(STRS( g ∩ s)) si∈s,i =1
(15)
4.2 The Text Segmentation Rate Like charboxes, textboxes may also have segmentation fragmentation/combination. The segmentation quality of a ground truth character string is therefore defined in terms of two elements. The first element is the string’s Basic Quality (QTb(g)), which is length weighted average of the ground truth text qualities of the overlapping substring between the ground truth string and each of its segmented string, with the weight being the length of the overlapping substring. The second element is the Fragmentation Quality (QTfr(g)), which indicates how fragmented the segmented string is with respect to the ground truth string. Denote by S(g) the set of the segmented strings that (fully or partially) overlap ground truth string g. Let k be an element of S(g) and let L(a) be the length of any string a. The Basic Quality of ground truth string g is defined as
∑ (Q(STR ( g ∩ s)) L(STR ( g ∩ s))) G
QTb (g) =
k ∈S ( g )
max( L(g),
G
∑ L(STR (g ∩ s)))
(16)
G
k ∈S ( g )
where, k∩g is the virtual overlapped charbox of k and g. Qfr(g) is defined in Equation (17) as the average of the squared overlapping string length, such that the more equally broken the string are, the smaller is the Fragmentation Quality.
∑ L(STR ( g ∩ s)) G
QTfr ( g) =
2
k ∈S ( g )
∑ L(STR (g ∩ s))
(17)
G
k ∈S ( g )
The total ground truth string quality of g is defined as
QT ( g) = QTb(g)QTfr ( g)
(18) The Text Segmentation Rate of the entire document is the string length weighted average of the ground truth string qualities of all ground truth text in the document (Tg):
∑ Q ( g) L( g) T
S=
g∈T g
(19)
∑ L( g)
k ∈Tg
4.3 Missegmentation Rate Similarly, denote by G(s) the set of the ground truth strings that (fully or partially) overlap the segmented string s, the Basic Quality of segmented string s is defined as
∑ (Q( STR (k ∩ s)) L(STR (k ∩ s))) max( L( s), ∑ L( STR (k ∩ s ))) S
QTb (s) =
S
k ∈G ( s )
(20)
S
k ∈G ( s )
The Fragmentation Quality of segmented string s is defined as
∑ L(STR (k ∩ s)) S
2
k ∈G ( s )
QTfr ( s) =
∑ L(STR (k ∩ s))
(21)
S
k ∈G ( s )
The total segmented string quality of s is defined as
QT (s ) = QTb(s )QTfr (s )
(22) Since the segmented string quality of s reflects the degree of s being a correct segmentation, 1–QT(s) therefore reflects the degree of s being a false alarm (missegmentation). Hence, the missegmentation quality of s is defined as (23) FT (s) = 1 − QT (s ) The Missegmentation Rate of the entire document is the string length weighted average of the miscegenation qualities of all segmented strings from the document, denoted by Ts:
∑ F ( s ) L( s ) F= ∑ L( s ) T
s∈Ts
(24)
s ∈Ts
The combined Text Segmentation Index is
TSI = βS + (1 − β )(1 − F )
(25) where β is the relative importance of segmentation and missegmentation. β is originally set as 0.5 to assign equal importance to segmentation and missegmentation, as used in the experiments in this paper. However, they may be set with other values in the performance evaluation of some task-specific systems. For instance, β can be set smaller to give higher importance of the false alarm if the reliability level rather than the level of the segmentation is more critical. With appropriate values of β, the combined indices give quantitative performance evaluation. The higher the combined indices, the better the algorithm.
Table 1. Examples of performance evaluation of a charbox and textbox segmentation. Fig. No. Error type
2a orientation char ‘E’ angle π/4 char skew π/9 box width 100 height 120 (g) density 1 5 LSD “E” textbox (g) “E” STRG(g∩s) char ‘E’ char angle 0 box skew 0 width 125 (s) height 186 “E” textbox (s) “E” STRS(g∩s) charbox g∩s area 12000 Qo(g∩s)—Eq. (2) 0.61 QW(g∩s)—Eq. (3) 0.61 QH(g∩s)—Eq. (4) 0.33 QSk(g∩s)—Eq. (5) 0.80 Qc(g∩s)—Eq. (1) 0.56 QSD(g∩s)—Eq. (7) 0.77 0.77 Qb(g)—Eq. (8) 1 Qfr(g)—Eq. (9) 0.77 Q(g)—Eq. (10) Eq.(14) 0.77 QTb(g)—Eq. (16) 0.77 QTfr(g)—Eq. (17) 1 QT(g)—Eq. (18) 0.77 0.77 S—Eq. (19) Qb(s)—Eq. (12) 0.40 Qfr(s)—Eq. (13) 0.52 0.21 Q(s)—Eq. (11) Eq.(15) 0.21 QTb(s)—Eq. (20) 0.21 QTfr(s)—Eq. (21) 1 QT(s)—Eq. (22) 0.21 0.79 FT(s)—Eq. (23) 0.79 F—Eq. (24) 0.49 TSI—Eq. (25)
3a 3b font size skew ‘A’ ‘1’ 0 0 π/9 0 30 20 50 50 1 1 3 3 “A” “1” “A” “1” ‘A’ ‘1’ 0 0 π/6 0 30 10 50 50 “A” “1” “A” “1” 1250 500 1 1 1 0.51 1 1 0.89 1 0.97 0.84 0.98 0.89 0.84 0.45 1 1 0.84 0.45 0.84 0.45 0.84 0.45 1 1 0.84 0.45 0.84 0.45 0.84 0.89 1 1 0.84 0.89 0.84 0.89 0.84 0.89 1 1 0.84 0.89 0.16 0.11 0.16 0.11 0.84 0.67
3c 3d charbox charbox fragment combination ‘=’ ‘A’ 0 0 0 π/9 40 30 30 50 1 1 3 2 “=” “AB” “=” “AB” ‘1’ ‘[AB]’ 0 π/2 0 0 10 80 40 50 “11” “[AB]” “11” “[AB]” 400 1500 0.37 1 0.22 0.04 0.71 1 1 0.8 0.49 0.41 0.66 0.53 0.44 0.53 0.71 1 0.31 0.53 0.31 0.53 0.31 0.53 1 1 0.31 0.53 0.31 0.53 0.66 0.40 1 0.71 0.66 0.28 0.66 0.28 0.66 0.28 1 1 0.66 0.28 0.34 0.72 0.34 0.72 0.49 0.41
3e textbox fragment ‘7’ 0 π/9 30 50 1 2 “7.5″”
3f textbox
2d text combination orientation ‘W’ ‘0’ 0 0 0 0 60 50 50 50 1 2 3 3 “W”; “BC” “20”; “E—E”
“7.”, “5″” “W”; “BC” “0”; “—”
‘[7.]’ 0 π/18 40 50 “[7.]”;“5″” “[7.]”;“5″”
1500 1 0.51 1 0.89 0.82 0.87 0.87 1 0.87 0.75, 1 0.88 0.71 0.62 0.62 0.86 0.94 0.81 0.81; 1 0.81; 1 1; 1 0.81; 1 0.19; 0 0.06 0.78
‘W’ 0 0 60 50 “WBC”
‘0’ π/2 0 50 50 “10” “W”, “BC” “1”, “0” 3000 2500 1 0.37 1 1 1 1 1 1 1 0.78 1 0.87 1 0.87 1 1 1 0.87 1; 1 0.87; 0.44 1; 1 0.44; 0.15 1; 1 1; 1 1; 1 0.44; 0.15 1 0.26 1 0.87 1 1 1 0.87 1, 1 0.87, 0.44 1 0.66 0.75 0.71 0.75 0.47 0.25 0.53 0.25 0.53 0.88 0.37
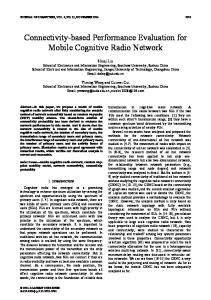
5. Experiments and Conclusion We use the protocol to evaluate some typical cases of segmentation errors, illustrated in figures 2 and 3. We calculate the charboxes of ground truth characters if we know only the font size, skew, orientation, and location. The bounding boxes of ground truth strings are calculated as the union of their charboxes. The performance evaluation result is shown in Table 1, in which the attributes and their detection performance of both the ground truth and the segmentation, at both the charbox level and the textbox level, are listed.
1= (a)
(b)
(c)
W AB (d)
(e)
(f)
Figure 3. Illustrations of some missegmentation cases.
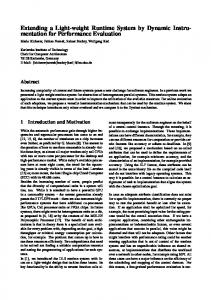
We have also used the protocol to automatically evaluate the text segmentation performance of MDUS [13] with four big test drawings, one of which is shown in Figure 4. The original image and the ground truth textbox data are obtained from the web site of the graphics recognition contest [14]. The evaluation results are listed in Table 2. Table 2. Text segmentation performance of MDUS as evaluated using the protocol. Drawing Type Mechanical Architectural Utility Figure 4
Size 7200X5595 7200X4910 7200X4936 7200X4692
# of True # of Detected Segmentation False Alarm TSI Textboxes Textboxes Rate (Eq. 19) Rate (Eq. 24) (Eq. 25) 92 143 0.67 0.45 0.61 202 223 0.71 0.41 0.65 498 610 0.54 0.61 0.46 221 290 0.70 0.47 0.61
As we show in Table 1, the protocol is comprehensive in the sense of both the character set and the segmentation performance indices. It covers all characters that may appear in this kind of document and consists of many indices from a variety of aspects. Experiments also show that the performance index set is objective and comprehensive, compatible with human vision evaluation, as shown in Table 2. That is, that performance value that is given to a segmentation result by this protocol is approximate to the value that a human professional or a group would give to the same segmentation result. Although the values may be differently given by different professionals, the difference should be small. For instance, if one evaluate a result as good, the protocol should give the evaluation value of around 0.8. From Table 2, which shows that the average TSI of the four test drawings is about 0.6, we know that the text segmentation performance is merely fair. However, further research and experiments are still needed to fine tune the parameters involved so that it can be widely used as a standard performance evaluation protocol for text segmentation algorithms.
(a)
(b) Figure 4. A test drawing used for performance evaluation of the text segmentation of MDUS. (a) original image. (b) text segmentation of MDUS.
References [1] Haralick, “Performance Characterization in Image Analysis—Thinning, a Case in Point”, Pattern Recognition Letters 13:5-12, 1992.
[2] Lee, L. Lam, and C.Y. Suen, “Performance Evaluation of Skeletonization Algorithms for Document Image Processing”, In: Proc. of the first International Conference on Document Analysis and Recognition, Saint-Malo, France, pp 260-271, 1991. [3] Lam, and C.Y. Suen, “Evaluation of Thinning Algorithms from an OCR Viewpoint. In: Proc. of the second International Conference on Document Analysis and Recognition, Tsukuba, Japan, pp 287-290, 1993. [4] Jaisimha, R.M. Haralick, and D. Dori, “A Methodology for the Characterization of the Performance of Thinning Algorithms”, In: Proc. of the second International Conference on Document Analysis and Recognition, Tsukuba, Japan, pp 282-286, 1993. [5] Cordella and A. Marcelli, “An alternative Approach to the Performance Evaluation of Thinning Algorithms for Document Processing Applications”, In: Kasturi R, Tombre K (eds) Graphics Recognition -- Methods and Applications (Lecture Notes in Computer Science, vol. 1072), Springer, Berlin, pp 13-22, 1996. [6] O. Hori, D.S. Doermann, “Quantitative Measurement of the Performance of Raster-to-Vector Conversion Algorithms”, In: Kasturi R, Tombre K (eds) Graphics Recognition -- Methods and Applications (Lecture Notes in Computer Science, vol. 1072), Springer, Berlin, pp 57-68, 1996. [7] B. Kong, I.T. Phillips, R.M. Haralick, A. Prasad, R. Kasturi, “A Benchmark: Performance Evaluation of Dashed-Line Detection Algorithms”, In: Kasturi R, Tombre K (eds) Graphics Recognition -- Methods and Applications (Lecture Notes in Computer Science, vol. 1072), Springer, Berlin, pp 270-285, 1996. [8] Liu W. and D. Dori, “A Protocol for Performance Evaluation of Line Detection Algorithms”, Machine Vision Applications, Special Issue on Performance Characterisitics of Vision Algorithms, 9(5):240-250, 1997. [9] L.A. Fletcher and R. Kasturi, “A Robust Algorithm for Textbox String Separation from Mixed Text/Graphics Images”, IEEE Trans. PAMI, 10(6):900918., 1988 [10] I. Chai and D. Dori, “Extraction of Text Boxes from Engineering Drawings”, Proc. SPIE/IS&T Symposium on Electronic Imaging Science and Technology, Conference on Character Recognition and Digitizer Technologies, San Jose (CA, USA), SPIE Vol. 1661, pp 38-49, 1992. [11] Gao J., Tang L. Liu W. and Tang Z., “Segmentation and Recognition of Dimension Texts in Engineering Drawings”, ICDAR’95, Montreal, Canada, pp 528-531, 1995. [12] D. Dori and Liu W., "Vector-Based Segmentation of Text Connected to Graphics in Engineering Drawings", Advances in Structural and Syntactical Pattern Recognition, eds. P. Perner, P. Wang, and A. Rosenfeld, Lecture Notes in Computer Science, vol. 1121, pp 322-331, Springer, 1996. [13] Liu W. and D. Dori, “Automated CAD Conversion with the Machine Drawing Understanding System”, Proc. DAS96, Malvern, PA, USA, October, pp 241259, 1996. [14] http://graphics.nynexst.com/iapr-tc10/contest.html