Existing QoS metrics can only be used for wireless sensor networks when the .... diate nodes of both the sender and the receiver go to sleep after they hear the ...
First ACM/IEEE International Conference on Distributed Smart Cameras, ICDSC '07. Vienna, Austria, 25-28 Sept. 2007
A QOS EVALUATION TESTBED FOR MAC PROTOCOLS FOR WIRELESS CAMERA NETWORKS Paul J. Shin, Johnny Park and Avinash C. Kak School of Electrical and Computer Engineering, Purdue University {paulshin,jpark,kak}@purdue.edu ABSTRACT Existing QoS metrics can only be used for wireless sensor networks when the capability of sensor nodes is limited to making simple measurements such as temperature, pressure, etc. These metrics do not capture the communication patterns encountered when sensing is more elaborate, as in wireless camera networks where the need for distributed computation of image data may result in highly bursty communications among the nodes in a cluster. Whether or not a wireless camera network can successfully engage in, say, an object tracking task depends on whether the MAC protocol allows for these communication patterns to succeed with high reliability. Our testbed characterizes a MAC protocol on the basis of the following three criteria: time-bounded parameter-estimation accuracy (TIBPEA), latency, and energy efficiency. (An example of TIBPEA would be the precision with which an object can be located in space in a time-bounded manner by a cluster of nodes in the presence of bursty communications entailed by collaborative computing.) Our testbed simulator models bursty communications by enhanced data broadcast rates as needed by a vision task. Our paper includes characterization of a well-known MAC protocol. Index Terms— Wireless sensor networks, Wireless camera networks, MAC, QoS, Testbed, Evaluation 1. INTRODUCTION It is now common knowledge that in addition to the more traditional criteria such as bandwidth utilization, throughput, fairness, etc., energy efficiency must play a central role in the performance evaluation of a wireless sensor network (WSN). However, it is somewhat less commonly recognized that, even after paying due regard to energy efficiency, we do not yet have an adequate framework for the performance evaluation of wireless camera networks (WCNs). Whereas the nodes in a WSN devoted to making simple measurements of the environment can operate independently as far as the basic measurements are concerned, the nodes in a WCN may have to collaborate to estimate the various attributes of the objects of interest in order to surmount the extremely limited computational power available at the individual nodes. The collabc 1-4244-1354-0/07/$25.00 2007 IEEE
orative processing that WCN nodes engage in is carried out with the help of clusters. That is, the nodes are allowed to form clusters with the expectation that it is the cluster as a whole that would “understand” an object in the environment. Clusters will usually elect cluster leaders in order to reduce the communication requirements when the network is either fielding a human query or when a cluster is communicating with another cluster. The following computations are typical of this cluster based approach to collaborative sensing by the nodes of a network [28]: 1) cluster formation; 2) cluster leader election; 3) cluster propagation, with cluster leader re-election whenever necessary; 4) estimation of the properties of the objects of interest collaboratively; etc. All of these phases of cluster based computing require highly bursty communications. Focusing on the fourth category listed above, consider for example the case where a cluster is trying to estimate a color histogram for an object that is visible to all the members of the cluster, our goal being for the sensor network to track the object. The cluster leader may assign the different bins of the histogram to the different members in the cluster and request that each member transmit the bin counts back to the leader. As each cluster member finishes its assigned task, all of the members trying to reach the cluster leader at approximately the same time with their bin counts would result in a burst of communication activity, with attendant packet collisions and wasted energy. The communication pattern among the cluster members would probably become even more vulnerable to effects such as the hidden terminal problem if the members collaborate in a distributed execution of a more sophisticated computer vision algorithm (as in the distributed implementation of, say, a Kalman filter). As to what balance should be achieved between the computing that can be carried out at each node and the computing that must be carried out in a distributed manner amongst all of the cluster members depends a great deal on the characteristics of the MAC protocol used. A MAC protocol with high latency and low reliability would make it more difficult to create a distributed implementation of a vision algorithm; such a protocol would require much local processing at each node in order to reduce the communication overhead. With low latency and high reliability, on the other hand, distributed
computing and data aggregation would become more feasible. (In comparing distributed implementations with those that are local-processing intensive, we must bear in mind the energyinefficiencies introduced if a distributed algorithm requires a high communication overhead.) It is obvious that the QoS for a MAC protocol intended for a WCN must use different evaluation criteria vis-a-vis the QoS for non-camera wireless networks. As a step in that direction, this paper adds an additional evaluation criterion, time bounded parameter estimation accuracy (TIBPEA), to the more traditional QoS criteria of latency and energy efficiency for determining the suitability of a MAC protocol for a WCN. TIBPEA refers to the precision with which a vision task can be completed by a node cluster in a time-bounded manner in the presence of bursty communications entailed by collaborative computing amongst the cluster members. Obviously, the new QoS evaluation measure we have introduced, TIBPEA, is application specific. But, we believe, that that is the way it should be. It would be much too naive to assume that a WSN designed for keeping track of suspects in a crowded marketplace would work equally well for keeping tracking of high-speed traffic at a busy interchange. That is, the evaluation of a WSN must be specific to a category of applications and the research community must specify a suite of vision tasks for measuring the QoS for each category. For the research we report in this paper, we have chosen the vision application of tracking simple objects that are moving in a space. The objects are simple in the sense that each can be characterized with a color histogram. Since our goal is the construction of an evaluation testbed, it is important that the object detection/recognition criteria and the object motions be all computer simulatable. That is what we have done in the testbed simulator. As we will report in Section 4, we have used our testbed simulator to characterize SMAC protocol [1] with regard to its suitability for WCNs. 2. RELATED WORK The fundamental task of MAC protocols is to control how nodes access a shared radio channel (medium) to communicate with neighboring nodes. Among many attributes of wireless MAC protocols, energy efficiency has been considered to be of primary importance for obvious reasons. There are four major sources of energy waste in a WSN: collision, overhearing, control packet overhead, and idle listening. All packets that are corrupted by collision have to be discarded and retransmission of such packets leads to energy waste. Collisions also increase the latency between the nodes. Overhearing occurs when nodes receive packets that are not meant for them. Excessive control packet overhead (e.g., handshake messages) can also be a source of energy waste. Finally, idle listening — a node listening to an idle channel in order to receive potential packets — is yet another source of energy
waste. It has been reported [15, 16] that the power required for idle listening amounts to 50%-100% of the power required for receiving actual packets. 2.1. MAC Protocols for Wireless Sensor Networks In general, MAC protocols for WSNs can be classified into two categories: schedule-based and contention-based. We will now review them very briefly. 2.1.1. Schedule-Based MAC protocols The MAC protocols for mobile cellular phones such as TDMA and CDMA are examples of schedule-based protocols, and they are mainly based on scheduling and reservation. These protocols have an inherent advantage in energy conservation. They divide a channel and allocate the slots to each node. Since each node exclusively occupies its own slot, there is no contention; so, in theory, no collision should occur. In practice, however, collisions may occur due to clock drifts among the nodes that could create overlaps in the time slots. In general, collisions are much less likely to occur in schedule-based MAC protocols than contention-based MAC protocols, which leads to enhanced overall network performance. Also, schedule-based MAC protocols implicitly address idle listening avoidance, which is one of the most critical issues in WSNs. However, schedule managing tasks are not easy, especially when network topologies vary. For example, when nodes are added to or removed from the network, TDMA protocol must change its frame length and time slot assignment. Moreover, it is difficult to adapt time schedules under variable load situations, and the slot assignments may require a significant amount of memory. In TDMA protocols like LEACH [6] and Bluetooth [7], real communication clusters between nodes are formed. The cluster leaders are responsible for creating and maintaining a TDMA schedule and long range transmission; however, the initial setup and maintenance of the clusters and their inter-communication schedules without interference are not easy tasks.
2.1.2. Contention-based MAC protocols In contention-based MAC protocols, each node that has data to transmit tries its luck by competing with its neighbors for the medium. These MAC protocols can be divided roughly into two categories: with and without periodic wakeup scheme. CSMA [8] is an example of a contention-based MAC protocol without a periodic wakeup scheme. In CSMA, when a node gets data to transmit from its upper layer, it listens for a carrier wave before attempting to transmit. If medium is busy, it waits for the transmission in progress to finish and starts to try to send a packet by performing carrier sensing again.
of a message to be sent consecutively without interference by transmission from other nodes. Because a whole message is meaningful, it is desirable to aggregate the fragments of a message first, although neighboring nodes may wait for a long time which may decrease fairness between nodes.
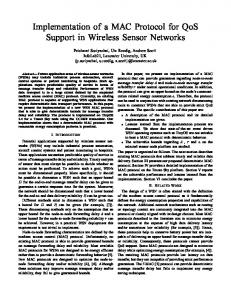
Fig. 1. Periodic sleep schedule of SMAC: To reduce the energy consumption in idle listening, it alternates the mode of nodes between sleep and listen periodically. By coordinating sleep schedules, it is possible for nodes to have duty cycles of 1-10%. A node operating at 50% duty cycle sleeps for 50% of a frame length, where a frame consists of a listen period followed by a sleep period.
In variants of CSMA, nodes are desynchronized by a backoff algorithm or by the introduction of a random delay with the others. While the CSMA protocol has a high throughput efficiency, it is susceptible to the hidden-terminal problem [10] since the transmitter cannot predict interference at the receiver. This may cause unforeseen packet collisions. MACA [9] and MACAW [10] are based on the CSMA protocol and are designed specifically to reduce the probability of occurrence of the hidden-terminal problem by adopting a RequestTo-Send/Clear-To-Send (RTS/CTS) handshake scheme. PAMAS [11] combines the busy-tone solution using two channels with RTS/CTS scheme to avoid overhearing and to solve the hidden-terminal problem. However, it does not consider the idle listening problem, which is a dominant cause of energy waste. S-MAC reduces energy consumption by adopting a periodic wakeup scheme to achieve low duty cycle operation. It has four major components to save energy: coordinated scheduling, collision avoidance, overhearing avoidance, and message passing. By exchanging the schedules of nodes, it achieves schedule synchronization between neighboring nodes and eventually forms virtual clusters which share a same schedule. Thus, it is possible for nodes to have duty cycles of 1-10% by coordinating sleep schedules (Figure 1). Since each node sleeps periodically according to its schedule, it is inevitable that a response from a node will entail some delay; this causes what is referred to as multi-hop latency in the overall network. S-MAC introduces adaptive listen to improve this latency. The basic idea is that if a node overhears the transmission of its neighbors, then it wakes up at the end of the transmission. S-MAC avoids collisions similar to IEEE 802.11 [13] using both physical carrier sensing and virtual carrier sensing, that is, RTS/CTS exchange for the hidden terminal problem. To avoid overhearing, S-MAC lets all immediate nodes of both the sender and the receiver go to sleep after they hear the RTS or CTS until the transmission is over. Further reduction in message-level latency can be achieved by using a message passing algorithm that allows the fragments
2.2. Communication traffic model Bursty communication traffic, which would be entailed by collaborative computing by the cluster members in a WCN, has been modelled in various ways. The bursty traffic model for 802.14 performance evaluation [18] was based on a message generation model in which the size of a message and the probability of its occurrence were considered to be Poisson distributed, as in [22]. Uysal et al. [19] used Poisson statistics to model the arrival times for bursty communications in a WSN (although they did express misgivings about the appropriateness of this assumption). Antunes et al. [20] proposed a novel traffic model by taking a Markov renewal process as the model for user mobility in cellular multimedia wireless networks and by taking a Markov modulated fluid process as the model for its teletraffic component during its calls and in inactive mode. However, this may not be a suitable model for WCNs if the cameras involved are relatively stationary.
2.3. Performance evaluation MAC protocols for WSNs have been evaluated with regard to various attributes in common sensor network topologies, such as star or peer-to-peer topology as supported by IEEE 802.15.4 [25]. Lu et al. [21] presented a comparison of energy consumption between beacon-tracking and non-tracking modes in IEEE 802.15.4 in a star-topology network; they showed how energy consumption in such networks depends on duty cycles and data rates in both these modes. They used the following performance metrics: energy, latency, throughput, and delivery ratio. However, the conclusions drawn by these authors does not apply to WCNs because their data generation model does not represent bursty communications. Bianchi et al. [22] analyzed the throughput and access delay of the IEEE 802.11 MAC protocol as a function of various contention windows. Their QoS evaluation metrics were the prioritization capabilities of the several MAC operation modes, including network utilization, latency and throughput. He et al. [24] presented a novel way to achieve energy efficiency in an WSN for an object tracking system using a sentry-based power management. They claim that the precision in the location estimate and the latency in reporting an event to the base station are important QoS metrics for the specific application of tracking performance.
Device/Mode CPU Active Idle
Power
Device/Mode
Power
24.0 mW 9.6 mW
Radio Rx / Listen Tx @ Max Tx time
21.0 mW 64.5 mW 208 µs/Byte
Table 1. Power consumption and operating modes at Mica2 motes [26, 27].
Fig. 2. Sensory processing state transition diagram at a camera node for tracking objects
3. QUALITY OF SERVICE FOR WCNS Consider how a laboratory-based WCN could track simple objects moving about in its environment. Regardless of the specifics of the vision algorithms used, Figure 2 is good depiction of how a cluster of nodes working cooperatively would go about first detecting and then confirming the presence of an object in the portion of that space that all the cameras in the cluster can see. We can consider Figure 2 to be a general state transition diagram that could be instantiated for any specific vision algorithm. To drive home the point about the usefulness of this state transition diagram, let’s briefly consider how the diagram would work for the specific case when a histogram based approach is used for object detection, recognition, and localization. The cluster leader could, for example, assign a certain number of histogram bins to each of the cluster members; the responsibility of each cluster member would be ascertain the counts in the bins assigned to it and then to report those counts to the cluster leader. Each member would be asked to report whatever results it has accumulated in a designated interval of time ∆. After the interval ∆ has elapsed, the cluster leader will use whatever counts it has obtained from the members and compute the “center of mass” of the image on the basis of the histogram counts; this center of mass would correspond to the position of the target. In the state transition diagram shown above, for this specific collaborative vision process, State 1 corresponds to capturing the image periodically at each member node and State 2 to applying a threshold to the image at each member node. State 2 would also consist of accumulating the counts in the bin assigned to the cluster member; if the bin counts are below a threshold, the node assumes that there does not exist any-
thing of statistical significance to report for that bin. State 3 would consist of reporting the results accumulated to the cluster leader. States 4 would apply only to the cluster leader; these states would enable the leader to collect the bin counts from the cluster members. What is interesting is that the state transition diagram in Figure 2 is general enough to also represent a cluster head election process and to represent the idle state of a node if nothing statistically significant can be detected by the camera at the node. Let’s first talk about the idle state. This is the state when the target cannot be discerned in the image recorded at a node. Obviously, in this state, the node will keep on capturing images and continue to stay in the idle state. Equally obviously, there will be no collaborative computing involving a node that is in the idle state. Regarding head election, initially all nodes that can discern an object features in their images would try to be cluster leaders. Every prospective cluster leader sends a message to the other members in its cluster about its leadership role. The actual leadership is acquired by the member who is the first at the inter-cluster communications. Mapping this process to the state transition diagram, State 3 corresponds to a member telling all other members that it has seen the object. State 4 in this case would entail each member relinquishing its leadership role to the member that was the first to broadcast its object detection. Obviously, these messages must be received within the timeout period shown in the diagram. Recognizing that it would be impossible to create a truly application independent state transition diagram for the vision processes that one may wish to implement for collaborative computing in a WCN, we nonetheless wish to claim that the diagram of Figure 2 is of broad enough generality and that we may use it as a basis for creating a bursty communication model that would typify cluster-based processing of image data in such networks. We also use this state transition diagram to define the following QoS metric: Time-Bounded Parameter Estimation Accuracy (TIBPEA). As to the parameter that should become the focus of this accuracy, we leave that to the user of this metric. The choice of the parameter would depend on what a WCN is being used for. If suppose a WCN is being used for tracking targets, then the accuracy achieved would concern target localization assuming that it is moving at a certain speed and that a node cluster (as it is propagating with the target) has only limited time to make inferences
Fig. 3. Object Movement: An object moves inside the network along a circular path in our experiments. about the target. While TIBPEA applies straightforwardly at a high-level in the manner explained, it is possible to create a purely communication version of this metric by defining it as the rate of successful internode message exchange within a specified time period. Obviously, the greater the reliability with which the cluster members can communicate with each other, the greater the accuracy of any parameter that must be computed collaboratively. When defined in this manner, TIBPEA is computed by the average percentage of neighbors that successfully reply to the broadcast messages in State 3 of the state transition diagram within a certain timeout period. In addition to TIBPEA, we use the traditional metrics of latency and energy efficiency. Latency in WSNs typically means the delay elapsed between the time at which a node of the network senses an event and the time at which a basestation or a data collecting sink retrieves the message. The latency in our work is similar, but only considers the latency of internode communication within a cluster. That is, the latency is defined as the interval between the time a cluster leader detects a target object and the time the cluster leader completes the data aggregation from the neighbors, either by receiving messages from all the neighbors or by the timeout. In Figure 2, the latency corresponds to the time required to complete State 3 and 4. Finally, a conventional approach is used to measure the energy efficiency. We keep track of the amount of time that each node has spent in different modes of CPU and radio, and multiply the time by the corresponding power consumption rate as shown in Table 1. The energy efficiency is simply the average of the total power consumption. 4. EXPERIMENTAL RESULTS We now present the experimental results. We have chosen to characterize SMAC protocol [1] with regard to its suitability for WCNs using the proposed evaluation metrics. The testbed used in our simulation experiments consists of a network of 100 wireless camera sensor nodes arranged in a 10 by 10 grid as shown in Figure 4. Each node is assumed to be equipped
Fig. 4. Network Topology: The topology consists of 100 nodes forming a 10×10grid. The inter-node distance is same, and the neighbors of a node consist of the four nearest nodes. The blue and red solid circles indicate the transmission range of each blue and red nodes, and the dotted rectangles the view-range of each node, respectively.
with a Cyclops camera sensor [14] attached on a Mica2 mote [5]. The transmission range of Mica2 motes is set to 18m, but note that the signal interference from a broadcasting mote can reach up to approximately 22m. All nodes are assumed to be mounted on a ceiling with camera sensors viewing downwards. The field of view of each camera sensor is set to cover a 16m × 16m square area on the ground.1 A target object moves on the ground along a circular path inside the network with varying speeds between 3 to 7 meters per second. The simulation software was developed using nesC [4] on top of TinyOS [3], and the testbed was simulated using Avrora [12]. During each experiment, all nodes simply carry out the tasks described in the state transition diagram in Figure 2. We assume that the object can be detected by a node as long as the object is within the field of view of that node (i.e., no false-positive detections). We have performed three sets of experiments by varying the inter-node distance (12m, 9m and 6m). The inter-node distance (or the density of the network) affects the number of neighboring nodes within a communication range (i.e., the larger the inter-node distance, the fewer the number of neighbors within radio range) and the number of nodes that can view the target at the same time (i.e., the larger the inter-node distance, the fewer the number of nodes that can see the target at the same time). In each set of exper1 These parameters are obviously meant for an outdoor application of a camera network. With these parameter values, it is easier to study the effect of node density on TIBPEA. With indoor parameters typical of a laboratory, all the nodes will be within the broadcast range of any given node. Obviously, that circumstance can be simulated for the outdoor parameters by simply bringing the nodes closer together. However, if we started out with typical indoor parameters, it would be more difficult to simulate the opposite condition of sparse node densities and still have the cameras with overlapping fields of view. Having said that, please note that the TIBPEA values one obtains for indoor parameters are comparable to those for the outdoor parameters. We will show one sampling of the results specifically obtained for indoor parameters toward the end of this section. Note that all of the results in this section were obtained with the Avrora simulator.
(a)
(b)
(c)
Fig. 5. (a) Average TIBPEA for a simulated object-tracking experiment for inter-node distance values of 12m, 9m, and 6m, respectively, from left to right; (b) Average latency for the three inter-node distance values; and (c) Energy consumption per node as a function of timeout interval.
iments, we analyzed the three evaluation metrics mentioned earlier, namely TIBPEA, latency and energy consumption, as a function of timeout interval. The results are shown in Figure 5. The graphs in the first column correspond to the results when the inter-node distance in the network was set to 12m, the second column 9m, and the third column 6m. The graphs in the first row show the TIBPEA as a function of the timeout. The graphs in the top row show that as duty cycle increases, TIBPEA also increases in all conditions. We can also see that as a network becomes denser, TIBPEA decreases for the same duty cycle. This happens because of higher rates of communication failures caused by severe contention in dense networks. The decrease of the converge The graphs in the second row depict the relationship between the duty cycle and latency. As the duty cycle increases, the latency decreases, as depicted by the graphs. The graphs in the last row show the relationship between the energy consumption and the timeout bound. As can be seen from the graphs, the energy efficiency is relatively independent of the timeout bound. These figures also show how the energy efficiency decreases markedly as the duty cycle increases. Note that each curve in each of the graphs is for a different duty cycle. Finally, as promised earlier in the footnote, we present a sampling of the simulation results for experimental parameters more appropriate for an indoor deployment of a camera network. These are shown in Figure 6. The ratio of the internode distance to the camera field-of-view for Figure 6 is the same as for the middle graph of the top row of Figure 5. The two sets of results are obviously comparable. 5. CONCLUSION Much previous work has focused on devising QoS metrics for WSNs. But WCNs impose constraints that go beyond those that have been considered by other researchers for WSNs. In particular, WCNs require much cluster-based computing of image data since no node will have sufficient computing power to draw all the inferences locally. The contribution of our work is to present a general state transition diagram that can represent many different cluster-based computing operations at each node and then to use this diagram as a basis for a communication model appropriate for a WCN. We reported on an Avrora based testbed simulator that used this communication model. We also proposed a new QoS metric for WCNs: Time-Bounded Parameter Estimation Accuracy (TIBPEA). TIBPEA derives its power from its ability to capture application-level errors in the presence of communication failures. What makes TIBPEA convenient to use is that, by definition, the communication-failure induced applicationlevel errors must strongly correlate with successful internode communications. What that implies is that TIBPEA can be measured directly by the rate of successful internode communications within the framework of a state transition diagram
Fig. 6. Simulation result for experimental parameters more typical of an indoor deployment of a camera network. The plots shown are for: Inter-node distance = 1m, field-of-view of a node = 2m × 2m, object speed = 1m/s. that can serve as the needed communication model. 6. ACKNOWLEDGMENT This work was supported by Olympus Corporation. 7. REFERENCES [1] W. Ye, J. Heidemann, and D. Estrin, "An energyefficient mac protocol for wireless sensor networks," in Proceedings of the IEEE Infocom, USC/Information Sciences Institute. New York, NY, USA: IEEE, June, 2002, pp. 1567-1576. [2] J. Polastre , J. Hill , D. Culler, "Versatile low power media access for wireless sensor networks", in Proceedings of the 2nd international conference on Embedded networked sensor systems, November 03-05, 2004, Baltimore, MD, USA. [3] J. Hill, R. Szewczyk, A. Woo, S. Hollar, D. Culler, and K. Pister, "System architecture directions for networked sensors," in Proceedings of the 9th International Conference on Architectural Support for Programming Languages and Operating Systems, Cambridge, MA, USA, Nov. 2000, pp. 93-104, ACM. [4] D. Gay, P. Levis, R. Behren, M. Welsh , E. Brewer, D. Culler, "The nesC language: A holistic approach to networked embedded systems," Proceedings of the ACM SIGPLAN 2003 conference on Programming language design and implementation, June 09-11, 2003, San Diego, California, USA.
[5] http://www.xbow.com [6] W. Heinzelman, A. Chandrakasan, and H. Balakrishnan, "An Application-Specific Protocol Architecture for Wireless Microsensor Networks," IEEE Transactions on Wireless Networking, 1(4), pp. 660-670, 2002. [7] J. Haartsen. "The Bluetooth Radio System," IEEE Personal Communications, 7(1), pp. 28-36, 2000. [8] A. Woo and D. Culler, "A Transmission Control Scheme for Media Access in Sensor Networks," in Proceedings of the Seventh Annual International Conference on Mobile Computing and Networking 2001 (MobiCom), Rome, Italy, July 2001. [9] P. Karn, "A New Channel Access Method for Packet Radio," in Proceedings of the ARRL/CRRL Amateur Radio 9th Computer Networking Conference, pp. 134-140, September 1990. [10] V. Bharghavan, A. Demers, S. Shenker, and L. Zhang, "MACAW: A media access protocol for wireless lans," in Proceedings of ACM SIGCOMM, London, U.K., September 1994, pp. 212-225. [11] C. S. Raghavendra and S. Singh, "PAMAS - Power Aware Multi-Access Protocol with Signaling for Ad Hoc Networks," in ACM Computer Communication Review, 27, pp. 5-26, 1998. [12] B. Titzer, D. Lee, and J. Palsberg, "Avrora: Scalable Sensor Network Simulation with Precise Timing," in Proceedings of IPSN’05, Fourth International Conference on Information Processing in Sensor Networks, Los Angeles, 2005.
[17] G. Pottie and W. Kaiser, “Embedding the Internet: Wireless Integrated Network Sensors.” Communications of the ACM, 43(5), pp. 51-58, 2000. [18] IEEE Cable TV Protocol Working Group, “Performance Evaluation Process for MAC Protocols,” IEEE 802.14/96-083R3, March 1996. [19] E. Uysal-Biyikoglu, B. Prabhakar, and A. El Gamal, “Energy-efficient packet transmission over a wireless link,” IEEE/ACM Transactions on Networking, vol. 10, pp. 487-499, August 2002. [20] N. Antunes, A. Pacheco, and R. Rocha, “An integrated traffic model for multimedia wireless networks,” Computer Networks 38 (2002), pp. 25-41. [21] G. Lu et al., “Performance Evaluation of the IEEE 802.15.4 MAC for Low-Rate Low-Power Wireless Networks”, in Proceedings of EWCN’04, April 2004. [22] G. Bianchi, L. Fratta, and M. Oliveri, “Performance analysis of IEEE 802.11 CSMA/CA medium access control protocol,” in Proceedings of IEEE PIMRC Taipei, Taiwan, pp. 407-411, October, 1996. [23] A. Grilo, M. Nunes, “Performance Evaluation of IEEE802.11e,” in Proceedings of PIMRC 2002, vol.1, pp. 511-17, September, 2002. [24] T. He, S. Krishnamurthy , J. Stankovic , T. Abdelzaher , L. Luo , R. Stoleru , T. Yan , L. Gu , J. Hui , B. Krogh, “Energy-efficient surveillance system using wireless sensor networks,” in Proceedings of the 2nd international conference on Mobile systems, applications, and services, June, 2004.
[13] P802.11, IEEE Draft Standard for Wireless LAN Medium Access Control (MAC) and Physical Layer (PHY) Specifications, D2.0, July 1995.
[25] 802.15.4-2003 IEEE Standard for Information Technology-Part 15.4: Wireless Medium Access Control (MAC) and Physical Layer (PHY) specifications for Low Rate Wireless Personal Area Networks (LR-WPANS), 2003
[14] M. Rahimi, R. Baer, O. Iroezi, J. Garcia, J. Warrior, D. Estrin, M. Srivastava, “Cyclops: in situ image sensing and interpretation in wireless sensor networks,” in Proceedings of the 3rd international conference on Embedded networked sensor systems, November 2005.
[26] V. Ekanayake, C. Kelly IV, and R. Manohar, “An ultra low-power processor for sensor networks,” in Proceedings of the ACM Conference on Architectural Support for Programming Languages and Operating Systems (ASPLOS XI), pp. 27-36, 2004.
[15] M. Stemm and R. Katz, “Measuring and reducing energy consumption of network interfaces in hand-held devices,” IEICE Transactions on Communications, vol. E80-B, no. 8, pp. 1125-1131, August 1997. [16] O. Kasten. Energy consumption. Eldgenossische Technische Hochschule Zurich. [Online]. Available: http://www.inf.ethz.ch/~kasten/research/ bathtub/energy_consumption.html
[27] N. Chohan, “Hardware Assisted Compression in Wireless Sensor Networks,” [Online]. Available: www.cs.ucsb.edu/~nchohan/docs/HWACSN.pdf [28] H. Medeiros, J. Park, and A. Kak, “A Light-weight Event-driven Protocol for Sensor Clustering in Wireless Camera Networks,” in Proceedings of ACM/IEEE ICDSC’07, the first international conference on Distributed Smart Cameras, September, 2007.