of the samples were polished to a sufficiently smooth plane to .... Air Force Weapons Lab. Tech. Report, AFWL-TR 65-116,. Kirtland Base, New Mexico, 1966.
A quality classification of building stones from P-wave velocity and its application to stone cutting with gang saws by S. Kahraman*, U. Ulker†, and M. S. Delibalta‡
P-wave velocity measurements were carried out on 22 large limestone blocks in a stone processing plant. In the laboratory, Pwave velocity of core samples was measured to obtain intact rock velocity. The square root of the ratio of the velocity of the large stone block to the velocity of the core specimen was called the velocity ratio index (VRI) and a quality classification for large building stones was suggested. In addition, the applicability of the established classification to stone cutting with gang saws was checked. It was concluded that the quality classification and estimation of slab production efficiency of the building stones can easily be made by ultrasonic measurements. However, the study was carried out only in limestone. Further study must be conducted to check the validity of the obtained results for the other rock types.
Introduction Ultrasonic techniques are increasingly being used in in various fields such as mining, geotechnical, civil, and underground engineering, since they are non-destructive and easy to apply. These techniques are usually employed both in site and laboratory to characterize and determine the dynamic properties of rocks. Attempts have been made to assess grouting (Knill, 1970; Turk and Dearman, 1987), rockbolt reinforcement (Price et al., 1970) and blasting efficiencies in the rock mass (Young et al., 1985) by seismic velocity determination. The prediction of rock mass deformation and stress (Onodera, 1963; Gladwin, 1982), the determination of rock weathering degree (Karpuz and Pasamehmetoglu, 1997), rock mass characterization (Boadu, 1997; Turk and Dearman, 1986) and the estimation of the extent of fracture zones developed around underground openings (Hudson et al., 1980) are some other applications of the seismic techniques. Most researchers (D’Andrea et al., 1965; Deere and Miller, 1966; Youash, 1970; Saito et al., 1974; Gardner et al., 1974; Lama and Vutukuri, 1978; Inoue and Ohomi, 1981; Gaviglio, 1989; Yasar and Erdogan, 2004) studied the The Journal of The Southern African Institute of Mining and Metallurgy
Field studies The study was performed on a limestone
* Mining Engineering Department, Nigde University, Turkey † Kamer Mermer, Organize Sanayi, Turkey ‡ Vocational School of Adana, Cukurova University, Adana, Turkey. © The Southern African Institute of Mining and Metallurgy, 2007. SA ISSN 0038–223X/3.00 + 0.00. Paper was first published at the SAIMM Conference, Platinum Surges Ahead, 8–12 October 2006. VOLUME 107 REFEREED PAPER JUNE 2007
427
▲
Synopsis
relations between rock properties and sound velocity and found that sound velocity is closely related to rock properties. There are a number of factors that influence the sound velocity of rocks. The important factors are rock type, density, elastic properties, grain size and shape, porosity, anisotropy, porewater, confining pressure and temperature. Weathering and alteration zones, bedding planes and joint properties (roughness, filling material, water, dip and strike, etc.) have also an important influence on the sound velocity. Many different rocks are used as building stone in the construction industry. The fractures in a large stone block are the principle factor that determines its quality. The slab production efficiency of a stone block depends on the fractures in it. The quality determination of the building stones is very important for saving and planning of the stone processing plants. Generally, the quality determination of the building stones is still made by visual inspection and the risk of error is high. Outer fractures can be seen while the depth of outer fractures and the presence of inner fractures cannot be estimated by visual inspection alone. In this study, a quality classification of large building stones from P-wave velocity measurements was suggested and its application to the stone cutting with gang saws was presented.
T r a n s a c t i o n
P a p e r
A quality classification of building stones from P-wave velocity average of several calliper readings. The dry weight of the specimen was determined by a balance, capable of weighing to an accuracy of 0.01 of the sample weight. The density values were obtained from the ratio of the specimen weight to the specimen volume.
Table I
Average physico-mechanical properties of the tested rock Density (g/cm3)
Porosity (%)
Compressive strength (MPa)
Tensile strength (MPa)
P-wave velocity (km/s)
2.66
0.66
100.9
7.8
6.3
Porosity test
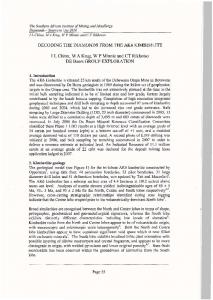
(Amasya Classical Beige) from Amasya (Turkey). The rock is of Jura-Cretaceous age and generally has no bedding. In a stone processing plant, P-wave velocity measurements were carried out on 22 large limestone blocks. The large limestone blocks had smooth surfaces since they had already been cut by diamond wire at the quarry. Each parallel side of the block was systematically marked with paint, as shown in Figure 1. The distance between each measuring point and between each row was 25 cm. Using a PUNDIT 6 instrument with exponential (conical) transducers, measurements were conducted. P-wave velocity values were calculated using the following formula: [1] where Vp is the P-wave velocity (km/s), d is the distance between transmitter and receiver, and tp is the time that the P-wave takes to travel the distance d. After the calculation of the P-wave velocity at each measuring point, the average value was recorded as the velocity of the block.
Laboratory studies To determine the physico-mechanical properties of the sawed rock, small block samples were collected from the site for the laboratory tests. Core samples were prepared from blocks and density, porosity, uniaxial compressive strength, tensile strength and P-wave velocity were carried out according to the standard methods (ISRM, 1981).
Density test Trimmed core samples were used in the determination of dry density. The specimen volume was calculated from an
Porosity values were determined using saturation and calliper techniques. Pore volumes were calculated from dry and saturated weights and sample volumes were obtained from calliper readings. The porosity values were obtained from the ratio of the pore volumes to the specimen volume.
Uniaxial compressive strength test Uniaxial compression tests were performed on trimmed core samples, which had a diameter of 38 mm and a length-todiameter ratio of 2. The stress rate was applied within the limits of 0.5–1.0 MPa/s.
Brazilian tensile strength test Brazilian tensile strength tests were conducted on core samples having a diameter of 38 mm and a height to diameter ratio of 1. The tensile load on the specimen was applied continuously at a constant stress rate such that failure would occur within 5 min of loading.
Ultrasonic test The P-wave velocity of intact rock was measured on core samples using the PUNDIT 6 instrument. Core samples had a diameter of 47.3 mm and a length of 94.5 mm. End surfaces of the samples were polished to a sufficiently smooth plane to provide good coupling. A good acoustic coupling between the transducer face and the rock surface is necessary for the accuracy of transit time measurement. Stiffer grease was used as a coupling agent in this study. Transducers were pressed to either end of the sample and the pulse transit time was recorded. P-wave velocity values were calculated using Equation [1]. The measurements were performed three times on the samples collected from the different locations of the quarry and average value was recorded as the P-wave velocity value. Average values of density, porosity, uniaxial compressive strength, tensile strength and P-wave velocity are given in Table I.
Classification method An index called a velocity ratio index (VRI) was defined from ultrasonic measurements on the stone block and intact rock specimen. VRI formulation is given below:
[2]
Figure 1—P-wave velocity measurements on large stone blocks
▲
428
JUNE 2007 VOLUME 107 REFEREED PAPER
where VRI is the velocity ratio index, VB is the velocity of the stone block, and VL is the velocity of the core specimen. VRI values range from 0 to 1. The block quality was divided into five categories according to VRI as shown in Table II. The Journal of The Southern African Institute of Mining and Metallurgy
A quality classification of building stones from P-wave velocity VRI is defined as the square root of the ratio between VB and VL instead of only the ratio between VB and VL to obtain conformity between the VRI index and observed slab efficiency. Let us explain this by an example: For block number 1 (Table III) the ratio between VB and VL is 0.44. If this block is classified according to the value of 0.44, the block quality will be poor. However, the observed slab efficiency of this block is 85.5% and this efficiency is not poor in practice. On the other hand, the square root of 0.44 corresponds to 0.66. For a VRI value of 0.66, the block quality will be fair and this will conform to practical applications.
Application of the classification method Using laboratory and block P-wave measurements, VRI values for each block were calculated from Equation [2]. Then, each block was classified according to Table II. VRI values and classification of each block are given in Table III. As shown in Table III, 4 blocks are very good quality, 4 blocks are good quality, 14 blocks are fair quality, and 1 block is poor quality. Gang or frame saws are extensively used for economical manufacture of slabs from quarried large blocks of soft stone, marble, travertine, limestone, etc. in stone processing plants (Figure 2). Cutting the 22 large limestone blocks with a gang saw was observed and the number of sound and broken slabs was recorded. After that, the efficiency of slab production for each block was calculated from the following formula: [3]
where s is the slab efficiency (%), Nis is the number of intact slabs cut from block, and Nts is the theoretical number of slabs that can be cut from the block. Slab efficiency values of the 22 large limestone blocks are given in Table III. As shown in Table III, the slab efficiency values range form 76.5% to 100%. To check the applicability of the classification method to stone cutting with a gang saw, VRI values of blocks and slab production efficiency values were evaluated using regression analysis and the correlation coefficient was determined. A strong correlation between VRI values and slab production efficiency values was found (Figure 3). The relation follows a logarithmic function and correlation coefficient (r) is 0.84. Slab efficiency increases with increasing VRI. The equation of the curve is SE = 26.96 ln(VRI) + 97.4
[4]
where SE is the slab efficiency (%) and VRI is the velocity ratio index. To see the estimation capability of Equation [2], the graphs of observed slab efficiency versus predicted slab efficiency were plotted. As shown in the Figure 4, the points are scattered uniformly about the diagonal line, suggesting that the model is reasonable.
Conclusions After laboratory and field studies, a quality classification of
Table III
Classification and slab efficiency of tested stone blocks Velocity ratio
Block quality
index (VRI)
Table II
Observed slab efficiency (%)
1
0.66
Fair
85.5
Quality classification of stone blocks
2
0.68
Fair
85.7
VRI
Block quality
3
0.71
Fair
87.0
0.90
Very good
8
0.66
Fair
90.8
9
0.77
Good
95.9
10
0.75
Good
88.2
11
0.91
Very good
92.1
12
0.99
Very good
100.0
13
0.77
Good
94.1
14
0.69
Fair
83.8
15
0.99
Very good
93.5
16
0.57
Fair
87.8
17
0.69
Fair
85.7
18
0.49
Poor
76.5
19
0.68
Fair
86.8
20
0.95
Very good
97.4
21
0.68
Fair
82.7
22
0.70
Fair
89.1
Figure 2—Gang saw during the cutting The Journal of The Southern African Institute of Mining and Metallurgy
VOLUME 107 REFEREED PAPER JUNE 2007
429
▲
Block no
T r a n s a c t i o n
P a p e r
A quality classification of building stones from P-wave velocity D’ANDREA, D.V., FISCHER, R.L. and FOGELSON, D.E. Prediction of compressive
110 Slab efficiency (%)
strength from other rock properties. U.S. Bureau of Mines Report of Investigations 6702, 1965.
100
DEERE, D.U. and MILLER, R.P. Engineering classification and index properties for
90
intact rock. Air Force Weapons Lab. Tech. Report, AFWL-TR 65-116, Kirtland Base, New Mexico, 1966.
80
GARDNER, G.H.F., GARDNER, L.W. and GREGORY, A.R. Formation velocity and
70
density: The diagnostic basis for stratigraphic. Geophysics, 1974, vol. 39,
y = 26.96Ln(x) + 97.4 r = 0.84
60 50 0.30
pp. 770–780. GAVIGLIO, P. Longitudinal waves propagation in a limestone: The relationship
0.40
0.50
0.60
0.70
0.80
0.90
1.00
between velocity and density. Rock Mech. Rock Eng., 1989, vol. 22, pp. 299–306.
Velocity ratio index
GLADWIN, M.T. Ultrasonic stress monitoring in underground mining. Int. J. Rock Mech. Min. Sci., 1982, vol. 19, pp. 221–228.
Figure 3—The correlation between velocity ratio index and slab efficiency
HUDSON, J.A., JONES, E.T.W. and NEW, B.M. P-wave velocity measurements in a machine bored chalk tunnels. Q. J. Eng. Geol., 1980, vol. 13, pp. 33–43. INOUE, M. and OHOMI, M., Relation between uniaxial compressive strength and
Estimated slab efficiency (%)
110
elastic wave velocity of soft rock. Proc. Int. Sym. on Weak Rock, Tokyo, 1981, pp. 9–13.
100
ISRM. Brown, E.T. (ed.) Rock characterisation testing and monitoring.
90
Pergamon Press, 1981. ˇ , A.G. Field characterization of weathered KARPUZ, C. and PASAMEHMETOGLU
80
Ankara andesites. Eng. Geol., 1997, vol. 46, pp. 1–17.
70
KNILL, T.L., The application of seismic methods in the interpretation of grout takes in rock. Proc. Conf. on in situ Investigation in Soils and Rocks,
60
British Geotechnical Society, no. 8, 1970, pp. 93–100. LAMA, R.D. and VUTUKURI, V.S. Handbook on mechanical properties of rocks.
50 50
60
70
80
90
100
110
Observed slab efficiency (%)
Trans. Tech. Publ., Edn. 2., 1978. ONODERA, T.F. Dynamic investigation of foundation rocks, in situ. Proc. 5th Symp. Rock Mech., Minnesota, Pergamon Press, New York, 1963,
Figure 4—Estimated slab production versus observed slab production
pp. 517–533. PRICE, D.G., MALONE, A.W. and KNILL, T.L., The application of seismic methods
large building stones from P-wave velocity measurements was established and its application to the stone cutting with gang saw was presented. A concluding remark is that the quality classification and estimation of slab production efficiency of the building stones can be made by ultrasonic measurements. The method is cheap and easy to apply. However, the validity of the obtained results for the other rock types must be checked further. In addition, investigating the possibility of improving the study by describing the orientations or positions of the cracks in the blocks may be another future study.
Acknowledgement This study has been supported by the Turkish Academy of Sciences (TUBA), in the framework of the Young Scientist Award Program. (EA-TUBA-GEBIP/2001-1-1).
in the design of rock bolt system. Proc. 1st Int. Congr., Int. Assoc. Eng. Geol, vol. 2, 1970, pp. 740–752. SAITO T., MAMORU, A.B.E. and KUNDRI, S. Study on weathering of igneous rocks. Rock Mech. in Japan, vol. 2, 1974, pp. 28–30. TURK, N. and DEARMAN, W.R. Assessment of grouting efficiency in a rock mass in terms of seismic velocities. Bull. Int. Assoc. Eng. Geol., 1987, vol. 36, pp. 101–108. TURK, N. and DEARMAN, W.R. A suggested approach to rock characterization in terms of seismic velocities. Proc. 27th US Symp. Rock Mech., Soc. of Mining Engineers, 1986, pp. 168–175. YASAR, E. and ERDOGAN, Y. Correlating sound velocity with the density, compressive strength and Young’s modulus of carbonate rocks. Int. J. Rock Mech. Min. Sci., 2004, vol. 41, pp. 871–875. YOUASH, Y. Dynamic physical properties of rocks: Part 2, Experimental result. Proc. 2nd Congr. Int. Soc. Rock Mech., Beograd, vol. 1, 1970, pp. 185–195.
References BOADU, F.K. Fractured rock mass characterization parameters and seismic properties: Analytical studies. J. Appl. Geophys, 1997, vol. 36, pp. 1–19.
▲
430
JUNE 2007 VOLUME 107 REFEREED PAPER
YOUNG, R.P., HILL, T.T., BRYAN, I.R. and MIDDLETON, R. Seismic spectroscopy in fracture characterization. Q. J. Eng. Geol., 1985, vol. 18, pp. 459–479.
◆
The Journal of The Southern African Institute of Mining and Metallurgy