CHINESE JOURNAL OF ANALYTICAL CHEMISTRY Volume 45, Issue 7, July 2017 Online English edition of the Chinese language journal
Cite this article as: Chin J Anal Chem, 2017, 45(7), 965–972.
RESEARCH PAPER
Laser Ablation-Inductively Coupled Plasma-Mass Spectrometer: A quantification Strategy Based on Two Reference Materials and Bulk Normalization as 100% (wt) WU Shi-Tou1,2, WANG Ya-Ping2,*, XU Chun-Xue2 1 2
Geowissenschaftliches Zentrum, Göttingen Universität, Göttingen 37077, Germany National Research Center of Geoanalysis, Beijing 100037, China
Abstract: Quantification strategy as an essential issue for laser ablation ICP-MS plays an important role in the guarantee of analytical accuracy. In this study, the reference value uncertainties of current available glass reference materials (including NIST, MPI-DING and USGS) as well as the matrix effects were systematically evaluated. The results illustrated that NIST610 was better than other glass reference materials from aspect of reference value uncertainty. The matrix effects among NIST, MPI-DING and USGS glasses were insignificant under the experimental conditions. The quantification strategy based on two reference materials (NIST610 and StHs6/80-G) and bulk normalization as 100 % (wt) was proposed to reduce the LA-ICP-MS generated transient signals, which eliminates the deficiencies encountered with the quantification strategy using single reference material, such as the extreme low content or large uncertainty of some elements. The comparison of ML3B-G results obtained from three quantification strategies (single reference material NIST610, single reference material StHs6/80-G and two reference materials) illustrated that the proposed strategy improved the analytical accuracy. Three reference materials including BCR-2G, CGSG-2 and KL-2G were quantified using the proposed strategy, and almost all data matched well with reference values. The data reported in this study could supplement the reference value database for BCR-2G, CGSG-2 and KL2-G. Key Words:
Laser ablation-inductively coupled plasma-mass spectrometer; Quantification strategy; Reference value uncertainty;
Matrix effect; Micro-analysis
1
Introduction
Laser ablation-inductively coupled plasma-mass spectrometer (LA-ICP-MS) as a crucial micro-technique for chemical analysis provides some advantages including high spatial resolution (μm scale), low detection limit (ng g–1) and rapid analysis (2 min per sample), and is widely used in analytical geochemistry[1‒4]. With the rapid development in instrument capability, more attention would be paid to this technique[5‒7]. Quantification strategy as an essential part for LA-ICP-MS could directly influence the data quality, and is an important research topic since the emergence of LA-ICP-MS[8,9].
Quantification strategy mainly includes three aspects that needs to be corrected and calibrated: ICP mass response (using a solid external reference material or solution calibration curve[10,11]), ablation mass amount during each analysis (based on a known internal standard [12] or bulk normalization as 100% (wt)[8]) and non-stoichiometric ablation behavior (matrix-matched calibration [13,14] or correction of elemental fractionation[15,16]). Currently available quantification strategies for LA-ICP-MS include single external reference material combined with internal standardization[12,17], single external reference material combined with bulk normalization as 100% (wt)[18‒20], single
________________________ Received 11 February 2017; accepted 12 May 2017 *Corresponding author. Email:
[email protected] This work was supported by the the Chinese Scholarship Committee (No. 201306410007) and the Chinese Academy of Geological Sciences Basic Research Funding Project (No.YYWF201622). Copyright © 2017, Changchun Institute of Applied Chemistry, Chinese Academy of Sciences. Published by Elsevier Limited. All rights reserved. DOI: 10.1016/S1872-2040(17)61023-5
WU Shi-Tuo et al. / Chinese Journal of Analytical Chemistry, 2017, 45(7): 965–972
external reference material combined with multiple internal standards[21], multiple external reference materials without internal standards method[8], etc. The strategy of single external reference material combined with internal standardization was described by Longerich et al[12]. This strategy is simple and practical. However the concentration of internal standard should be known prior to LA-ICP-MS analysis, which led to complex procedure and increase of the cost. Bulk normalization as 100% (wt) combined with a single external reference material was proposed to correct the ablation mass amount during each analysis, and quantification could be achieved without knowing concentration of internal standard. By using this strategy, Guillong et al[18] successfully quantified GSA-1G, GSC-1G, GSD-1G and GSE-1G. However the quantification strategy by using a single reference material has the deficiencies including extremely low content or large uncertainty for some elements in calibrated material. Jackson et al[21] observed a linear relationship between elemental fractionation and analytical accuracy, and proposed the quantification strategy based on multiple internal standards. This strategy improved the accuracy of elements (like Pb and Zn) that were heavily affected by elemental fractionations, while recent studies[22,23] demonstrated the elemental fractionations induced by 193-nm ArF excimer laser were insignificant. The quantification strategy by using multiple external reference materials without internal standardization was reported by Liu et al[8]. This approach could correct the ablation mass amounts based on bulk normalization as 100% (wt) combined with multiple external reference materials. However the use of multiple reference materials would increase the analytical workload, and without using internal standardization, it may result in a poor precision. The reference value uncertainties of external reference materials directly influence the quality of analytical results[24], and it is controversial that whether there exist matrix effects among different glass substrates (synthetic glass and geological glass) or not[8,25‒28]. In this study, the reference value uncertainties of different glass reference materials were systematically evaluated, and the matrix effects among NIST, MPI-DING and USGS glasses were investigated. A quantification strategy based on two external reference materials (NIST610 and StHs6/80-G) and bulk normalization as 100% (wt) was proposed. The proposed quantification strategy could eliminate the deficiencies encountered with the strategy using single external reference material, such as non-matrix matching of NIST610 with geological glass and some elements with extreme low content or large uncertainty in StHs6/80-G. The comparison of the three quantification strategies (single reference material NIST610, single reference material StHs6/80-G and two reference materials) for quantifying ML3B-G was carried out. Three reference glasses including BCR-2G, CGSG-2 and KL2-G were quantified with the proposed strategy.
2
Experimental
2.1
Instrumentation
A 193-nm ArF excimer laser ablation system (RESOlution M-50, ASI, Australia) coupled to an Element 2 sector field ICP-MS (Thermo Scientific, USA) were used for the data acquisition. The instrumental conditions were optimized to achieve the highest 139La intensity while keeping the U/Th ≈ 1, oxide (ThO/Th) and secondary ion production (Ca2+/Ca+) < 0.5% by ablating NIST 612 in raster mode. The optimized instrumental conditions are summarized in Table 1. 2.2
Samples
The samples used in this study include NIST reference materials (NIST610 and NIST612), MPI-DING reference materials (ATHO-G, StHs6/80-G, T1-G, ML3B-G, KL2-G, GOR128-G and GOR132-G), CGSG reference material (CGSG-2) and USGS reference materials (BIR-1G, BCR-2G, BHVO-1G and GSD-1G). NIST612 was used for optimizing instrumental conditions. NIST610 and StHs6/80-G were used as external reference materials. In addition NIST610 was used for the correction of instrument drift. GSD-1G was used for data quality control. The reference values and uncertainties were citied from literatures[29,30] and GeoReM database[31] (http://georem. mpch-mainz.gwdg.de/). All the samples were mounted in the epoxy resin, and polished to a flatness surface (1 μm). The samples were cleaned with ethanol, and then dried using pressured N2 prior to LA-ICP-MS analysis. The analysis sequence is as follows: external reference material (NIST610), external reference material (StHs6/80-G), quality control sample (GSD-1G), unknown samples (10), external reference material (NIST610), external reference material (StHs6/80-G), quality control sample (GSD-1G), and unknown samples (10). Table 1 Operation conditions of LA-ICP-MS system Laser ablation system
ICP-MS
Laser type
ArF Excimer
ICP-MS
Element 2
Wavelength
193 nm
RF Power
1500 W
Pulse width
20 ns
Energy density
3.0 J cm‒2
Frequency
5 Hz
Ablation cell
Laurin Technic S-155
Spot size
50 μm
Ablation flow
gas
Ablation time
Guard electrode Coolant gas flow Auxiliary gas flow Carrier gas flow Segment duration
Floated 15.00 L min‒1 1.00 L min‒1 0.95 L min‒1 10 ms
0.65 L min‒1
Detector
Counting and analog
35 s
Resolution (M/∆M)
Low (~300)
WU Shi-Tuo et al. / Chinese Journal of Analytical Chemistry, 2017, 45(7): 965–972
2.3
Quantification strategy
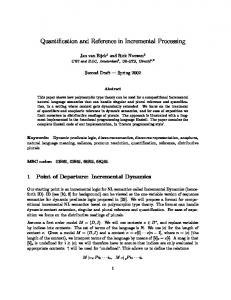
The approach of bulk normalization as 100% (wt) allows quantification without knowing the concentration of internal standard, which simplifies the analytical procedure. The prerequisite for the application of bulk normalization as 100% (wt) is to accurately analyze as more elements as possible, which could reduce the uncertainties introduced by the bulk normalization. In this study, 51 elements were measured except halogen and platinum group metals. The sum of elemental oxides is>99% (wt) (Table 2). The element concentrations need to be conversed to oxide concentrations (by multiplying oxide coefficient). The assumption of valence state for the elements having multiple valence, especially with high concentration (> 1%), may influence the bulk normalization. Here we assumed Fe2+/Fe3+ = 1. The implementation of the proposed strategy incorporates two steps. (1) With StHs6/80-G as external reference material and by combination with bulk normalized as 100% (wt), the major element concentrations were calculated by Eq.(3); (2) By using NIST610 as external reference material and Ca as internal standard (concentration of Ca is collected from step (1)), the trace element concentrations were calculated based on Eq.(1). The configuration for the implementation of the proposed strategy is shown in Fig.1. The strategy of single external reference material combined with internal standardization reported by Longrich et al[12] is shown in Eq.(1):
Fig.1
Configuration of quantification strategy based on two reference materials and bulk normalization as 100% (wt)
(1)
The proposed quantification strategy was implemented in Iolite3.0[32], including background subtraction, instrument drift correction and transient signal reduction. The bulk normalization (Eq.(3)) was accomplished with the authoredited data reduction scheme. In practical, the implementation of this strategy is as follows. The signal intensity was firstly subtracted from the background (gas blank), and then normalized to internal standard (Ca). The intensity ratio was corrected for the instrument drift by using multiple analysis of NIST610 (linear interpolation). According to Eq.(3) and using StHs6/80-G as external reference material, the major element concentrations were calculated. The bulk normalization as 100% (wt) was calculated based on 51 measured elements. The trace elements were quantified with NIST610 as external reference material and Ca as internal standard (the concentration of Ca was collected from step (1)). The concentrations of major elements (from step (1)) and trace elements (from step (2)) were the final data.
(2)
3
The bulk normalization as 100% (wt) is shown in Eq.(2):
Results and discussion
The Eq.(1) was substituted into Eq.(2) to obtain Eq.(3): 3.1 (3)
Where, i and c represent the signal intensity (cps) and concentration. el and is represent the target element and internal standard. Ox represents the element oxide. SAM and RM represent sample and reference material. f represents the oxide coefficient. Table 2
Sum of elemental oxides of the investigated reference materials
Name
Sum of oxide (%)
Name
Sum of oxide (%)
NIST610
99.190
GOR128-G
100.254
NIST612
99.980
GOR132-G
100.000
ATHO-G
100.079
BCR-2G
99.637
StHs6/80-G
100.203
BIR-1G
100.014
ML3B-G
99.120
BHVO-2G
99.781
KL2-G
99.169
GSD-1G
99.743
T1-G
99.700
Uncertainty of reference values
The reference value uncertainties of external reference materials would directly transfer to analytical results, so that the analytical results are severely influenced by the uncertainty of external reference material. Currently available reference materials for LA-ICP-MS include NIST, MPI-DING and USGS glasses. Figure 2 shows the comparison of reference value uncertainties of NIST610, MPI-DING (ATHO-G, StHs6/80-G, T1-G, GOR132-G and GOR128-G) and USGS (BCR-2G and GSD-1G). The reference value uncertainties were collected from GeoReM database (http://georem. mpch-mainz.gwdg.de/). The results in Fig.2 illustrated that the uncertainties of NIST610 were smaller than those of MPI-DING and USGS glasses. The relative small uncertainties of NIST610 could be interpreted from two aspects. One was that the value certification of NIST610 was thoroughly carried out in previous studies, and accepted as primary reference materials for LA-ICP-MS calibration. The other one was that NIST610
WU Shi-Tuo et al. / Chinese Journal of Analytical Chemistry, 2017, 45(7): 965–972
Relationship of intensity of 151Eu (normalized to content of Eu (normalized to Ca)
43
Fig.2 Comparison of reference value uncertainty between NIST610 and MPI-DING, USGS reference materials
Fig.3
has high abundance of trace elements. Commonly, elements with high abundance are easily certified, thus their uncertainties are relative small. Luo et al[24] demonstrated that the main source of LA-ICP-MS analytical uncertainty was derived from the uncertainty of external reference material. In summary, analytical results were better when using NIST610 as external reference material than MPI-DING and USGS glasses.
This was probably caused by the potential imprecision of reference values. Some of those elements were given as information values or had relative large uncertainties. In summary, the matrix effects between synthetic and geological glasses were insignificant under our experimental conditions. The calibration of synthetic glass could use geological glass as external reference material, and vice versa. 3.3
3.2
Matrix effects
The matrix effects between samples and reference materials may strongly influence the analytical accuracy of LA-ICP-MS, especially where the matrix-matched calibration cannot be achieved[33]. The matrix effects could stem from ablation procedure[34,35], aerosol transportation[36] and ICP ionization process[37]. Matrix effect between synthetic glass (NIST series) and geological glass (MPI-DING and USGS) has been debated in previous studies. Liu et al[8] observed serious matrix effects between NIST610 and MPI-DING glasses, while Yuan et al[25] demonstrated that the matrix effects between synthetic and geological glasses were insignificant. In this study, based on the quantification strategy described by Longerich et al[12], the normalized intensity (normalized to Ca) and concentration (normalized to Ca) was plotted, and the linear coefficients was used to evaluate the matrix effects among different glass substrates (as shown in Fig.3). The elemental fractionation that is specified to a certain substrate might be one of sources for the matrix effects. Our previous study[22] illustrated that the elemental fractionation of glasses induced by 193-nm laser was insignificant as the ablation depth was smaller than spot size. All the data were collected when ablation depth was smaller than spot size. The matrix effects among NIST, MPI-DING and USGS series glass were systematically evaluated. The results illustrated that the linear coefficients of most elements were in the range of 0.9980–0.9999, demonstrating that the matrix effects were insignificant. Several elements including P, Fe, V, Cu and Zn showed the linear coefficients of 0.9900–0.9980.
Ca)and
Quantification strategy based on two reference materials and bulk normalization as 100 % (wt)
The major element compositions of NIST series glass are significantly different from those of geological glasses. For example, concentration of MgO in NIST610 is only 716 μg g‒1, while the concentrations of MgO in most geological glass are higher than 2% (wt), so that the analytical results of some major element may have large deviations when using NIST610 as external reference material. Several elements in geological glass have very low concentration or large uncertainty, for instance, the concentration of Lu in StHs6/80-G is only 0.168 μg g–1, which is unusable as the external reference material in the quantification strategies for these elements. Three quantification strategies (including single reference material NIST610, single reference material StHs6/80-G and two reference materials) were compared for quantifying ML3B-G (Fig.4). The grey zone represents the reference value uncertainty. The error bar is given as 1 standard deviation (n = 10). The ordinate shows the relative deviation (%). The calculation of the relative deviation (RD, %) is shown by Eq.(4) RD = [(CMear ‒ CRV)/CRV] × 100 (4) The results as shown in Fg.4 illustrated that TiO2, MgO and K2O had relative large deviation when using NIST610 as external reference material, while several trace elements including Nb, Mo, Sn, Tm, Lu and W showed large deviation (> 10%) when using StHs6/80-G as external reference material. The quantification strategy based on two reference materials and bulk normalization as 100% (wt) efficiently eliminated the deficiencies encountered with the strategy
WU Shi-Tuo et al. / Chinese Journal of Analytical Chemistry, 2017, 45(7): 965–972
Fig. 4 Comparison of calibrated data of ML3B-G (A) NIST610 normalization strategy, (B) StHs6/80-G normalization strategy, (C) two steps normalization strategy
using single reference material. Almost all analytical results obtained from the proposed strategy were in the range of reference value uncertainty, which demonstrated that the proposed strategy improved the analytical accuracy. 3.4
Analysis of MPI-DING, USGS and CGSG glass reference materials
The major and trace elements in BCR-2G, CGSG-2 and KL2-G were quantified using the proposed strategy (Fig.5 and Table 3). The grey zone represents the reference value
uncertainty, and the error bars are given as 1 standard deviation (n = 10). The reference values and uncertainties of BCR-2G and KL2-G were cited from GeoReM database, and CGSG-2 was cited from reference[38]. It can be seen from Fig.5 and Table 3 that analytical results of most major and trace elements matched well with reference values within 95% confidence, which demonstrated that the proposed strategy was approvingly applicable for the reduction of LA-ICP-MS transient signal. Several elements including Zn in BCR-2G, Be, Zn in CGSG-2 and Pb in KL2-G were out of the range of reference value uncertainty.
Fig.5 Calibrated data of (A) BCR-2G, (B) CGSG-2 and (C) KL2-G using the proposed strategy
WU Shi-Tuo et al. / Chinese Journal of Analytical Chemistry, 2017, 45(7): 965–972
Table 3 Reference values and measured data of BCR-2G, CGSG-2 and KL2-G
SiO2 TiO2 Al2O3 FeO(t) MnO MgO CaO Na2O K2O P2O5 Li Be Sc V Cr Co Ni Cu Zn Ga Rb Sr Y Zr Nb Mo Sn Sb Cs Ba La Ce Pr Nd Sm Eu Gd Tb Dy Ho Er Tm Yb Lu Hf Ta W Pb Bi Th U
GeoReM data 54.4 2.27 13.4 12.4 0.19 3.56 7.06 3.23 1.74 0.37 9 2.3 33 425 17 38 13 21 125 23 47 342 35 184 12.5 270 2.6 0.35 1.16 683 24.7 53.3 6.7 28.9 6.59 1.97 6.71 1.02 6.44 1.27 3.7 0.51 3.39 0.503 4.84 0.78 0.5 11 0.05 5.9 1.69
BCR-2G Measured data 54.8 2.35 13.6 12.6 0.192 3.62 6.97 3.14 1.78 0.348 9.14 1.67 32 425 15.2 38 11.5 17 164 22.9 49.1 327 31.7 168 11.3 262 2.05 0.391 1.17 654 24.7 52.9 6.54 27.5 6.72 2.08 6.43 1.01 6.38 1.28 3.55 0.524 3.54 0.508 4.91 0.806 0.461 11.1 0.058 5.52 1.62
RSD (%) 0.32 0.53 0.41 0.91 0.79 0.93 1.09 0.79 0.87 2.28 16.59 28.91 1.71 0.84 5.11 1.52 15.75 3.15 2.46 3.22 1.13 0.82 1.87 0.75 0.94 1.04 12.47 35.26 5.32 1.72 1.40 1.44 2.97 3.46 5.86 3.94 5.21 7.38 3.18 5.73 4.90 8.94 8.14 6.67 4.74 4.42 15.57 3.33 12.25 2.08 3.17
Jochum’data 54.3 0.59 20.8 6.76 0.13 0.87 1.7 6.55 6.95 0.093 411 16.9 4.34 206 8.1 6.15 4.48 21.2 124 38 124 1161 28.5 1424 69.8 1.23 11.1 1.62 2.02 390 160 256 23.2 74.6 9.75 2.48 6.86 0.97 4.96 0.9 2.66 0.41 2.76 0.42 35.4 2.08 1.53 129 1.11 75.3 13.7
CGSG-2 Measured data 53.5 0.598 21.1 6.66 0.132 0.849 1.79 6.39 7.74 0.099 470 22.2 5.63 213 7.76 6.08 2.76 22 160 40.5 133 1214 27.8 1367 71.2 1.07 11.6 1.86 2.03 408 159 256 22.8 73.1 9.9 2.49 6.62 0.898 4.85 0.883 2.61 0.441 2.65 0.386 34.9 2.09 1.52 150 1.19 74.1 15.3
RSD (%) 0.22 1.06 0.32 0.77 0.79 0.93 4.90 0.42 0.76 3.97 1.65 15.22 9.94 1.32 27.20 4.74 81.45 3.90 6.55 3.80 1.48 0.38 2.57 0.53 1.38 34.42 3.61 20.87 6.29 0.80 0.91 0.71 1.83 2.55 5.70 5.26 10.34 8.00 6.35 7.85 9.24 14.78 10.84 12.11 2.80 4.96 13.67 1.26 6.90 1.37 2.32
GeoReM data 50.3 2.56 13.3 10.7 0.165 7.34 10.9 2.35 0.48 0.232 5.1 0.88 31.8 309 294 41.2 112 87.9 110 20 8.7 356 25.4 152 15 3.6 1.54 0.14 0.115 123 13.1 32.4 4.6 21.6 5.54 1.92 5.92 0.89 5.22 0.961 2.54 0.331 2.1 0.285 3.93 0.961 0.37 2.07 0.036 1.02 0.548
KL2-G Measured data 50.8 2.67 13.4 11.1 0.168 7.42 10.9 2.39 0.472 0.256 5.36 0.85 32.2 325 283 45.8 122 98.2 127 22.9 9.34 358 24.7 146 14.1 3.24 1.61 0.195 0.126 124 13.2 32.6 4.49 20.9 5.38 1.98 5.79 0.866 5.27 0.937 2.53 0.328 2.06 0.279 4.04 0.982 0.479 2.1 0.051 1.01 0.533
RSD (%) 0.44 0.74 0.34 0.78 1.14 1.15 1.29 0.82 1.35 4.18 19.62 73.74 2.52 0.83 1.44 2.05 1.94 2.01 2.81 3.01 1.74 0.68 1.59 0.76 2.92 6.25 11.24 32.37 22.71 1.34 1.31 1.23 3.25 4.00 5.55 3.29 5.06 6.02 3.39 7.24 8.01 9.40 8.03 10.31 6.06 4.53 11.86 5.62 22.95 3.92 8.21
GeoReM data means the data are cited from GeoReM database; Jochum’data means the data are cited from publication[38].
This was probably attributed to the imprecise of reference values or the potential heterogeneity. The data reported in this study could supplement the reference value database for BCR-2G, CGSG-2 and KL2-G.
4
Conclusions
In this study, the reference value uncertainties in current available glass reference materials were evaluated. The results
illustrated that uncertainties of NIST610 were better than that of other glass reference materials. The normalized intensity (normalized to Ca) and concentration (normalized to Ca) were plotted, and the linear coefficient was used to evaluate the matrix effects among different reference materials (NIST, MPI-DING and USGS glasses). The results illustrated that the matrix effects were insignificant under the experimental conditions. The quantification strategy based on two reference materials and bulk normalization as 100% (wt) was proposed
WU Shi-Tuo et al. / Chinese Journal of Analytical Chemistry, 2017, 45(7): 965–972
and this strategy efficiently eliminated the deficiencies encountered with the strategy using single reference material, such as extreme low concentration or large uncertainty for some elements. Three quantification strategies, single reference material NIST610, single reference material StHs6/80-G and two reference materials, were used for quantifying ML3B-G. The results illustrated that the proposed strategy improved the analytical accuracy. Three reference materials including BCR-2G, CGSG-2 and KL2-G were quantified using this strategy, and almost all data matched well with reference values, which demonstrated the applicability of the proposed strategy.
References [1] [2] [3] [4] [5] [6] [7] [8] [9] [10] [11] [12] [13] [14]
[15] [16] [17] [18] [19]
Liu Y S, Hu Z C, Li M, Gao S. Chinese Sci. Bull., 2013, 58(32): 3863‒3878 Russo R E, Mao X, Gonzalez J J, Zorba V, Yoo J. Anal. Chem., 2013, 85(13): 6162‒6177 Koch J, Günther D. Appl. Spectrosc., 2011, 65(5): 155A‒162A Wu S T, Wang Y P, Xu C X. Rock Mineral Anal., 2015, 34(5): 503‒511 Garbe‒Schönberg D, Müller S. J. Anal. At. Spectrom., 2014, 29(6): 990‒1000 Wu S T, Wang Y P, Zhan X C, Kronz A, Simon K, Xu C X, Tian H. Rock Mineral Anal., 2016, 35(6): 612‒620 Zack T, Hogmalm K J. Chem. Geol., 2016, 437: 120‒133 Liu Y S, Hu Z C, Gao S, Gunther D, Xu J, Gao C G, Chen H H. Chem. Geol., 2008, 257(1‒2): 34‒43 Miliszkiewicz N, Walas S, Tobiasz A. J. Anal. At. Spectrom., 2015, 30(2): 327‒338 Halicz L, Gunther D. J. Anal. At. Spectrom., 2004, 19(12): 1539‒1545 Wälle M, Koch J, Günther D. J. Anal. At. Spectrom., 2008, 23(9): 1285‒1289 Longerich H P, Jackson S E, Günther D. J. Anal. At. Spectrom., 1996, 11(9): 899‒904 Hu Z C, Liu Y S, Chen L, Zhou L A, Li M, Zong K Q, Zhu L Y, Gao S. J. Anal. At. Spectrom., 2011, 26(2): 425‒430 Jochum K P, Scholz D, Stoll B, Weis U, Wilson S A, Yang Q C, Schwalb A, Borner N, Jacob D E, Andreae M O. Chem. Geol., 2012, 318: 31‒44 Horn I, Rudnick R L, McDonough W F. Chem. Geol., 2000, 164(3-4): 281‒301 Paton C, Woodhead J D, Hellstrom J C, Hergt J M, Greig A, Maas R. Geochem. Geophys. Geosys., 2010, 11(3): 1‒36 Norman M D, Pearson N J, Sharma A, Griffin W L. Geostand. Newsl., 1996, 20(2): 247‒261 Guillong M, Hametner K, Reusser E, Wilson S A, Günther D. Geostand. Geoanal. Res., 2005, 29(3): 315‒331 Gagnon J E, Fryer B J, Samson I M, Williams-Jones A E. J. Anal. At. Spectrom., 2008, 23(11): 1529‒1537
[20] Zhang C, Hu Z, Zhang W, Liu Y, Zong K, Li M, Chen H, Hu S. Anal. Chem., 2016, 88(20): 10088‒10094 [21] Jackson S E. Laser Ablation ICP-MS in the Earth Sciences: Current Practices and Outstanding Issues (P. Sylvester, ed.). Mineralogical Association of Canada. Short Course Series, 2008, 40: 169‒188 [22] Wu S T, Wang Y P, Xu C X, Yuan J H. Chinese J. Anal. Chem., 2016, 44(7): 1035‒1041 [23] Li Z, Hu Z, Liu Y, Gao S, Li M, Zong K, Chen H, Hu S. Chem. Geol., 2015, 400: 11‒23 [24] Luo Y, Gao S, Longerich H P, Gunther D, Wunderli S, Yuan H L, Liu X M. J. Anal. At. Spectrom., 2007, 22(2): 122‒130 [25] Yuan J H, Zhan X C, Sun D Y, Zhao L H, Fan C Z, Kuai L J, Hu M Y. Chinese J. Anal. Chem., 2011, 39(10): 1582‒1588 [26] Yuan J H, Zhan X C, Hu M Y, Zhao L H, Sun D Y. Spectros. Spectral. Anal., 2015, 35(2): 512‒518 [27] Jochum K P, Stoll B, Weis U, Jacob D E, Mertz-Kraus R, Andreae M O. Geostand. Geoanal. Res., 2014, 38(3): 265‒292 [28] Czas J, Jochum K P, Stoll B, Weis U, Yang Q C, Jacob D E, Andreae M O. Spectrochim. Acta B, 2012, 78: 20‒28 [29] Jochum K P, Weis U, Stoll B, Kuzmin D, Yang Q C, Raczek I, Jacob D E, Stracke A, Birbaum K, Frick D A, Günther D, Enzweiler J. Geostand. Geoanal. Res., 2011, 35(4): 397‒429 [30] Jochum K P, Stoll B, Herwig K, Willbold M, Hofmann A W, Amini M, Aarburg S, Abouchami W, Hellebrand E, Mocek B, Raczek I, Stracke A, Alard O, Bouman C, Becker S, Dücking M, Brätz H, Klemd R, de Bruin D, Canil D, Cornell D, de Hoog C-J, Dalpé C, Danyushevsky L, Eisenhauer A, Gao Y, Snow J E, Groschopf N, Günther D, Latkoczy C, Guillong M, Hauri E H, Höfer H E, Lahaye Y, Horz K, Jacob D E, Kasemann S A, Kent A J R, Ludwig T, Zack T, Mason P R D, Meixner A, Rosner M, Misawa K, Nash B P, Pfänder J, Premo W R, Sun W D, Tiepolo M, Vannucci R, Vennemann T, Wayne D, Woodhead J D. Geochem. Geophys. Geosyst., 2006, 7(2): 1‒44 [31] Jochum K P, Nohl U. Chem. Geol., 2008, 253(1-2): 50‒53 [32] Paton C, Hellstrom J, Paul B, Woodhead J, Hergt J. J. Anal. At. Spectrom., 2011, 26(12): 2508‒2518 [33] Sylvester P J. Laser Ablation ICP‒MS in the Earth Sciences: Current Practices and Outstanding Issues (P. Sylvester, ed.). Mineralogical Association of Canada. Short Course Series, 2008, 40: 67‒78 [34] Luo T, Wang Y, Hu Z, Günther D, Liu Y, Gao S, Li M, Hu S H. J. Anal. At. Spectrom., 2015, 30(4): 941‒949 [35] Tang M, Arevalo Jr R, Goreva Y, McDonough W F. J. Anal. At. Spectrom., 2015, 30(11): 2316‒2322 [36] Kovacs R, Günther D. J. Anal. At. Spectrom., 2008, 23(9): 1247‒1252 [37] Kroslakova I, Günther D. J. Anal. At. Spectrom., 2007, 22(1): 51‒62 [38] Jochum K P, Enzweiler J, Reference Module in Earth Systems and Environmental Sciences, Treatise on Geochemistry (Second Edition), Elsevier, Oxford, 2014, pp. 43‒70