ilar regions and its use for symbol spotting in technical documents is presented. ... When working with huge document images, as for instance architectural draw- .... We have tested our method using a huge real architectural floor plan in PDF.
A Region-Based Hashing Approach for Symbol Spotting in Technical Documents Mar¸cal Rusi˜ nol and Josep Llad´os Centre de Visi´ o per Computador / Computer Science Department Edifici O, Campus UAB 08193 Bellaterra (Cerdanyola), Barcelona, Spain {marcal,josep}@cvc.uab.es, http://www.cvc.uab.es
Abstract. In this paper a geometric hash function able to cluster similar regions and its use for symbol spotting in technical documents is presented. This hashing technique aims to perform a fast spotting process to find candidate locations needing neither a previous segmentation step nor a priori knowledge or learning step.
1
Introduction
When working with huge document images, as for instance architectural drawings or electronic diagrams, a method to locate by a fast technique some zones of the document where a given symbol appears is very useful. Usually, architects or engineers re-use data from their previous designs for new projects. Nowadays, the format of these documents does not allow an intelligent way to browse them. The manual inspection of technical documents becomes a tedious task, and when talking about large collections, it becomes impossible to perform an exhaustive search. In this paper we present a method to retrieve the locations of document images in which a certain queried graphical symbol is likely to appear by a fast indexing technique. Although well-known shape descriptors perform quite good recognition rates in difficult conditions as in presence of distortions, occlusions and geometric transformations, they can not be applied to locate graphical symbols in huge collections of documents. Most of these techniques are time consuming and only work for recognizing isolated shapes. The interested reader is referred to Zhang’s [8] review on shape description techniques. This is the reason why in the last years, Symbol Spotting has become an emerging topic of interest in the Graphics Recognition community. It aims to detect graphical symbols in huge and complex document images by a fast technique and needing neither a segmentation step nor a priori knowledge. Symbol Spotting discriminates symbols by means of a very compact representation of expressive features which are organized in a lookup table (usually a hash table with its associated hash function) allowing graphic indexation of symbols appearing in documents. Usually a validation of the hypothetic locations is performed using a voting scheme as a post-processing step. Two different Symbol Spotting approaches can be used depending on the chosen primitives. The methods
2
Mar¸cal Rusi˜ nol and Josep Llad´ os
working at pixel level, as for instance [6, 9], and the ones focusing in geometric primitives as segments, polylines, arcs, etc. as in [1, 5]. Pixel-based methods are usually more robust to noise, but they are more complex and need a multi-level structure (as the dendrogram used in [9]) to segment and recognize at the same time. On the other hand, more compact, fast and elementary descriptions can be formulated when working with vectorial primitives even if they usually lead to more false alarms and are more sensible to noise. In our method, polygonally approximated regions composing a symbol are used as primitives which describe it and an index is associated to each region. Geometric Hashing [2] is a well-known method to extract an index of a given shape. However this technique only works well if the segment set of the model and the segment set of the test shape is the same. The actual raster-to-vector techniques are very sensitive to little distortions and can result in a different number of segments for similar shapes, as stated by Tombre et al. in [7]. Our presented method applies a hash function to each region to extract an index identifying similar regions, being independent of the number of segments forming the region since it only copes with global shape information. Hash functions H(x) = y are deterministic functions projecting key values x to an even distribution on a smaller set of elements y. They are useful for finding an entry in a database by a key value. In our case, the keys are the different regions composing a symbol. The remainder of this paper is organized as follows: we introduce in the next section how the graphical symbols are represented in a two-center bipolar coordinate system. In section 3, the hash function and the whole indexing scheme is presented. We provide the preliminar experimental results in section 4. Finally conclusions are presented in section 5.
2
Symbol Representation in a Two-Center Bipolar Coordinate System
Graphical symbols found in technical documents are usually composed of a series of neighboring closed regions. We describe a symbol as the combination of several closed contours, approximated by the corresponding set of adjacent segments. Let us further detail how the symbols are represented and encoded in a twocenter bipolar coordinate system. 2.1
Primitive Extraction
A graphical symbol appearing in a technical document (such as a furniture symbol in an architectural drawing) is decomposed and described in terms of its n composing regions. The presence, in a given zone of the drawing of several similar regions that the ones forming the queried symbol, turns this region into a candidate for containing the queried symbol. To represent the symbols, a connected component analysis of the technical document images is computed to first extract the regions. Their contours are
A Region-Based Hashing Approach for Symbol Spotting
3
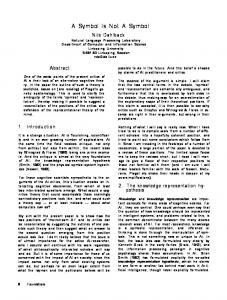
subsequently polygonally approximated to take the chains of adjacent segments –polylines– as representing primitives. We can appreciate in Figure 1 an overview of all the representation process.
a)
b)
c)
d)
Fig. 1. Symbol Representation Steps. (a) Original Symbol. (b) Connected Components. (c) Contour of each Region. (d) Polygonally Approximated Regions with the Number of Segments Composing the Polylines.
2.2
Two-Center Bipolar Coordinates
Choosing two reference centers from the set of points of a given polyline and centering them at (±a, 0), each other point composing the polyline p is represented in two-center bipolar coordinates (r1 , r2 ). Two-center bipolar coordinates give the distances from two fixed centers, and are defined in terms of Cartesian coordinates by p r1 = p(x + a)2 + y 2 r2 = (x − a)2 + y 2
(1)
In two-center bipolar coordinate system, each point (r1 , r2 ) belongs to a characteristic plane curve (known as Cassinian ovals [3]) described by all the points such that the product of its distances from the two centers is a constant b2 = r1 r2 . The Cassinian ovals were first studied by Giovanni D. Cassini as a model for the orbit of the sun around the earth. In Figure 2 we illustrate a series of Cassinian ovals with a = 1 and with values of b ∈ [1, 2]
4
Mar¸cal Rusi˜ nol and Josep Llad´ os
Fig. 2. A Series of Cassinian Ovals With a = 1 and for Values of b ∈ [1.001, 2].
3
Hash Function and Indexing Symbols With a Hash Table
Given a polyline p, a will be defined as the maximum distance between two points (ni , n0i ) ∈ p, where n0i corresponds to the furthest point from ni belonging to the line formed by ni and the gravity center of the polyline. A transform matrix M is computed to rotate and scale the whole polyline to transform the points ni to (−a, 0) and n0i to (a, 0). Then using (±a, 0) points as centers, b value will be defined as the minimum constant to build a Cassinian oval surrounding all the i points of p. We can appreciate in Figure 3 the possible surrounding ovals depending on the reference centers.
Fig. 3. A Shape and The Minimum Surrounding Cassinian Ovals Depending on the Reference Centers.
The hash function H(p) = (a, b) will project p in a tuple by means of minimizing the value of b for the maximum value of a. a √ value is normalized to the total length of p then having a ∈ [0, 1] and b ∈ [0, 2]. Finally, applying the
A Region-Based Hashing Approach for Symbol Spotting
5
equation 2 we discretize the values of a and b. Experimentally, we found that a value m = 30 provoke collisions when computing keys of similar shapes while minimizing the collisions of dissimilar shapes. x = round(x ∗ m)
(2)
The tuple (a, b) gives information about the eccentricity of the set of points composing the analyzed region. In an off-line step, all the polygonally approximated regions p appearing in the documents of the collection are stored in a hash table in their corresponding entry, depending on the values of H(p). Then, the querying process only needs to compute the entries of the hash table to activate applying the hash function H(px ) to the regions of the query symbol. A voting process reinforce the locations where diverse regions appear. If in a given zone of the technical document there is presence of several regions composing the query, then there is high probability to find the queried symbol in this zone.
4
Preliminar Results
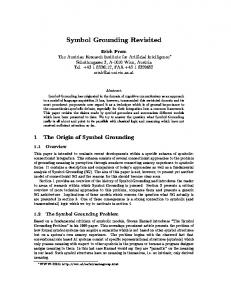
We have tested our method using a huge real architectural floor plan in PDF format. The document image is 7150 × 6290 b/w pixels. After the connected component analysis and the polygonal approximation using Rosin and West’s method [4], the vectorial DXF file is composed of more than 3000 polylines representing regions. In this floor plan several furniture symbols appears, an instance of each symbol (arising from a different floor plan, but designed by the same architect so the symbol design is the same) has been taken as the model symbol to perform the queries. The whole vectorial file has been labelled to be used as ground truth. We can appreciate in Figure 4 the result of spotting a the toilet sink and the bidet symbols. Several false positive regions are also spotted since they are very simple circular or squared regions, similar to some of the details of the query symbols. In Table 1 we can see the numeric details concerning the performance of the proposed spotting method. As we can appreciate, the more complex is the symbol, the more false alarms appear. This result is due to the fact that more entries in the hash table are concerned and consequently, more collisions are considered to form part of the queried symbol. In addition, the more complex is the symbol to search, the more computationally expensive is the method.
5
Conclusions
The presented method aims to index huge document images by the graphical symbols appearing in it by means of a hash table. When indexing shapes by a hash table, neither a segmentation of the shapes is needed nor previous knowledge or learning step is required.
6
Mar¸cal Rusi˜ nol and Josep Llad´ os
a)
b)
c) Fig. 4. Symbol Spotting. (a) Models, a Toilet Sink and a Bidet. (b) Original Vectorial Image. (c) Results of the Spotting Process. Regions Labelled as Bidet Are Drawn in Red and Regions Labelled as Toilet Sink Are Drawn in Green. Notice That Most of False Alarms Are Circular or Squared Simple Regions.
A Region-Based Hashing Approach for Symbol Spotting
7
Table 1. Number of Regions and Segments Composing Each Model. Number of Regions not Belonging to the Queried Symbol Labelled as Positives. Computation Time (in seconds). Bath Bidet Toilet Kitchen sink Toilet sink Num. of regions 7 8 6 10 12 Num. of segments 101 110 112 144 157 Num. of false alarms 27 59 40 82 93 Time 0.288 0.267 0.347 0.344 0.568
Table 26 351 589 1.331
When using hash functions, obviously, if similar shapes have to fit the same table entry, we will have some collisions with shapes which are not similar but are projected to the same tuple. As we can appreciate in the results, these collision make that spotting approaches based on hash functions, usually result in a set of false alarms which are not a really significant problem since elevated recognition rates are not needed.
Acknowledgments This work has been partially supported by the Spanish project TIN2006-15694C02-02.
References 1. P. Dosch, J. Llad´ os, “Vectorial Signatures for Symbol Discrimination,” Graphics Recognition: Recent Advances and Perspectives, LNCS, vol. 3088, pp. 154–165, 2004. 2. Y. Lamdan, H.J. Wolfson, “Geometric hashing: A general and efficient model-based recognition scheme,” in Second Int. Conf. on Computer Vision, pp. 238–249, 1988. 3. E.H. Lockwood, “A Book of Curves,” Cambridge University Press, pp. 187–188, 1967. 4. P.L. Rosin, G.A. West, “Segmentation of Edges into Lines and Arcs,” Image and Vision Computing, vol. 7, no. 2, pp. 109–114, May, 1989. nol, J. Llad´ os, “Symbol Spotting in Technical Drawings Using Vectorial 5. M. Rusi˜ Signatures,” Graphics Recognition: Ten Years Review and Future Perspectives, LNCS, vol. 3926, pp. 35–46, 2006. 6. S. Tabbone, L. Wendling, D. Zuwala, “A Hybrid Approach to Detect Graphical Symbols in Docuements,” in Sixth Int. Workshop on Document Analysis Sistems, LNCS, vol. 3163, pp. 342–353, 2004. 7. K. Tombre, C. Ah-Soon, P. Dosch, G. Masini, S. Tabbone, “Stable and Robust Vectorization: How to Make the Right Choices,” GREC ’99: Selected Papers from the Third Int. Workshop on Graphics Recognition, Recent Advances, LNCS, vol. 1941, pp. 3–18 , 2000. 8. D. Zhang, G. Lu, “Review of shape representation and description techniques,” Pattern recognition, vol. 37, no. 1, pp. 1–19, 2004. 9. D. Zuwala, S. Tabbone, “A Method for Symbol Spotting in Graphical Documents,” in Seventh Int. Workshop on Document Analysis Sistems, LNCS, vol. 3872, pp. 518– 528, 2006.