to detect graphical symbols in large and complex document images by a fast ... A
graphical symbol appearing in a technical document (such as a furniture sym-.
A Region-Based Hashing Approach for Symbol Spotting in Technical Documents Mar¸cal Rusi˜ nol and Josep Llad´os Centre de Visi´ o per Computador / Computer Science Department Edifici O, Campus UAB 08193 Bellaterra (Cerdanyola), Barcelona, Spain {marcal,josep}@cvc.uab.es, http://www.cvc.uab.es
Abstract. In this paper a geometric hash function able to cluster similar shapes and its use for symbol spotting in technical documents is presented. A very compact representation of features describing each primitive composing a symbol are used as key indexes of a hash table. When querying a symbol in this indexing table a voting scheme is used to validate the hypothesis of where this symbol is likely to be found. This hashing technique aims to perform a fast spotting process to find candidate locations needing neither a previous segmentation step nor a priori knowledge or learning step involving multiple instances of the object to recognize.
1
Introduction
Architects and engineers use to store their designs in large databases of documents. They use to re-use data from previous designs for new projects. Graphical documents such as architectural, electronic or mechanical drawings use to have a big size with hundreds of graphical parts. In this framework, fast methods for locating document zones where a given symbol appears are very useful for browsing, navigation or even categorization purposes. Nowadays, the format of these documents does not allow an intelligent way to browse them. The manual inspection of technical documents becomes a tedious task, and when talking about large collections, it becomes impossible to perform an exhaustive search. In this paper we present a method to retrieve the locations of document images in which a certain queried graphical symbol is likely to appear by a fast indexing technique. Although well-known shape description and recognition approaches perform quite good recognition rates in difficult conditions as in presence of distortions, occlusions and geometric transformations, they can not be applied to locate graphical symbols in large collections of documents. Most of these techniques are time consuming and only work for recognizing isolated shapes. The interested reader is referred to Zhang’s [11] review on shape description techniques.
2
Mar¸cal Rusi˜ nol and Josep Llad´ os
This is the reason why in the last years, Symbol Spotting has become an emerging topic of interest among the Graphics Recognition community. It aims to detect graphical symbols in large and complex document images by a fast technique and needing neither a segmentation step nor a priori knowledge. Symbol Spotting discriminates symbols by means of a very compact representation of expressive features which are organized in a lookup table (usually a hash table with its associated hash function) allowing graphic indexation of symbols appearing in documents. Usually a validation of the hypothetic locations is performed using a voting scheme as a post-processing step. Two different Symbol Spotting approaches can be used depending on the chosen primitives. The methods working at pixel level, as for instance [6, 9, 12], and the ones focusing in geometric primitives as segments, polylines, arcs, etc. as in [2, 5, 8]. Pixel-based methods are usually more robust to noise, but they are more complex and need a multilevel structure (as the dendrogram used in [12]) to segment and recognize at the same time. On the other hand, more compact, fast and elementary descriptions can be formulated when working with vectorial primitives even if they usually lead to more false alarms and are more sensible to noise. Given a feature vector x defining a shape in a N-dimensional space, a hash function H(x) = y is a deterministic function projecting the feature vectors x to an even distribution of one-dimensional key indexes y. They are useful for finding an entry in a database by a key value. In our case, the index keys are computed from the different closed regions composing a symbol which are the primitives describing a given symbol. The ideal behavior of our hash function is to provoke collisions (associate the same indexing key to different entry values) for similar shaped primitives, and to associate different key indexes to different shape inputs. The resulting hash table clusters similar shapes under a single key index. In the presented method, polygonally approximated regions composing a symbol are used as primitives which describe it and a key index is associated to each region. Geometric Hashing [3] is a well-known method to extract an index of a given shape. However this technique only works well if the set of segments of the model and the set of segments of the test shape have the same number of segments. The actual raster-to-vector techniques are yet very sensitive to little distortions and can result in a different number of segments for similar shapes, as stated by Tombre et al. in [10]. Our presented method applies a hash function to each region to extract an index identifying similar regions, being independent of the number of segments forming the region since it copes with global shape information. The remainder of this paper is organized as follows: we introduce in the next section how the graphical symbols are represented in a two-center bipolar coordinate system. In section 3, the hash function and the whole indexing scheme is presented. We provide the preliminar experimental results in section 4. A brief
A Region-Based Hashing Approach for Symbol Spotting
3
discussion on the presented approach is provided in section 5. Finally conclusions and future work are presented in section 6.
2
Symbol Representation in a Two-Center Bipolar Coordinate System
Graphical symbols found in technical documents are usually composed of a number of neighboring regions. Regions result from solid areas or closed contours in line drawing images. We describe a symbol in terms of the structural combination of regions, described by sequences of adjacent segments that approximate their boundary. Let us further detail how the symbols are represented and encoded in a two-center bipolar coordinate system which is an appropriate representation for the computation of the presented indexing keys.
2.1
Primitive Extraction
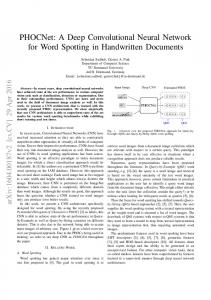
A graphical symbol appearing in a technical document (such as a furniture symbol in an architectural drawing) is decomposed and described in terms of its n composing closed contours. The presence, in a given zone of the drawing of several similar regions that the ones forming the queried symbol, turns this location into a candidate for containing the queried symbol. To represent symbols, a connected component analysis of the technical document images is computed to first extract the closed regions. Their contours are subsequently polygonally approximated to take the chains of adjacent segments –polylines– as representing primitives. We illustrate in Figure 1 an overview of all the representation process. Although the presented method do not need the polylines to be closed, we find that working with closed contours as primitives is much more stable to vectorization errors. We focus on an application dealing with architectural floor plans which can be easily represented by regions. If the method has to be used with another type of technical documents (for example electronic diagrams) which contains symbols less represented by regions, another kind of primitives much more representative should be considered.
2.2
Two-Center Bipolar Coordinates
A two-center bipolar coordinate system gives the distances (r1 , r2 ) of a point (x, y) to two reference centers. We choose the two reference centers among the set of points of a given polyline p and we center them at (±a, 0). Afterwards,
4
Mar¸cal Rusi˜ nol and Josep Llad´ os
a)
b)
c)
d)
Fig. 1. Symbol representation steps. (a) Original symbol. (b) Connected components. (c) Contour of each closed region. (d) Polygonally approximated regions with the number of segments composing the polylines.
each other point composing the polyline is represented in two-center bipolar coordinates (r1 , r2 ), defined in terms of Cartesian coordinates by
p r1 = p(x + a)2 + y 2 r2 = (x − a)2 + y 2
2.3
(1)
Cassinian Ovals
The Cassinian ovals were first studied by Giovanni D. Cassini as a model for the orbit of the sun around the earth. We use the parameters of these curves as features of the set of points forming the primitives. Let us detail how Cassinian ovals are described. In two-center bipolar coordinate system, each point (r1 , r2 ) belongs to a characteristic plane curve (known as Cassinian ovals [4]) described by all the points such that the product of its distances from the two centers is a constant b2 = r1 r2 . In Figure 2 we illustrate a series of Cassinian ovals with a = 1 and with values of b ∈ [1.001, 2]. In our case, Cassinian ovals are the basis of the hashing keys described in the next section.
A Region-Based Hashing Approach for Symbol Spotting
5
Fig. 2. A series of Cassinian ovals with a = 1 and for values of b ∈ [1.001, 2].
3
Hash Function and Indexing Symbols With a Hash Table
In this section we describe how the hash function is formulated to be able to describe shapes in terms of the Cassinian ovals parameters, and how these parameters are used as indexing keys. The whole indexation process is presented afterwards. Let us begin with the primitive description.
3.1
Hash Function
Given a polyline p, it is encoded in terms of a tuple (a, b) defined as follows. Let us first denote as ni a point over the polyline, ni ∈ p, and n0i ∈ p, as the furthest point from ni in the direction of the line passing through the gravity center gc of p. Let 2a be defined as the maximum distance among all the possible pairs of points (ni , n0i ). A transform matrix M is computed to rotate and scale the whole polyline to transform the points ni to (−a, 0) and n0i to (a, 0). Then using (±a, 0) points as centers, The value b is defined as the minimum constant to build a Cassinian oval surrounding all the i points of p. An example is shown in Figure 3. We illustrate in Figure 4 the possible surrounding ovals depending on the reference centers. The hash function H(p) = (a, b) projects p to a tuple by means of minimizing the value of b for the maximum value of a. The value √ a is normalized to the total length of p then having a ∈ [0, 1] and b ∈ [0, 2]. Finally, applying the equation 2 we discretize the values of a and b. Experimentally, we found that a value m = 30 provokes collisions when computing keys of similar shapes while minimizing the collisions of dissimilar shapes.
6
Mar¸cal Rusi˜ nol and Josep Llad´ os
Fig. 3. A polygonally approximated shape p with its gravity center gc. Given a point ni ∈ p, n0i ∈ p is the furthest point from ni passing through gc. The value b determine the smaller Cassinian oval surrounding the whole shape when ni and n0i are transformed to (−a, 0) and (a, 0).
Fig. 4. A shape and the minimum surrounding Cassinian ovals depending on the reference centers. The gray surrounded shape is the one with minimum value b and maximum distance a.
x = round(x ∗ m)
(2)
The tuple (a, b) gives information about the ellipticity and circularity of the set of points composing the analyzed region. As a is chosen as the maximum value √ of a, it gives information of the major axis of the primitive p. If b is equal to 2 × a that means that the primitive is a circular shape, the more b decreases for the same a values, the more the primitive shape would be elongated. The use of these parameters is an attempt to combine the information bringed by a very simple well-known global shape descriptors: eccentricity and non-circularity.
3.2
Indexation Process
In an off-line step, the locations of the gravity centers of all the polygonally approximated regions p appearing in the documents of the collection are stored in
A Region-Based Hashing Approach for Symbol Spotting
7
a hash table in their corresponding entry with index H(p) = (a, b). Then, when we query a symbol formed by a set of polylines S = {p1 , ..., pn }, the querying process only needs to compute the entries of the hash table to activate, applying the hash function H(px ) to all the regions px ∈ S. Ideally, in a given table entry i with indexing key (ai , bi ) we will find all and only the similar primitive regions. A query symbol formed by several primitives will activate as many table entries as dissimilar regions primitives compose it. All the locations pointed by the activated table entries are likely to contain a similar primitive than one of the query, the locations accumulating a high number of these primitives are then hypothetic locations to contain the whole symbol. To deal with a database containing several documents, the locations are expressed with three dimensions including the identification number of the document where the gravity center appears. Following the idea of the Generalized Hough Transform [1], a voting process is performed to reinforce the locations where diverse regions appear. At each zone in which we find a given indexed primitive, a vote is casted. As the symbols are formed by several primitives, high voting values in a given zone of the technical document points out the presence of several regions composing the query, thus a high probability to find the queried symbol in this zone. The accumulation of queried primitives in a given zone always forms clusters of votes while the indexed primitives belonging to other symbols will just scatter votes without any coherence in the whole space loosing significance.
4
Experimental Results
We have tested our method using a large real architectural floor plan in PDF format. The document image is 7150 × 6290 b/w pixels. After the connected component analysis and the polygonal approximation using Rosin and West’s method [7], the vectorial DXF file is composed of more than 3000 polylines representing regions. In this floor plan several furniture symbols appear, an instance of each symbol (arising from a different floor plan, but designed by the same architect so the symbol design is the same) has been taken as the model symbol to perform the queries. The whole vectorial file has been labeled to be used as ground truth. Although the results are preliminar, they are encouraging. We can appreciate in Figure 5 the result of spotting the toilet sink and the bidet symbols. Several false positive regions are also spotted since they are very simple circular or squared regions, similar to some of the details of the query symbols. In Table 1 the numeric details concerning the performance of the proposed spotting method are reported. As we can appreciate, the more complex is the symbol, the more false alarms appear. This result is due to the fact that more entries in the hash table are concerned and consequently, more collisions are considered to form part of the queried symbol. In addition, the more complex is
8
Mar¸cal Rusi˜ nol and Josep Llad´ os
a)
b)
c) Fig. 5. Symbol spotting. (a) Models, a toilet sink and a bidet. (b) Original vectorial image. (c) Results of the spotting process. Regions labeled as bidet are drawn in red and regions labeled as toilet sink are drawn in green. Notice that most of false alarms are circular or squared simple regions.
A Region-Based Hashing Approach for Symbol Spotting
9
the symbol to search, the more computationally expensive is the method.
Table 1. Number of regions and segments composing each model. Number of regions not belonging to the queried symbol labeled as positives. computation time (in seconds). Bath Bidet Toilet Kitchen sink Toilet sink Num. of regions 7 8 6 10 12 Num. of segments 101 110 112 144 157 Num. of false alarms 27 59 40 82 93 Time 0.288 0.267 0.347 0.344 0.568
5
Table 26 351 589 1.331
Conclusions, Discussion and Future Work
The presented method aims to index large documents contained in large databases by the graphical symbols appearing in it by means of a hash table. When indexing shapes by a hash table, neither a segmentation of the shapes is needed nor previous knowledge is required. Learning processes are not needed, in the sense that there is no stage needing several instances of the object to locate to learn its characteristics. When using hash functions, obviously, if similar shapes have to fit the same table entry, we will have some collisions with shapes which are not similar but are projected to the same tuple. As we can appreciate in the results, these collision make that spotting approaches based on hash functions, usually result in a set of false alarms which are not a really significant problem since elevated recognition rates are not needed in these kind of applications. Symbol Recognition techniques are a quite mature research topic in the Graphics Recognition field. The results of symbol recognition methods are usually close to the 100% recognition rate. In addition of the symbol descriptor, which usually is a long feature vector, symbol recognition methods combine these descriptors with learning and classification algorithms to cluster these descriptor feature vectors in symbol classes easy to classify. These approaches involve having an a-priori knowledge about the symbols to recognize since they need enough examples to learn the descriptors distribution. In addition, usually they are formulated only to recognize isolated symbols. In most of applications it is obvious that this is a correct approach, for instance, an OCR system has to recognize a finite set of shapes which can be “easily” segmented and which can have a lot of variability inside a given class. To reach acceptable results a learning step is necessary. However, if we think in an indexing framework able to spot symbols appearing in a large collection of documents
10
Mar¸cal Rusi˜ nol and Josep Llad´ os
and usually queried by example, we can see that the problem is not the same. Symbol Spotting techniques do not require a-priori knowledge nor learning step. As they have to lead with un-segmented data, they have to tackle with “recognition” and “segmentation” at the same time. This paper is focused on the use of a very simple primitive description hashed to build an indexing table. The results show that when designing a spotting framework there is no need to use complex shape descriptors, a feature vector formed by few digits (we use only two integers to describe a given primitive), a hash function to cluster the primitives, and an adequate voting scheme is enough to locate the regions of interest of a document where a given symbol is likely to be found. It is obvious that the use of more complex feature vectors can lead to less false alarms and better identification of correct symbols since they are usually more representative and have more discriminant power. But the use of more and more long feature vectors, also makes harder the definition of a proper hash function able to cluster similar shapes in the same table entries. We strongly believe that symbol spotting algorithms do not need complex shape descriptors but can perform quite well using simple features combined with an appropriate hash function and a posterior voting scheme. This paper has presented a work in process, and some improvements are planned. Let us enumerate and briefly explain the most important research directions. First, the performance of some other simple primitive description techniques have to be tested. In this paper we shown that indexing symbols does not need for complex or big feature vectors, but with only a couple of numbers promising results can be reached. Well-known shape descriptors as Hu’s geometric moment invariants, Zernike moments, generic fourier descriptors, etc. could be used as well to generate simple key indexes to hash symbols. Secondly, at this moment, the voting process to validate the hypothetic regions of interest, just accumulates votes in the locations where there is presence of the queried regions. At this moment we do not look if the structural organization of these primitives is consistent with the queried symbol. It is common to have some parts of technical drawings formed by a repetition of a simple region forming a given pattern, as for instance dashed lines are usually used to represent walls in floor plans. These cases are critical since if the queried symbol contains a single instance of these primitives, the zones formed by the repetition of the primitive will accumulate more votes than the zones containing the symbol itself. A voting scheme looking at the structural organization of indexed primitives is planned.
A Region-Based Hashing Approach for Symbol Spotting
11
Finally, a performance evaluation framework for symbol spotting techniques has to be developed. Metrics to evaluate the performance of the recognition on the one hand and the localization on the other, are not easy to define. Many different cases has to be taken into account: false alarms, over and under segmentation of the regions of interest, missing symbols, etc.
Acknowledgments This work has been partially supported by the Spanish projects TIN2006-15694C02-02 and CONSOLIDER-INGENIO 2010 (CSD2007-00018).
References 1. Ballard, D.H.: Generalizing the Hough Transform to Detect Arbitrary Shapes. Pattern Recognition 13(2), 111–122 (1981) 2. Dosch, P., Llad´ os, J.: Vectorial Signatures for Symbol Discrimination. In: Llad´ os, J., Kwon, Y.B. (eds.) Graphics Recognition: Recent Advances and Perspectives. LNCS, vol. 3088, pp. 154–165. Springer, Heidelberg (2004) 3. Lamdan, Y., Wolfson, H.J.: Geometric Hashing: A General and Efficient ModelBased Recognition Scheme. In: 2nd International Conference on Computer Vision, pp. 238–249. (1988) 4. Lockwood, E.H.: A Book of Curves. Cambridge University Press, (1967) 5. Locteau, H., Adam, S., Trupin, E., Labiche, J., H´eroux, P.: Symbol Spotting Using Full Visibility Graph Representation. In: 7th International Workshop on Graphics Recognition, pp. 49–50. (2007) 6. M¨ uller, S., Rigoll, G.: Searching an Engineering Drawing Database for User-Specified Shapes. In: 5h International Conference on Document Analysis and Recognition, pp. 697–700. (1999) 7. Rosin, P.L., West, G.A.: Segmentation of Edges into Lines and Arcs. Image and Vision Computing 7(2), 109–114 (1989) 8. Rusi˜ nol, M., Llad´ os, J.: Symbol Spotting in Technical Drawings Using Vectorial Signatures. In: Wenyin, L., Llad´ os, J. (eds.) Graphics Recognition: Ten Years Review and Future Perspectives. LNCS, vol. 3926, pp. 35–46, Springer, Heidelberg (2006) 9. Tabbone, S., Wendling, L., Zuwala, D.: A Hybrid Approach to Detect Graphical Symbols in Documents. In: Marinai, S., Dengel, A. (eds.) DAS VI. LNCS, vol. 3163, pp. 342–353, Springer, Heidelberg (2004) 10. Tombre, K., Ah-Soon, C., Dosch, P., Masini, G., Tabbone, S.: Stable and Robust Vectorization: How to Make the Right Choices. In: Chhabra, A.K., Dori, D. (eds.) Graphics Recognition, Recent Advances. LNCS, vol. 1941, pp. 3–18, Springer, Heidelberg (2000) 11. Zhang, D., Lu, G.: Review of Shape Representation and Description Techniques. Pattern recognition 37(1), 1–19 (2004) 12. Zuwala, D., Tabbone, S.: A Method for Symbol Spotting in Graphical Documents. In: Bunke, H., Spitz, A.L. (eds.) DAS VII. LNCS, vol. 3872, pp. 518–528, Springer, Heidelberg (2006)