A Replicated Experiment of Usage-Based and Checklist-Based Reading Thomas Thelin1, Carina Andersson1, Per Runeson1, Nina Dzamashvili-Fogelström2 1Dept.
of Communication Systems Lund University Box 118, SE-22100 Lund, Sweden {thomast, carinaa, perr}@telecom.lth.se Abstract Software inspection is an effective method to detect faults in software artefacts. Several empirical studies have been performed on reading techniques, which are used in the individual preparation phase of software inspections. Besides new experiments, replications are needed to increase the body of knowledge in software inspections. This paper presents a replication of an experiment, which compares usage-based and checklist-based reading. The results of the original experiment show that reviewers applying usage-based reading are more efficient and effective in detecting the most critical faults from a user’s point of view than reviewers using checklist-based reading. This paper presents the data of the replication together with the original experiment and compares the experiments. The main result of the replication is that it confirms the result of the original experiment. This replication strengthens the evidence that usage-based reading is an efficient reading technique.
1. Introduction Software inspection is a manual method to detect software faults [2]. It has been shown, in many empirical studies, to be efficient and effective [5][8][15]. The process of software inspections is divided into several phases, whereas the fault detection is mostly performed in the preparation phase, but also in the meeting phase. In order to improve the efficiency and effectiveness of the fault detection, reading techniques have been applied [3]. Some of the proposed reading techniques are checklist-based reading [8], perspective-based reading [3], defect-based reading [20] and usagebased reading [25]. All these reading techniques have been extensively empirically evaluated. The user perspective in software development is acknowledged and valued in different methodologies including for example use cases in object-oriented development [13] and operational profile testing [18]. However, the user perspective can also be introduced into software inspec-
2
Dept. of Software Eng. and Computer Science Blekinge Institute of Technology Box 520, SE-372 25 Ronneby, Sweden
[email protected]
tions, where the individual preparation may be conducted with a user-oriented approach. Usage-based reading is such a method which has been proposed and evaluated in a series of design inspection experiments [28], and to a testing technique [1]. An appropriate research method to empirically evaluate reading techniques is experiments [14][30]. It is important to perform new experiments, but also to conduct replications [4], meta-analyses [17][19], and to design methods to compare series of experiment [22]. Replications of experiments create a body of knowledge, which aids the insight into software engineering practice. The objective of this paper is to contribute to the improvement of reading techniques by replicating an experiment. The reading techniques compared are usage-based reading (UBR) and checklist-based reading (CBR), which was initially investigated by Thelin et al. [27]. The original experiment was conducted in Spring 2001 (denoted original experiment in this paper). The reviewers that used UBR detected more faults (effectiveness) and more faults per hour (efficiency) than the reviewers that used CBR. The main result of this paper is that the experiment in this paper (denoted replication) confirms the conclusions of the original experiment. The paper is outlined as follows. Usage-based reading is described in Section 2 including a brief description of the original experiment. The artefacts used in the experiment are presented in Section 3. In Section 4, the planning of the experiment can be found. The operation of the experiment is discussed in Section 5 and the analysis is presented in Section 6. A discussion of the results of the replication is found in Section 7. Finally, conclusions are presented in Section 8.
2. Usage-Based Reading Usage-based reading (UBR) is a reading technique, which focus on the quality of the product from a user’s point of view [26]. During the individual preparation of software inspections, reviewers utilize use cases in order to detect
faults in the software artefact under inspection. Usagebased reading has mainly been evaluated using design artefacts [28], which is also used in this replication. The cornerstones of UBR are use cases and prioritization. Use cases are utilized to guide reviewers through a software artefact during inspection. The use cases are prioritized in an order of importance from users’ requirements on the system developed. Hence, reviewers using UBR focus on the important parts first, leading to the important faults are found. The most important faults are denoted critical in the paper and refer to the faults that a user of a system consider being most important. The main purpose of UBR is to focus inspections on users’ needs, much in the same way as operational profiling in testing [18]. The reviewers applying UBR follow the prioritized used cases and check the software artefact under inspection. During inspection, the reviewers go through the artefact actively, although they do not have to actively develop the use cases. However, in one UBR experiment, the question of actively developing use cases was addressed [28]. There are other reading techniques that utilize use cases during fault searching. Among these are traceability-based reading (TBR) [29] and the user perspective in perspectivebased reading (PBR) [4]. In addition, Dunsmore et al. compare a use case approach with checklist-based reading (CBR) and structured reading [6][7]. The use cases are based on sequence diagrams for object-oriented design and are not prioritized. The results indicate that CBR is the best reading technique of the three for object-oriented code inspections. The purpose of the original experiment, on UBR and CBR, was to compare the reading techniques in design inspections [27]. CBR is considered to be industry practice, and was used as a baseline to which UBR was compared. The experiment was launched during the spring semester of 2001. 23 students of their fourth year of the software engineering Master’s programme at Blekinge Institute of Technology inspected a high-level design document. In the experiment, half of the subjects were taught the UBR method and were given prioritized use cases. The other half of the subjects were taught the CBR method and were given a checklist, where the items were sorted in a significance order. The experiment is presented in more detail in [27]. Three main research questions were investigated in the experiment: • RQ1 – Is UBR more effective than CBR in finding the most critical faults? • RQ2 – Is UBR more efficient than CBR in terms of total number of critical faults found per hour?
• RQ3 – Are different faults detected when using UBR and CBR? Hypotheses were set up and tested. In the original experiment, it was concluded that the reviewers applying UBR were more efficient in detecting faults than the reviewers using CBR (p=0.042, 37% more faults per hour). This was also true for class A faults (p=0.013, 100% more class A faults per hour) and class A&B faults (p=0.016, 64% more class A&B faults per hour). Furthermore, the reviewers applying UBR were more effective in detecting faults than the reviewers using CBR for class A faults (p=0.036, 75% more class A faults) and class A&B faults (p=0.031, 51% more class A&B faults). They were not significantly more effective for all faults. Finally, the reviewers applying UBR detected different faults compared to the reviewers applying CBR (p=0.001). From this analysis, we draw the conclusion that the UBR method is more effective and efficient compared to the industry practice method, CBR. This statement is evaluated in this replication addressing the same research questions as above.
3. Experiment Artefacts The development of the software documents and the design of the series of experiments have involved seven persons in total. The persons have taken different roles in the development of the experiment package since it was important to develop and design some parts of the experiment independently in order to minimize the threats to the validity of the experiments. The artefacts are briefly described in the following sections. A detailed description of the artefacts and the development of those are provided by Thelin et al. [25].
3.1. Documents The software system used in the experiment implements a taxi management system. The software artefacts in the experiment package are a textual requirements document, use case documents, a design document, and questionnaires. In addition, code and test documents have been developed for the system, but are not used in the experiments. The code was written in the specification and description language (SDL) [11]. The following documents were used in the experiment. • Textual Requirements Document – The textual requirements document was written in natural language (English). The document was used as a reference document to know what the system should perform.
• Use Case Document – The use case document contains 24 use cases. The use cases were written in task notation [16]. The prioritization of the use cases was made in terms of the importance from a user’s point of view. Three persons acted users and prioritized the use cases before the experiment using the AHP method [23]. The fault classification is based on the same criterion for prioritization, i.e. the users are in focus. • Design Document – The design document (9 pages, 2300 words) consists of an overview of the software modules and communication signals that are sent to and from the modules. In addition, the communication between the system and the users is specified. Furthermore, the design document contains two message sequence charts (MSC) [12], which show signalling between the modules for two different cases. The faults injected during development of the taxi system were re-inserted into the design document. In the experiments, the document contained 38 faults. 30 faults were made during development of the design document and later found in inspection or testing. Eight faults were seeded by the developer of the system. • Experience Questionnaire – A questionnaire with ten questions was used to explore the students’ experiences in programming, inspections, SDL, use cases and the application domain. This information was used in the design of the experiments in order to control the different experiences among the students. • Inspection Questionnaire – After the inspection, a questionnaire was filled in to explore how well the reviewers have followed the specified inspection process and what they thought about the method used.
3.2. Fault Classification The faults are classified from the point of view of a user. They are divided into three classes depending on the importance for a user, which is a combination of the probability of the fault to manifest as a failure and the severity of the fault from a user’s point of view. • Class A faults – The functions affected by these faults are crucial for a user, i.e., the functions affected are important for a user and are often used. • Class B faults – The functions affected by these faults are important for a user, i.e., the functions affected are either important and rarely used or not as important but often used. • Class C faults – An issue that should be changed in the design, but is not an important or crucial fault. The design document contains 13 class A faults, 14 class B faults and 11 class C faults.
4. Experiment Planning 4.1. Subjects The subjects in the replication experiment were 62 fourth-year software engineering Master’s students at Blekinge Institute of Technology, taking part in a course on software testing. The experiment was a practical moment in the course with the twofold educational purpose, (a) to practice software inspections and (b) to demonstrate how empirical methods can be used in software engineering. About 70% of the students had received their Bachelor’s degree from the same institute. Those students have obtained theoretical and practical training in software development. They have participated in a series of projects in close cooperation with software organizations. The other 30% of the students received their Bachelor’s degree from different universities all around the world. In order to apply to the software engineering Master’s program, they have to pass an entrance prerequisite. This prerequisite requires studies equal to Bachelor's degree in the field of software engineering and at least one year of practical experience in the field. Since they are all Master’s students, they are all close to be working as software engineers, and therefore to some extent comparable to fresh software engineers in industry. Höst et al. [10] and Runeson [21] have studied the impact on experiment results using students as subjects. They conclude that the most important factor is that the students are in the later phase of their studies. The students in the original experiment were students from the same institute, but three years before. In that group, 85% of the students had their Bachelor’s degrees from the same institute. Due to the state of the IT market at that time, many students had part time jobs in parallel with their studies. This means that the subjects in the original experiment had more practical experience, and also had a more homogenous education background.
4.2. Variables Three types of variables are defined for the experiment, independent, controlled and dependent variables. The independent variable is the reading technique used (UBR and CBR) and the controlled variable is the experience of the students. The dependent variables are measures collected to evaluate the effect of the methods. • Independent Variable – The independent variable is the reading technique used. The experiment groups used either UBR or CBR. • Controlled Variable – The controlled variable is the experience of the reviewers and it is measured on an
ordinal scale. The reviewers were asked to fill in a questionnaire comprising ten questions. This variable is also used to compare the original experiment with the replication. • Dependent Variables – The dependent variables measured are time and faults. These are measured to calculate efficiency (faults per hour) and effectiveness (detection rate). In addition, the dependent variables are used to compare which faults are detected.
4.3. Hypotheses The same hypotheses are set up as the original experiment. The purpose of the replication is either to confirm or reject the results of the original experiment. The hypotheses are expressed in terms of efficiency and effectiveness of finding critical faults from a user’s perspective. The main alternative hypotheses of the experiment are stated below. These are evaluated for all faults, class A faults and class A&B faults. • H0Eff – There is no difference in efficiency (i.e. found faults per hour) between the reviewers using UBR and the reviewers using CBR. • HAEff – There is a difference in efficiency between the reviewers using UBR and the reviewers using CBR. • H0Rate – There is no difference in effectiveness (i.e. rate of faults found) between the reviewers using UBR and the reviewers using CBR. • HARate – There is a difference in effectiveness between the reviewers using UBR and the reviewers using CBR. • H0Fault – The reviewers using UBR do not detect different faults than the reviewers using CBR. • HAFault – The reviewers using UBR detect different faults than the reviewers using CBR. TABLE 1. Summary of hypotheses. Hypothesis Fault class
All (A+B+C)
A
A+B
Efficiency
HEff, all
HEff, a
HEff, b
Effectiveness (Rate)
HRate, all
HRate, a
HRate, b
HFault
–
–
Different (Fault)
/
4.4. Design Using the controlled variable (experience), the students were divided into three groups and then randomized within each group. One group of students had high experience in programming, inspections and use cases; one group had me-
diate level of knowledge in these subjects, and the third group had no or very limited knowledge. The blocking and randomization resulted in 31 students that applied UBR and 31 students that applied CBR. However, six students in CBR and four in UBR were removed from the analysis, since they did not complete all parts of the experiment. Thus, 27 UBR reviewers and 25 CBR reviewers were used in the data analysis. The experiment data are analyzed with the same methods as the original experiment, i.e. one-factor design [14]. Descriptive analysis and statistical tests are used [30]. The collected data were checked for normal distribution and since no such distribution could be demonstrated using normal probability plots and residual analysis, non-parametric tests are used. The Mann-Whitney test is used to investigate hypotheses HEff and HRate and a chi square test is used to test HFault [24]. The significance value of rejecting the hypotheses is set to 0.05 for all tests.
4.5. Threats to Validity A key issue when performing experiments is the validity of the results. In this section, the threats are analyzed related to four groups of threats: Conclusion validity, internal validity, construct validity and external validity [30]. Conclusion validity concerns the relation between the treatments and the outcome of the experiment, regarding statistical methods, reliability of measures and treatment implementation. The threats regarding statistical methods are low since non-parametric tests are used. These are robust and do not rely on any assumed distribution of the underlying data. The subjects themselves performed the data collection on paper; hence, there is a threat that the data is not reliable. However, the time data is reasonably under control since all subjects worked at the same time, within the given time frames. Regarding the fault data, the reported faults were filtered by one of the authors to sort out false positives in a consistent manner. The treatment implementation is also considered reliable, since the subjects were instructed on their specific reading technique only and both groups worked in parallel. Internal validity of the experiment concerns the question whether the effect is caused by the independent variables or by other factors. As both groups worked in parallel, under the same conditions, the threats regarding factors outside the experimental setting are the same for both treatments. The subjects were appointed to treatments by blocking on the experience variable; hence, both groups have the same conditions with respect to experience. The subjects who did not complete the tasks fully and hence were removed from the experiment were reasonably split among the groups (six from UBR and four from CBR).
The experiment was run on one day in December 2003, see Table 2. The individual inspection was divided into three parts, preparation, inspection and questionnaire times. The aim of these was to read the documents briefly (about 20 minutes), inspect the design document, and answering questions about the reading technique used (about 15 minutes). First, the students were given an introductory presentation of the taxi management system. The presentation included all material that was the same for both groups. Then they were divided into two groups depending on the method they were going to use during the inspection experiment. The second session included a brief presentation of the reading technique (either CBR or UBR) and a small pilot example, where the subjects used the reading technique assigned
Time
UBR
10.15 a.m. 11.00 a.m.
45 min.
12.15 p.m. 1.00 p.m.
45 min.
1.15 p.m. 5.00 p.m.
3 h 45 min.
CBR
General introduction to the Taxi Management System Introduction to UBR.
Introduction to CBR.
Individual inspection and Questionnaire (15 minutes)
to each group. During this session they were allowed, and encouraged, to ask as many questions as possible about the material and the reading technique. However, they were not allowed to discuss their reading technique with any person in the other group. Then, during four hours, the students conducted the individual inspection. The instructions and inspection package were the same as in the original experiment [27]. After the experiment had been analyzed, a debriefing session was held with the subjects. The session included a presentation and a discussion of the results of the experiment.
6. Analysis The analysis of the experiment is presented together with the data of the original experiment. The analysis section is divided into time, effectiveness and efficiency, and faults.
6.1. Preparation and Inspection Time The reviewers logged the time for preparation (reading through the documents) and inspection. In Table 3, the mean and standard deviation values of preparation, inspection and total times are shown for the replication as well as the original experiment. In the replication, UBR used slightly more time, both for preparation and inspection. This is the opposite to the original, where the CBR groups used slightly more time, both in preparation and inspection. In Table 3: Mean and standard deviation values for preparation and inspection time (minutes). Original
Mean
5. Experiment Operation
Table 2: Schedule for the Experiment.
Std. Dev.
The social threats to internal validity are reduced by not grading the results of the experiment, only the participation. The only social threat we see is that the CBR reviewers are less interested, since they have probably heard of or used this technique more than UBR. However, this would in the case they have used CBR be counterbalanced by more experience in that technique. Construct validity concerns the ability to generalize from the experiment result to the concept behind the experiment. The experiment is well defined and the artefacts are used in many different experiments, hence the constructs are well defined. The social threats are limited, since the main researchers in the study are not related to the students, but come from another university. The main threat is that these are the only artefacts used, and we cannot conclude anything on the interaction between the methods and the artefacts. Further, there is a threat of experimenter expectancies, since the authors also are the inventors of the UBR method. Only an independent replication may remove these threats [9]. External validity concerns the ability to generalize the results to industry practice. This is a matter of representativeness of the experiment setting for industrial conditions. It is clear that the artefacts are smaller that industrial ones, although the problem domain is real. Further, using students as subjects is debated. Only an industrial case study can assess the impact of those two threats. In summary, the treats to the validity are reduced as much as possible within the given design limitations. To extend the construct validity a replication has to be launched in another context with other artefacts. To extend the external validity, studies with industrial artefacts and experienced engineers should be launched. However, this would be on the cost of internal and construct validity.
Replication
UBR
CBR
UBR
CBR
Preparation
52.8
59.3
32.2
27.6
Inspection
77.1
81.1
112.6
104.5
Total
129.9
140.4
144.9
132.0
Preparation
20.4
15.5
15.9
8.4
Inspection
17.8
19.2
28.4
23.9
Total
14.5
12.4
28.8
25.1
All Faults − Standardised 14
A Faults − Standardised 14
UBR − Original CBR − Original UBR − Replication CBR − Replication
12
12
10
Number of Faults
Number of Faults
10
8
6
8
6
4
4
2
2
0
UBR − Original CBR − Original UBR − Replication CBR − Replication
0
20
40
60
80
100 Minutes
120
140
160
180
0
200
0
20
40
60
140
160
180
200
80
100 Minutes
120
140
160
180
200
A and B Faults − Standardised 14
UBR − Original CBR − Original UBR − Replication CBR − Replication
12
Number of Faults
10
8
6
4
2
0
0
20
40
60
80
100 Minutes
120
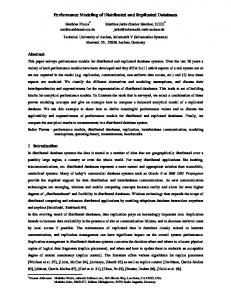
Figure 1. The figures show the faults found over time for an average reviewer. The plots are, from left to right, all faults, class A faults and class A&B faults. Preparation and inspection time are included in the figures. addition, the total time is taken into consideration when the efficiency value is calculated. In the replication, both UBR and CBR groups used less time in preparation and less time in inspection. This depends on restrictions laid on the preparation when the replication was made. The purpose of the restriction was that the reviewers should not spend too much time on preparation. Instead, they were suppose to get a basic overview of the documents and then start to inspect. The reviewers were allowed to read through the requirements and design documents at most 40 minutes and then they had to start with the inspection. This restriction led to more time was spent during inspection. Thus, the total times are in the same range for the original experiment and the replication. However,
the variance was larger in the replication than in the original experiment. In addition to preparation and inspection times, the reviewers also logged the time when a fault was found. In Figure 1, the cumulative number of faults found is plotted versus the time for an average reviewer (an average reviewer is created by standardizing the faults found by all reviewers using a certain method with the number of reviewers using that method). The plots show that UBR reviewers find more faults, more efficiently and start to find faults earlier than CBR reviewers. This is true for both the original experiment and the replication. This indicates that UBR is more efficient than CBR (in both experiments). The reviewers that applied UBR in the original experiment were more efficient than the UBR reviewers in the
Efficiency
Effectiveness 0.7
UBR CBR
UBR CBR
10 0.6
0.5
Faults found / Total
Faults found per hour
8
6
4
0.4
0.3
0.2
2 0.1
0
0 All Faults
A Faults
A & B Faults
All Faults
Figure 2. Efficiency for all faults, class A and class A&B faults. The box plot shows, from left to right, original and replication. replication. This can be seen in Figure 1 as the curve is saturated for the UBR reviewers in the original experiment, but not in the replication. This trend is also shown for the CBR reviewers when both experiments are compared. The standard deviation values of total time confirm this. There is a larger dispersion of the total times in the replication than in the original experiment. This is further discussed in Section 7.
6.2. Efficiency and Effectiveness In this section, the efficiency and effectiveness of the different treatments are evaluated. First, the replication experiment is analysed and then the result is compared to the original experiment. In Figure 2, the efficiency is shown for all faults, class A and class A&B faults. The two first box plots of each class Table 4: Efficiency and effectiveness values of UBR for the three experiments.
Effectiveness
Efficiency
Original
Replication
UBR
CBR
UBR
CBR
All faults
5.6
4.1
4.8
3.4
class A
2.7
1.3
2.1
1.1
class B
1.8
1.4
1.8
1.4
class C
0.9
1.4
0.9
0.9
All faults
0.31
0.25
0.29
0.20
class A
0.43
0.24
0.37
0.20
class B
0.31
0.24
0.30
0.20
class C
0.20
0.30
0.20
0.20
A Faults
A & B Faults
Figure 3. Effectiveness for all faults, class A and class A&B faults. The box plot shows, from left to right, original and replication. Table 5: P-values for the hypotheses. Original
Replication
Efficiency
Effectiveness
Efficiency
Effectiveness
All
0.042 (S)
0.103 (–)
0.037 (S)
0.006 (S)
A
0.013 (S)
0.036 (S)