MATLAB 4.0 is a welcome upgrade of the popular MATLAB software (the last release was .... It includes push buttons, check boxes, popup menus, radio buttons ...
A Review of MATLAB 4.0 SIAM News 26, #2, March 1993 Man Kam Kwong Mathematician Mathematics and Computer Science Division Argonne National Laboratory Argonne, IL 60439-4844 Email: kwongmcs.anl.gov
1. Introduction MATLAB 4.0 is a welcome upgrade of the popular MATLAB software (the last release was 3.5) marketed by the MathWorks, Inc. This article reviews the new features of MATLAB 4.0 and shares my experience in using the new package. Upward incompatibilities will be discussed for the bene t of those who may be worrying about how much e�ort it takes to make the transition. More details on product information can be found in the excellent documentation \New Features Guide" provided by MathWorks. I wrote a MATLAB wish list in Matlab Digest, May 1991. It stimulated several responses from other users. I am glad to see that the majority of our wishes have come true in this new release of MATLAB. I started experimenting with a beta version about a year before the product was commercially available this September. My work is done on a Sparc II workstation in an X-window environment. According to the documentation, the source code for MATLAB has been redesigned and rewritten. Fortunately, the basic rules for using the software have not changed. A user does not have to learn a new language, other than a few changes in the usage of some commands. There are simply more commands available, and the package works more e�ciently. The major categories of new commands are graphics, sparse matrix functions, low-level I/O, external interface, debugging, and on-line help.
1
2. New Features | Graphics, User Interface Controls, and Sound I found the new graphics capabilities, especially the \3-D scienti c visualization," most impressive and exciting. The \Images and Color Maps" section under demo contains ten extremely sophisticated images, including a photo of six famous people at the 1984 Gatlinburg meeting, a picture of Durer's etching, an aerial view of Cape Cod, and the face of a mandrill. Although it requires real experts and advanced equipment to produce these images, it is reassuring that MATLAB 4.0 has the capability of rendering them. For the average user, creating 3-D graphics is just as simple as using the command mesh in MATLAB 3.5. Let x and y be vectors of lengths m and n, respectively, and z be a matrix of size m � n. Then surf(x,y,z) plots the color-shaded surface having height z(i,j) at the point (x(i),y(j)); x and y are used to label the horizontal axes. The presence in MATLAB 4.0 of 3-D graphs is a big improvement over the old mesh command. When x and y are not speci ed, surf(z) uses 1:m and 1:n as the default to label the axes. With equal ease, surfc(z), surfl(z), and contour3(z) give a combination surface/contour plot, a surface plot with lighting, and a 3-D contour plot, respectively. A user can alter the viewpoint (view), shading style (shading), and color map (caxis and colormap) by issuing the appropriate command. Points and lines can be plotted in 3-D space with plot3. More primitive objects can be created with the commands line, surface, and patch. Filled 2-D and 3-D polygons are drawn with fill and fill3, respectively. The commands sphere and cylinder generate a cylinder and a sphere. A useful feature allows the user to make movies, composed of frames of graphs. After each frame is created by using the appropriate graphics commands, the statement M(:,j) = getframe stores the graph in the j th column of the matrix M. The sequence of frames can then be played back in rapid succession by the command movie(M). The speed of playback is controlled by an optional argument. I have successfully recorded movies of 100 frames each and was able to maintain three movies concurrently within one MATLAB session. The limitation is the amount of storage taken up by the huge matrices that hold the movie frames; it takes several minutes just to save or load them into/from a le When such a large matrix is involved, the only apparent, albeit minor, disappointment is that movie(M) spends a substantial initial period of time to process the entire matrix M before any action is seen on the screen. In my application, the speed of playback is not required to be high. I got around the initial waiting by using a loop to movie each column of M one after another: for j=1:100, movie(M(:,j)), end. The resulting animated motion is a bit jerky, but bearable. MATLAB 4.0 graphics have been redesigned to take advantage of object-oriented programming. Another new concept is the immediate action mode for commands 2
like axis or view that change the look of an existing graph immediately. The majority of upward incompatibilities between MATLAB 4.0 and MATLAB 3.5 involve such commands (see Section 6). MATLAB 4.0 supports multiwindow graphics. A user can create new a window with the command figure(N), where N is an integer that identi es the window number. A \graph" is made up of objects and subobjects, and a user has direct control over many properties of each object/subobject. One can regard the root object of a graph as the gure (graph window) itself (which is treated by MATLAB 4.0 as a subobject, or a child of the command window, the ultimate root object of the entire MATLAB session). Among the properties of a window that one can set are size, position, title, paper position, and color. An axis is a child of a gure. An axis can be set anywhere in the window, with custom tick-marks and other attributes, if one does not care for the defaults. A gure can have more than one axis as in the case of subplots. Children of axes include graphics objects created by individual plotting commands (such as a line, a curve, or a surface), text labels, axis labels, and the title. Each object/subobject has a handle, a real number that serves as its ID. The handle of the gure is simply the window number. The handle of the current gure and current axis can be obtained by using the commands gcf and gca, respectively. The handles of other objects are usually returned at the time of creation by the appropriate plotting statements. Alternatively, the command get(gca,'children') lists the handles of the children of the current axis. An object can then be examined (get), modi ed (set), and deleted (delete) by referring to its handle. There is a new class of graphics objects called user interface controls, to be created as children of a gure. It includes push buttons, check boxes, popup menus, radio buttons, sliders, and editable text. These allow a user to build very sophisticated menu-driven systems as demos, experiments, teaching aids, etc. I found that the easiest way to learn how to use these controls is to mimic existing programs (besides consulting the manual). A good way to start is to type out the text of the M- les demo.m, menu.m, and choices.m. Look for other M- les mentioned in demo.m that use interface controls. On a Sparc station or a Macintosh, one can create some realistic sound e�ects, samples of which can be heard in the demo. Users can set their own pace to acquire the skill of using these powerful features. In the meantime, the old-fashioned graphics commands work mostly as before, albeit faster. I note, however, that MATLAB 4.0 graphics behaves di�erently when new objects are plotted on an existing graph, when hold is on. To certain people, this new behavior may be undesirable. In older versions, when a new curve is superimposed on an existing graph, the latter stays displayed on the screen, whereas in MATLAB 4.0, the graph window blacks out for a short moment and then the new graph, with the added object, is displayed. This feature makes it di�cult to 3
simulate animation by drawing and erasing objects; the continual ashing of the graph can be very annoying. It is mentioned in the \New Features Guide," p. 18, that \animation can be performed � � � with clever use of the EraseMode property of line objects." But the manual explanation of EraseMode under line does not contain enough information on how this can be achieved. One can look into the demos lorenz and life to see how it is done.
3. New Features | Sparse Matrix Functions Sparse matrices abound in numerical analysis. Special numerical methods have been developed to take advantage of their structure to conserve memory and to gain speed. However, it is usually not a simple job for a nonspecialist to nd the correct software for a particular purpose and for a particular sparsity type. MATLAB 4.0 comes to the rescue. It has a new data structure for storing sparse matrices and has a new command sparse for creating a matrix that is sparse. A user gives only the locations and values of the nonzero entries. Once such a matrix is de ned, the user can pretty much forget that it is sparse, because it can be manipulated and used in exactly the same way as any other ordinary matrix. For instance, to nd the LU factors of a matrix A, one uses the usual command [L,U]=LU(A) no matter whether A is full or sparse. MATLAB 4.0 will automatically pick the optimal algorithm to give the answer. Full and sparse matrices can be mixed in expressions. The command spy(A), displays the sparsity structure of A graphically. It is useful in visualizing the change in sparsity structure when matrices are being manipulated. Other commands particularly meant for sparse matrices include reordering algorithms, number of nonzero entries (nnz), allocated memory for nonzero entries (nzmax), test for sparsity (issparse), and 1-norm and 2-norm estimates. For further details of MATLAB 4.0's rich sparse matrix capabilities see the article J. R. Gilbert, C. B. Moler and R. S. Schreiber, Sparse matrices in MATLAB: Design and implementation, SIAM J. Matrix Anal. Appl., 13 (1992), pp. 333{356.
4. New Features | File I/O Functions File I/O functions are low-level functions modeled on the corresponding C statements. A user can now open (fopen returns an integer to be used as an ID when referring to the le) and close (fclose) a le, for reading, writing, or appending. Unformatted (binary) data can be read from (fread) or written to (fwrite) an opened le quickly, thus enabling fast communication between MATLAB and external programs. In the past, MATLAB could communicate with external programs only through formatted ascii les (slow access time) or .mat les (complicated for 4
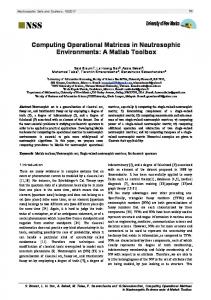
ordinary users to create). Other le-handling commands are ferror, fseek, ftell, and frewind. I have successfully used these commands to import data continuously from an external program for plotting in MATLAB. More speci cally, the project involves solving the time-dependent Ginzburg-Landau equations, the solution being computed at equally spaced time steps. The aim is to plot the solution at each step in real time as the data are being computed. In practice, the equations are solved by an external C or Fortran program (for speed, the program is run on a separate machine and perhaps with parallelization), and the data are sent to an output le in binary form in time-step installments. The MATLAB program looks for this le and, when its presence is detected, renames the le, freads the data, and displays it. The renaming step is needed so that MATLAB does not read the same le twice; the next time the presence of the output le is detected, it has to contain data from the next time step. The use of binary les has two advantages. The rst is speed. The second is that the external program does not have to know that the data is to be used by MATLAB, and so it does not have to be modi ed to conform to any speci c MATLAB formats. For additional exibility in formatted output, MATLAB 4.0 has the C-style commands fscanf, fprintf, fgetl, fgets, sprintf, and fscanf. The procedures to write dynamically linked MEX- les and data MAT- les have been revised. There are new include les and extensive C and Fortran interface libraries. The user should consult the manual volume \External Interface Guide."
5. Other New Features A user can now debug a function M- le by setting breakpoints in the le. Debugging for script M- le is not available, however. The statement dbstop at 9 in FILE (issued in the command window) sets a breakpoint at (actually just before) line 9 in the M- le FILE.m. This means that when the function FILE is invoked, execution will stop prior to execution of line 9. A user can then examine variables in the local workspace. Values of variables in workspaces of parent calling function M- les can also be accessed by moving through the ancestral tree with dbup and dbdown. The command dbstack yields information on who calls whom. Execution of the M- le can be resumed with dbcont, or stepped through with dbstep, or terminated with dbquit. Current breakpoints can be listed with dbstatus and, when debugging is done, cleared with dbclear. I found the new smart command-recalling feature very convenient. Typing one or more characters before pressing the (upward or downward) arrow keys recalls from the history stack the nearest command that starts with the speci ed characters. 5
The online help facility has been improved. Help information is organized by directory | a user can provide a table-of-contents le in each directory, or else the rst line of each M- le in the directory is displayed. A new command lookfor KEYWORD prints the rst line of all M- les that contain KEYWORD. Another command, which COM, prints the full pathname of the M- le COM.m that is being used. This is useful when there are con icting M- le names in di�erent directories and the user wishes to make sure that the correct one is being invoked. The command more on turns on a pager for long output (similar to the DOS command more). The search path for M- les can now be set and modi ed within MATLAB by using the path command. This feature is useful to a user who needs to vary the path environment for projects organized in di�erent directories. He/she simply includes an appropriate path statement in the startup.m le in the directory concerned. MATLAB 4.0 provides an alternative way to invoke a function when all the arguments are string constants: fun s1 s2 ... is equivalent to fun('s1','s2',...). The new way resembles a MATLAB command with arguments, and thus enables a user to create MATLAB-type commands. By browsing through the manual volume \Reference Guide," one can nd many new functions that extend the computational capabilities of MATLAB.
6. Upward Incompatibilities Everyone who contemplates switching to MATLAB 4.0 from MATLAB 3.5 has this question in mind: Will my old programs still run in the new system? If you do not use graphics and global variables, the chances are that 95% of them will run without change. Some may run with warning messages that certain commands or the usage of certain commands is obsolete. These commands (examples are ones, eye, rand, meta, sc2dc, and dc2sc), or particular uses of them, still work now but may be eliminated in future versions. How much e�ort is needed to convert those programs that do not run under MATLAB 4.0? Not too much, according to my own experience. If one uses global variables, one must now declare each global variable in each function M- le that uses it, in addition to a declaration in the base workspace (unless the variable is meant to be shared only among functions and not with the base workspace). See also Section 7 for changes necessitated by a bug rather than incompatibility. Line continuation now requires three periods instead of two. Inside a function, matrices are no longer initialized to be empty, and they must therefore be explicitly 6
initialized. Scripts called within a function now use the local workspace rather than the base workspace. When issued within an M- le, a plotting statement does not lead to immediate display on the screen. It takes e�ect only when a pause statement or the end of the M- le is encountered. If there is more than one plotting statement before pause or the end of le, only the result from the last statement is displayed. To force an immediate display, one must add a drawnow command after each plotting statement. The same is true for plotting statements embedded in a composite interactive command issued in the command window. For example, for i=1:10, plot(...), end displays only the last graph. To display all ten graphs in succession, one uses for i=1:10, plot(...), drawnow, end. The command axis(v), where v is a vector specifying the four axis limits, now takes immediate e�ect and redraws an existing graph with the new axis limits. Furthermore, the command has no e�ect on the next plotting command. In older versions, axis a�ects all subsequent plots while an existing plot stays put on the screen. In order to produce the same e�ect, an axis(v) statement in a 3.5 program should be taken out, and a copy of the statement inserted right after each subsequent plotting command before the next axis command. Personally, I like the immediate mode of axis but I miss the convenience of not having to specify the axis limits for each subsequent plot. Perhaps in a future version, MATLAB will have a command faxis(v) that freezes the axis for subsequent plots until instructed otherwise. In 3.5, axis, with no argument, toggles the axis state of auto or frozen limits. In 4.0, if hold is not on, there is no frozen-limit state, and so 4.0 has eliminated this usage of axis; axis now only returns the value of the current axis limits. The command hold lets subsequent plots be added to the current graph. Unlike its predecessor in 3.5, it does not freeze the axis limits to those of the current plot. When new objects are added, the axis limits are autoscaled to accommodate the entirety of all new objects. Frozen limits can be requested by issuing the command axis(v) under hold. To freeze the axis limits at the current settings, one uses axis(axis) after hold on. To resume autoscaling but still retaining hold, one uses axis('auto'). Subplots are creating as before by using the statement subplot(m,n,p), which chooses the pth subplots from a lattice of m�n subplots in the current gure window. In 3.5, once a graph is drawn in a subplot, the next subplot automatically becomes the current subplot. In 4.0, this is no longer true; the chosen current subplot remains in e�ect until a new subplot statement is issued. Thus, explicit subplot statements must be inserted in old programs where the choice of current subplot is decided by autocycling. A few commands, including contour and mesh, show the plot upside down 7
compared to MATLAB 3.5 . One can correct these by ipping the matrices involved with flipud or use the command axis ij to ip the axis and its labels. Also, the ordering of the argument list for contour has been changed from contour(z,n,x,y) to contour(x,y,z,n) and from contour(z,v,x,y) to contour(x,y,z,v). The meta and !gpp commands for saving and printing a graph are now replaced by print, which can send a graph directly to the printer or to a le (either in postscript or encapsulated postscript form).
7. Bugs Bugs for new products are unavoidable. So far I have encountered three (there are certainly a few more that I have not found yet). MathWorks has informed me that a x is either available or will be soon. Two of the bugs occur rarely. They concern respectively the creation of a MEX le from a C program and the confusion of a local variable name with an existing function name when an eval command is used inside a function M- le. The third concerns global variables in a function M- le. If a global variable appears at the beginning of an arithmetic expression, it is handled properly. If it appears elsewhere in an expression, however, its value sometimes is inadvertently taken to be the empty matrix. Until the bug has been eliminated, if a global variable must used in the middle of an expression, one should replace it with a temporary variable and insert before that statement a command which assigns the value of the global variable to the temporary variable. Acknowledgment. This work was supported by the Applied Mathematical Sciences subprogram of the O�ce of Energy Research, U.S. Department of Energy, under Contract W-31-109-Eng-38.
8
Density of super electrons
density
0.25 0.2 0.15 0.1 0.05 0 3 2.5 2 5
1.5
4 1
3 2
0.5 length
0
1 0
width
9