18th European Signal Processing Conference (EUSIPCO-2010)
Aalborg, Denmark, August 23-27, 2010
A ROBUST TARGET SIGNAL DETECTOR BASED ON STATISTICAL MODELS USING BINAURAL CROSS-SIMILARITY INFORMATION Myung Jong Kim1, Sung Joo Lee2, Hoirin Kim3, and Hyung Soon Kim4 1
Department of Information and Communications Engineering, Korea Advanced Institute of Science and Technology (KAIST) 119, Munjiro, Yuseong-gu, 305-600, Daejeon, Republic of Korea phone: +82-42-350-6221, fax: +82-42-350-6245, email:
[email protected] 2 Speech and Language Information Research Division, Electronics and Telecommunicaions Research Institute (ETRI) 161, Gajeong-dong, Yuseong-gu, 305-350, Daejeon, Republic of Korea phone: +82-42-860-5732, fax: +82-42-860-4889, email:
[email protected] 3 Department of Electrical Engineering, Korea Advanced Institute of Science and Technology (KAIST) 119, Munjiro, Yuseong-gu, 305-600, Daejeon, Republic of Korea phone: +82-42-350-6139, fax: +82-42-350-6245, email:
[email protected] 4 Department of Electrical Engineering, Pusan National University (PNU) San 30, Jangjeon-dong, Geumjeong-gu, 609-735, Pusan, Republic of Korea phone: +82-51-510-2452, fax: +82-51-515-5190, email:
[email protected]
ABSTRACT This paper represents a robust target signal detector using two microphones. Most of target signal detection (TSD) algorithms incorporate with microphone arrays (MAs), and their basic assumption is that the location of target acoustic source is known. Therefore, target signal portions can be identified by exploiting the spatial information of the target location which is inherent in the binaural input signals. The proposed TSD employs a target signal absence probability (TSAP) estimation method that is statistically derived from the likelihood ratio test (LRT). A series of tests are conducted to evaluate the performance by comparing with a typical TSD method based on signal-to-interference-plusnoise ratios (SINRs). The experimental results show that the proposed method significantly outperforms the conventional TSD method in low SINR and vehicular noise environments. 1.
INTRODUCTION
Acoustic sound enhancement with interference reduction has attracted a great deal of a research interest for many years and still receives attention due to widespread applications such as telecommunications, hands-free communications, hearing aids, and so on. Since hands-free situation allows more comfortable and interactive user interface, hands-free user interface becomes popular in ubiquitous computing and networking environments. However, the signal quality in a hands-free environment tends to be poor due to distant installation of an input transducer system. This distant microphone cause weak acoustic wave as the wave propagation distance is increased in the air. And the acquired sound quality tends to be contaminated by reverberation or interference. Although hands-free situation is not desirable for acoustic sound acquisition, MAs enable a high-quality and comfortable sound acquisition due to the capability to suppress interfering signals. And they also have potential to replace a head-mounted or desk-stand mi-
© EURASIP, 2010 ISSN 2076-1465
crophone for acquiring speech data in many applications. Recently, widespread use of mobile telephones in a car has created a demand for hands-free installations. Therefore, MAs have received a great attention since they enable high noise-reduction performance with a small number of microphones arranged in small space [1]. Among the component technologies in MAs, TSD plays an important role such as adaptive mode controller (AMC) in the generalized side-lobe canceller [2][3]. In many MA applications, it is assume that the direction of target acoustic source is known such as hands-free telephone conversation in a car. Therefore, the target signal portions can be separated by exploiting the spatial information of the target location [4][5]. Furthermore, this target signal portion identification can be useful in detecting speech starting and ending points for voice recognition in an adverse environment. Since the traditional TSD algorithms are usually designed using heuristics, it is difficult to optimize the relevant parameters [6][7]. The traditional TSD methods with a fixed threshold often fail in tracking the spatial information of the target signal in noisy environment. And this target tracking failure is likely to limit the TSD accuracy [6][7]. In the traditional TSD methods, a threshold calibration by an expert needs to be followed to achieve high TSD accuracy when acoustic environment is changed. In this paper, we introduce a statistical model-based TSD method using binaural cross-similarity between filterbank output pairs. The normalized cross-correlation (NCC) of binaural filter-bank output pairs is considered as a crosssimilarity feature. Since it is assumed that the location of the target source is already known and the two-channel MA is steered at the target location, it can be said that the location of the target source is always in the front. In this work, the proposed TSD scheme is based on statistical TSAP, which is derived from the LRT and this statistical modelbased decision rule does not require any further threshold
2082
calibration depending on the application environment changes. The remainder of the paper is organized as follows: The typical TSD algorithm based on SINRs is described in Section 2. In Section 3, the proposed TSD method based on statistical models is explained in detail. The implementation and performance evaluation of the proposed algorithm are presented in Section 4. Finally, our conclusions are summarized in Section 5. 2.
TRADITIONAL TSD METHOD BASED ON SINR ESTIMATION
The traditional TSD methods are fundamentally based on the spatial information between target and interference source. The already reported TSD methods can be roughly separated into two technical branches. One is based on SINR comparison using a fixed acoustic beam-former (BF) and a blocking matrix (BM) [6], and the other is to identify target signal portions from the input by exploiting binaural cross-similarity [8]. Since the proposed method is based on binaural cross-similarity, the typical TSD method based on SINR in [6] is implemented for the performance comparison. Since a car interior environment includes two types of interferences (diffused and look directional interferences), we modified the original algorithm to cope with the interferences at the same time. Driving noises can be classified into diffused interference and the car audio sounds are characterised as look direction interferences. Figure 1 shows the block diagram of the modified TSD system. As shown in Figure 1, the power density of diffused interference signal is estimated by combining the fixed BF and the BM outputs, and the target signal portions among the input are identified by simple SINR comparison. The details of the fixed acoustic BF and the BM used in this work can be found in [9]. The power of interference signal from the other directions except the pre-defined look direction is obtained by using BM output signal as follows: 1 N 1 2 (1) PowBM (i ) y ( M i k ) N k 0 where N is the frame size, M is the frame shift size, i is a frame index and y(.) indicates output signal from the BM. The power density of the non-look-direction interference signal is calculated throughout the following equation: (2) Pd (i) d Pd (i 1) (1 d ) PowBM (i), 0 d 1 The diffused or look-direction interference signal power is attained by subtracting the non-look-direction interference signal power from the fixed beam-former output in the interference portion as follows: (3) Powdif (i ) MAX {( PowBF (i ) PowBM (i )), 0} The power density of diffused interference signal can be attained by the following equation in the interference region: Pdif (i) d Pdif (i 1) (1 d ) Powdif (i) (4) , if SINR(i) th , 0 d 1 where θth denotes the threshold for updating power density of diffused interference signal. The logarithmic SINR of the i-th frame is calculated by the following equation:
PowBF (i ) (5) SINR(i ) MAX log ,0 P ( i ) P ( i ) d dif Finally, target signal frames are separated from the input by the following equation: if SINR(i) d 1, (6) TSD otherwise 0, where θd denotes the threshold for decision making. The threshold should be chosen by a heuristic manner according to the background noise condition.
Figure 1 – Block diagram of the modified TSD method based on SINR
3.
THE PROPOSED TSD METHOD
We adopt statistical model concept to TSD algorithm using binaural cross-similarity. Since spatial sparseness assumption can be employed in a car environment, the NCCs of binaural filter-bank output pairs are considered as a statistically independent identically distributed Gaussian random process. The basic hypotheses are as follows: H 0 : Target Signal Absent
H1 : Target Signal Present The conditional probability of the NCC is obtained by the following equation (7): 2 1 Rx , x i, k mN ,k PRx1 , x2 i, k | H 0 exp 1 2 N ,k (7) N , k
2 Rx , x i, k mI ,k exp 1 2 I ,k I ,k where Rx1 , x2 i, k indicates the binaural NCC between the k-
P Rx1 , x2 i, k | H 1
1
th filter-bank output pair at the i-th frame index. λN , k is the variance of the NCC of interference signal on the k-th filterbank output. λI , k is the variance of the NCC of input signal (target and interference signal) on the k-th filter-bank output. mN , k and mI , k indicate the mean of the NCC of interference and input signal, respectively. The likelihood ratio of the conditional probabilities for the k-th frequency band at the ith frame can be obtained as follows:
2083
i ,k
P( Rx1 , x2 (i, k ) | H 1 ) P( Rx1 , x2 (i, k ) | H 0 )
(8)
N ,k Rx , x (i, k ) m N ,k Rx , x (i, k ) mI ,k exp I ,k N ,k I ,k Finally, the target signal absent probability (TSAP) is obtained by the following equation (9): 2
1
2
2
1
2
P( H 0 | Rx1 , x2 (i )) M
P( H 0 ) P( Rx1 , x2 (i, k ) | H 0 ) k 1
M
M
k 1
k 1
P( H 0 ) P( Rx1 , x2 (i, k ) | H 0 ) P( H1 ) P( Rx1 , x2 (i, k ) | H1 )
(9)
1 M
1 q i ,k k 1
in which q is the ratio defined by q
P( H1 ) P( H 0 )
(10)
Finally, target signal frames are identified among the input as follows: if P( H 0 | Rx1, x 2 (i)) p 1, (11) TSD 0,
otherwise
Since the threshold value of the proposed method is a probability value, it can be chosen more easily when compared to the conventional TSD methods. The mean and variance for the k-th filter bank output at the i-th frame index are obtained by using the moving average scheme as follows: 1 L mI ,k (i) Rx1 , x2 (i l , k ), L l 0 (12) L 1 I ,k (i) Rx1 , x2 (i l , k ) mI ,k (i) 2 , L l 0 where L is the number of the frames for long term estimation. The mean and variance estimation on interference only portions is done recursively as follows: mN ,k (i ) m mN ,k (i 1) (1 m )mI ,k (i ) (13) N ,k (i ) v N ,k (i 1) (1 v )I ,k (i ),
if P( H 0 | Rx1 , x2 (i )) update
where 0 m 1 and 0 v 1 are the smoothing parameter and θupdate denotes the threshold for updating mean and variance at the interference only frames. In addition, the mean and variance of interference and input signals are initialized using first fifteen frame signals. Figure 2 shows the block diagram of the proposed method. As shown in Figure 2, the binaural input signals are analyzed by filter banks. And then the NCCs between the binaural filter-bank output pairs are estimated. After estimating the statistical properties of the background interferences, target signal portions among the input are identified by TSAP.
Figure 2 – Block diagram of the proposed TSD method
4.
IMPLEMENTATION AND EVALUATION
In this section, the realization and performance evaluation of the proposed method are explained. The proposed TSD method is implemented in time-domain and in frequencydomain, and evaluated by comparing the TSD accuracy with the typical TSD method in section 2. 4.1 Implementation of the proposed TSD method The proposed TSD algorithm can be realized in two different domains. One is in time-domain and the other is in frequency-domain. In order to test the TSD accuracy of the proposed method, we implement the algorithm in both the domains. For the algorithms implementation in time-domain, 5 channel filter-banks are applied. The centre frequencies of the filter bank are linearly spaced from 1 kHz to 6 kHz and the bandwidth is 1 kHz. In order to preserve the signal characteristics in each pass-band, Butterworth type IIR filters are served for the filter-bank signal decomposition. The number of tabs is 4. After the filter-bank analysis, the signals are framed for cross-similarity estimation. The frame size and the frame shift are 40ms, 10ms, respectively. And then, the time-domain NCC values of the binaural filter-bank output pairs are obtained by the following equation (14): N T 1
Rx1 , x2 (i, k )
x n 0
i,k 1
(n) x2i , k (n)
1 / 2 N 1 T
N T 1 i , k 2 x1 (n) n0
(14) 1/ 2
2 i,k x2 (n) n0
where x1i, k (n) and x2i, k (n) represent the n-th temporal signals for the k-th frequency band and i-th frame of the first and second microphone, respectively. And NT is the number of signals of a frame. For the frequency-domain implementation, the binaural input signals are framed for short-time spectrum analysis. The frame size and frame shift size for this task are 32ms
2084
and 10ms, respectively. After Hanning windowing procedure, fast Fourier transform is applied for the filter-bank analysis. 5 channel filter banks are equally spaced from 1 kHz to 6 kHz. The NCC values are calculated as follows: Mk
R X1 , X 2 (i, k )
X i, j X i, j
j Nk
* 2
1
1/ 2
(15) 1/ 2
2 2 X 1 i, j X 2 i, j j Nk j Nk where X1(i, j) and X2(i, j) indicate the j-th spectral signals at the i-th frame of the first and second microphone, respectively, and Nk and Mk denote the starting and ending frequency component for the k-th frequency band, respectively. And * indicates a complex conjugate. Mk
Mk
(a) band1
band2
band3
band4
band5
200
250
1
NCC
0.5
0
-0.5
50
100
150 Frames
(b) 1
TSAP
0.8 0.6 TSAP threshold 0.4 0.2 0
50
100
150 Frames
200
250
(c) TSD results
1
TSD result hand-marked 0
50
100 Frames150
200
250
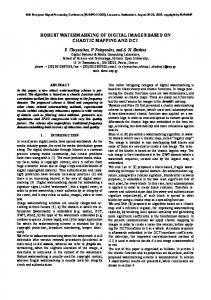
ues are relatively higher and the TSAP values are lower in target signal portions. The comparison of TSD results with manual target signal segmentation are shown in Figure 3(d). The comparison result indicates that the TSD accuracy of the proposed method is fairly good in the presence of ambient noise. 4.2 Performance evaluation Recently, the demand on hands-free installations in automobile is on the rise due to the user requirement on driving safety and convenience. Therefore, the performance evaluation is conducted in car environment and TSD accuracy is measured. In order to compare the performance of the proposed method, the modified TSD method based on SINR estimator are implemented and tested. For the test speech database acquisition, two microphones are equipped on the centre fascia in C-class sedan, which was manufactured by Hyundai Motors and the distance between the microphones is 4 cm. For the target signal acquisition, phonetically balanced Korean words are played from a small speaker in the cockpit. The speaker is located in the front of the microphones. The sound of moving car at medium speed (60~80 km/h) is recorded for an hour and this kind of engine noise is diffused by the car interior. In order to obtain non-look directional interference signals, a song is played throughout the car audio installation and this sound is emitted from the four surround speakers which are already equipped in the car. The diffused and directional interference signals are randomly added to the target speech samples in order to attain noisy signals in various SINR conditions. Total number of the speakers who are engaged in this experiment is 10 (6 males and 4 females), and 10 utterances per each speaker are mixed to obtain noisy signal samples in various SINR conditions. In this experiment, the performance comparison between the traditional and the proposed TSD method is conducted in the aspect of target signal detection probability (PTSD) and false-alarm probability (PFA). Figure 4 shows the receiver operating characteristics (ROC’s), which shows the trade-off relationship between the PTSD and PFA at 0 dB and 5 dB SINR. As shown in Figure 4, both the proposed methods outperform the modified TSD method based on SINR. It is also shown that the proposed time-domain TSD method is superior to the frequencydomain method due to its fine frequency resolution. In this work, the threshold of p 0.2 and update 0.4 is set for the proposed time-domain approach and the threshold of p 0.4 and update 0.5 is for the proposed frequency-
(d) Figure 3 – Sample results at each step of the proposed timedomain TSD method at 10 dB SINR in the front target source location. (a) Spectrogram of noisy input signal. (b) NCC values from filter bank (c) TSAP (d) TSD accuracy comparison with manual target signal segmentation.
Since the frequency resolution of the time-domain implementation is superior to the frequency-domain implementation, it is expected that the TSD accuracy of the time-domain implementation may be better than the frequency-domain implementation. Figure 3 shows sample results at each step of the proposed time-domain TSD method. Since the target source is located in the front, it is shown that the NCC val-
domain approach. In both the implementations, the smoothing factors, m v 0.98 are chosen. Long term window of fifteen frames are used for the temporal mean and variance estimation using moving average technique. All the experimental results in various SINR conditions are summarized in Table 1. Table 1 indicates that both the proposed TSD methods are superior to the conventional SINR-based TSD method in various SINR conditions. Especially, the proposed time-domain method shows robust TSD performance even in the presence of severe interfering signals. In the TSD algorithm implementations, we do not consider hang-over or
2085
median filtering procedure for improving the detection performance. Target Signal Detection Probability
1 0.9 0.8 0.7 0.6 0.5 Conventional TSD method based on SINR Proposed TSD method in time domain. Proposed TSD method in freq. domain.
0.4 0.3 0
0.1
0.2
0.3
0.4
0.5
False Alarm Probability
(a)
based on binaural cross-similarity between the filter-bank output pairs is exploited. And TSAP is derived from the LRT using a statistical model. Then, the target signal portions are separated from the noisy input by simple TSAP comparison method. We have implemented the proposed TSD idea in two domains: One is time-domain and the other is frequency domain. In order to evaluate the performance of the proposed method, a series of simulation tests are conducted in the aspect of PTSD and PFA under various car interior environments. The experimental results indicate that the proposed method superior to the traditional TSD method and shows robust TSD performance, even in the presence of severe interfering signals. Future work will include the investigation of a number of state-of-the-art TSD methods in terms of speech distortion, SINR improvement, and average speech recognition rate. 6.
Target Signal Detection Probability
1
This work was supported by the IT R&D program of MKE/IITA[2006-S-036-03, Development of large vocabulary/interactive distributed/embedded VUI for new growth engine industries] and the MEST/NRF[2010-0013288, Research on multiple speech signal indexing robust to environmental distortion].
0.9 0.8 0.7 0.6 0.5
REFERENCES Conventional TSD method based on SINR Proposed TSD method in time domain. Proposed TSD method in freq. domain.
0.4 0.3 0
ACKNOWLEDGEMENTS
0.1
0.2
0.3
0.4
0.5
False Alarm Probability
(b) Figure 4 – Receiver operating characteristics of the conventional TSD based on SINR and the proposed method. (a) 5 dB SINR. (b) 0 dB SINR. Table 1 – PTSD and PFA (%) of the proposed and SINR-based TSD method in various SINRs. Proposed TSD Proposed TSD TSD method method Methods method based on SINR (Frequency (Time Domain) Domain) SINR PTSD PFA PTSD PFA PTSD PFA 20 dB 81.24 12.22 97.67 4.30 95.98 8.00 15 dB 81.75 19.00 95.73 2.95 85.25 11.65 10 dB 74.38 13.96 91.20 1.04 88.61 7.48 5 dB 72.70 22.96 87.06 0.65 82.01 14.09 0 dB 53.04 19.18 75.93 6.74 76.97 9.74 -5 dB 47.47 40.84 67.27 3.00 49.93 12.83
However, since the experimental results show that the PFA of the proposed methods are maintained at various SINRs, it is expected that the TSD accuracy of the proposed method can be improved simply by adding hang-over or median smoothing procedure. 5.
CONCLUSIONS
In this paper, a novel TSD method based on statistical models is introduced. In order to identify target signal portions among the noise-corrupted input, the spatial information
[1] O. Hoshuyama and A. Sugiyama, “A robust adaptive beamformer for microphone arrays with a blocking matrix using constrained adaptive filters,” in Proc. ICASSP 1996, Atlanta, Georgia, USA, May 7-10. 1996, pp. 925–928. [2] M. Brandstein and D. Ward, Microphone Arrays, Springer, 2001. [3] S. Y. Low, N. Grbic, and S. Nordholm, “Robust microphone array using subband adaptive beamformer and spectral subtraction,” in Proc. 8th IEEE ICCS 2002, Singapore, November 25-28. 2002, pp. 1020–1024. [4] I. Cohen and B. Berdugo, “Multichannel signal detection based on the transient beam-to-reference ratio,” IEEE Signal Processing Letters, vol. 10, no. 9, pp. 259–262, Sep. 2003. [5] I. Potanitis, “Estimation of speech presence probability in the field of microphone array,” IEEE Signal Processing Letters, vol. 11, no. 12, pp. 956–959, Dec. 2004. [6] O. Hoshuyama, B. Begasse, A. Sugiyama, and A. Hirano, “A realtime robust adaptive microphone array controlled by an SNR estimate,” in Proc. ICASSP 1998, Seattle, Washington, USA, May 12-15. 1998, pp. 3605–3608. [7] Y. Jung, H. Kang, C. Lee, D. Youn, C. Choi, and J. Kim, “Adaptive microphone array system with two-stage adaptation mode controller,” IEICE, vol. E88-A, no. 4, pp. 972– 977, Apr. 2005. [8] J. E. Greenberg and P. M. Zurek, “ Evaluation of an adaptive beamforming method for hearing aids,” J. Acoust. Soc. Am., vol. 91, no. 3, pp. 1662–1676, Mar. 1992. [9] L. J. Griffiths and C. W. Jim, “An alternative approach to linear constrained adaptive beamforming,” IEEE Transaction on antennas and propagation, vol. AP-30, no.1, pp. 27– 34, Jan. 1982.
2086