Automatic Signal Segmentation based on Abrupt Change Detection for Power Systems Applications A. Ukil, Student Member, IEEE and R. Živanović Member, IEEE
Abstract—Detection of abrupt changes in the signal parameters can be used to segment the signal. This has been particularly useful in automatic disturbance recognition in power systems, where the signals are first segmented eventspecifically and processed subsequently to recognize and analyze the faults. This paper describes several abrupt change detection based segmentation algorithms and their applications in the power systems. The applications include automatic disturbance recognition, synchronization, relay performance analysis etc, where recorded signals from the power network in South Africa have been used. Index Terms—Automatic signal segmentation, Abrupt change detection, Power systems disturbance analysis.
A
I. INTRODUCTION
BRUPT change detection based automatic signal segmentation plays a significant role in recognitionoriented signal processing. The aim is to detect the abrupt changes in the signal model parameters and segment the signal accordingly. In this paper, we discuss the applications of abrupt change detection based signal segmentation for applications in the power systems. With the introduction of the digital recording technology, e.g., digital fault recorders (DFRs) at the moment engineers in power utilities have more data than can be processed and assimilated in the time available. However, analysis of disturbance records from the DFRs is becoming increasingly important and critical to prevent power failures, black-outs and the like. So, we propose an automated analysis system for the automatic disturbance recognition and analysis, based on the real disturbance recordings obtained from the power network in South Africa. In the direction towards an automated recognition-oriented task, we would first apply the abrupt changes detection algorithms to segment the fault recordings into different segments. Then we would construct the appropriate feature vectors for the different, specific segments; finally patternmatching algorithm would be applied using those feature vectors to accomplish the disturbance recognition and analysis tasks [1]. This work was supported in part by the National Research Foundation (NRF), South Africa. A. Ukil is with Tshwane University of Technology, Pretoria, 0001, South Africa (phone: +27-72-736-9557; fax: +27-12-460-7440; e-mail:
[email protected]). R. Živanović is with Tshwane University of Technology, Pretoria, 0001, South Africa (e-mail:
[email protected]). .
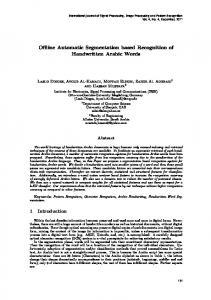
In this paper, we mainly focus on the first step towards the proposed automatic disturbance analysis, namely, the abrupt change detection based segmentation. We present the different algorithms of abrupt change detection based automatic signal segmentation, many different applications and proposed futuristic developments. II. ABRUPT CHANGE DETECTION TECHNIQUES This project is done in collaboration with South African power utility, Eskom, to augment the existing semiautomatic fault analysis system at Eskom with more robust and accurate algorithms and techniques to make it fully automated. Presently, 98% of the transmission lines are equipped with the digital fault recorders which trigger due to reasons like, power network fault conditions; protection operations; breaker operation and the like [2]. After the signals are read from DFRs, following IEEE COMTRADE standard [3], we would apply the abrupt changes detection algorithms to segment the fault recordings into different segments for further effective processing. These are described below. A. Wavelet Transform Technique The authors have already presented detail description of the abrupt change detection using the wavelet transform and threshold checking in [4]. We apply the Multiresolution Signal Decomposition (MSD) [4] technique and Quadrature Mirror Filter (QMF) [4] banks to decompose the fault signals from the DFRs into localized and detailed representation in the form of wavelet coefficients. Daubechies 1 and 4 wavelets [4] are used as the mother wavelets. After transforming the original fault signal using the mother wavelets and discrete wavelet transform, we obtain the smoothed and detailed versions. The detailed version, called the wavelet transform coefficient, is used for threshold checking to estimate the change time-instants. As wavelet coefficients are the changes of the averages, so a coefficient of large magnitude implies a large change in the original signal [4]. The change time-instants can be estimated by the instants when the wavelet coefficients exceed a given threshold which is equal to the ‘universal threshold’ of Donoho and Johnstone [4] to a first order of approximation. Fig. 1 shows the segmentation result for the fault signal, sampled at a sampling frequency of 2.5 kHz, obtained from the DFRs during a phase-to-ground fault. In Fig. 1, the original DFR recording for the current during the fault in the
RED-Phase is shown in the top section, wavelet coefficients for this fault signal (in blue) and the universal threshold (in black, dashed) are shown in the middle section and the change time-instants computed using the threshold checking (middle section) followed by smoothing filtering is shown in the bottom section. The signal segments effectively indicate the different events during the fault, e.g., segment A indicates the pre-fault section and the fault inception, segment B indicates the fault, segment C indicates opening of the circuit-breaker, segment D indicates auto-reclosing of the circuit-breaker and system restore.
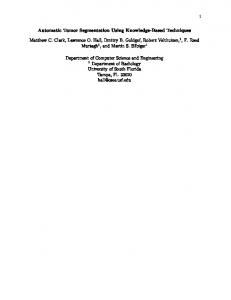
earlier ones) at time t − 1 . The gain K (t ) determines in what way the current prediction error y (t ) − yˆ (t ) affects the update of the parameter estimate. An optimal choice of the gain K (t ) can be computed using the Kalman filter [2]. Fig. 2 shows the segmentation result for the RED Phase fault signal, using recursive identification. In Fig. 2, the upper plot shows the original DFR recording for the current during a phase-to-ground fault in the RED-Phase. The middle plot shows the modelling of the system using recursive identification technique. The lower plot shows the timeinstants of the changes in the signal characteristics, marked by the impulse indicators, indicating the different signal segments owing to different events during the fault, e.g., segment A indicates the pre-fault section and the fault inception, segment B indicates the fault, segment C indicates opening of the circuit-breaker, segment D indicates autoreclosing of the circuit-breaker and system restore [2].
Fig. 1. Segmentation of the RED-Phase current signal using Wavelet Transform technique.
B. Recursive Identification Technique The authors also proposed system identification based approach for abrupt change detection in [1],[2], which uses recursive identification method. In the proposed Recursive Identification technique, several parallel Kalman filters are used to estimate the signal parameters. Each of them corresponds to a particular assumption about when the system actually changed. The relative reliability of these assumed system behaviors is constantly judged, and unlikely hypotheses are replaced by new ones. A typical recursive identification algorithm is:
θˆ(t ) = θˆ(t − 1) + K (t )[ y (t ) − yˆ (t )] θˆ(0) = θ 0 ,
(1)
where θˆ(t ) is the estimate of the parameter vector θ at time t , and y (t ) is the observed output at time t . yˆ (t ) is a prediction of the value y (t ) based on observations up to time t − 1 and also based on the current model (and possibly also
Fig. 2. Segmentation of the RED-Phase current signal using Recursive Identification technique.
C. Adaptive Abrupt Change Detection The proposed wavelet transform and recursive identification techniques are effective for about 60% of the disturbance signals, having distinct abrupt changes in the signal model parameters. However, about 40% of the disturbance signals do not show distinct abrupt changes in the signal parameters [2]. In those cases, we have to apply adaptive abrupt change detection, based on adjusted ‘Haar’ wavelet technique [2],[5]. In general, the FIR scaling filter for the Haar wavelet looks like h = 0.5 [1 1] , where 0.5 is the normalization factor. As adjustment and hence improvement of the characteristics of the Haar wavelet, we propose to introduce 2n number of zeroes in the Haar wavelet scaling filter, keeping
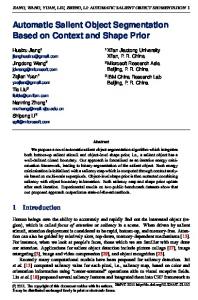
the first and last coefficients 1 (n is the set of positive integers). Following the orthogonality property for the scaling filter, the filter length has to be even [5]. So, we have to introduce 2n number of adjusting zeroes, n being the adjustment parameter. The Haar wavelet corresponds to n = 0 . The introduced additional zeroes in the filter kernel have zero coefficients. The authors have shown mathematically in [5], that the introduction of the adjusting zeroes do not violate the key wavelet properties like compact support, orthogonality and perfect reconstruction. It has also been proven mathematically that the introduction of the 2n number of adjusting zeroes to the Haar wavelet scaling filter improves the frequency characteristics of the adjusted wavelet function by an order of 2n+1, by decreasing the strong ripples [5]. Adjusted Haar Wavelet technique has been successfully applied for segmenting disturbance signals not showing distinct abrupt changes. One such example is shown in Fig. 3, where the voltage signal from a phase-to-ground fault is segmented into pre- and post-fault segments, (segments A and B respectively), which could not be achieved using the standard algorithms.
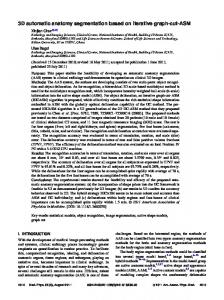
Fig. 4. Top-down architecture of the complete segmentation algorithm.
Disturbance signal read module reads the COMTRADE [3] data file. The read signal is effectively represented using the different algorithms next. This is followed by threshold checking [2],[4] to perform the segmentation. Heuristic smoothing filtering [1],[2],[4] is applied to validate the segmentation. The decision making algorithm optimizes the selection of signal representation algorithms for the best possible result considering the specific disturbance signal to be processed. If segmentation is incorrect and needs to be refined, decision making algorithm chooses the proper signal representation algorithm and performs the segmentation again and until it is ok. E. Comments on Algorithms All the algorithms are tested and validated using real disturbance signals. The algorithms are implemented using MATLAB®. An Intel® Celeron® 1.9 GHz, 256 MB RAM computer was used for all the application tests. Table-I shows the performance of different algorithms.
Fig. 3. Segmentation of the voltage signal during a phase-to-ground fault using Adjusted ‘Haar’ Wavelet technique.
D. Complete Algorithm The complete segmentation algorithm utilizes all the individual algorithms developed above in an optimized manner. The complete algorithm is tested and optimized using real disturbance signals, to perform segmentation for every kinds of disturbance signals originating from power systems faults. Fig. 4 shows the architectural block diagram of the complete algorithm [2]. The sequential blocks are: 1. Disturbance Signal Read Module, 2. Signal Representation Algorithms, 3. Threshold Checking Algorithm, 4. Heuristic Smoothing Filtering, 5. Decision Making Algorithm.
TABLE I PERFORMANCE OF DIFFERENT ALGORITHMS
III. APPLICATIONS A. Event-specific Signal Segmentation The primary application of the automatic segmentation is for automatic disturbance recognition. Due to the eventspecific segmentation of the disturbance signals, we can
concentrate on the specific segments in the subsequent operating, e.g., feature vector construction and pattern matching, instead of processing the whole signal. This improves the accuracy, recognition rate, performance time [2]. Examples of this are shown above in section II (Fig. 1-3). B. Synchronization Usually many DFRs, employed for different distance protection zones, trigger for any abnormal condition in the power network. All these simultaneous recordings must be synchronized before any further global analysis to prevent any erroneous analysis. The authors discussed the synchronization technique and its application in [6]. C. Relay Performance Monitoring Using the synchronized, segmented disturbance recordings, performance of the protective relays can be effectively monitored as discussed in [6]. Parameters like fastest relay operating time, auto-reclosing length of the circuit-breakers can be estimated and main-1 & main-2 relay operation can be monitored. D. Additional Disturbance Analysis Analysis of certain kinds of disturbances can be performed directly from the segmented recordings before conforming to any further significant and complex feature vector analysis [7]. These include cleared and uncleared single-phase faults, circuit-breaker re-strike, reactor ring down, capacitive voltage transformer (CVT) transient behavior, energizing of a transformer. E. Analysis of Power Signals from Mexican Network Ruiz-Vega, Messina & Enriquez-Harper discussed about the use of nonlinear, non-stationary analysis techniques to characterize forced inter-area oscillations problem in power systems, recorded in the Mexican interconnected system [8]. In collaboration with them, we also tested our segmentation algorithms on the power oscillation signals obtained from the Mexican interconnected system (MZD-DGD). Fig. 5 shows the result of the test using the adjusted ‘Haar’ wavelet method.
IV. FUTURE WORK A. On-line Abrupt Change Detection The abrupt change detection algorithms presented in this work is intended for off-line operation. However, the accuracy, speed of operation of the segmentation algorithm(s) are quite good. So, a possible future endeavour can be on-line signal segmentation as the first step towards on-line disturbance recognition and analysis. B. Early Disturbance Prediction and Prevention Abrupt change detection based segmentation is quite critical for successful and reliable automated disturbance recognition and analysis. However, the whole analysis is done after the disturbance or fault actually occurred. This can also be extended along with on-line detection procedures, to detect any anomaly early in the power network signals, which can possibly lead to certain disturbances. Prediction of the possibility of disturbances beforehand can be of great help preventing them before they happen, and the great dangers of black-outs. Related studies were done by Thottan & Ji [9] using abrupt change detection, statistical analysis and pattern matching together for anomaly detection in the IP networks to predict and prevent them. V. CONCLUSION Abrupt change detection based automatic signal segmentation is quite critical for power systems disturbance analysis. The algorithms and applications described in this paper show the prospective uses of abrupt change detection based automatic signal segmentation as the first processing step in recognition oriented signal processing. REFERENCES [1] [2]
[3] [4] [5] [6] [7] [8] Fig. 5. Segmentation of the power oscillation signal from Mexican power network, using adjusted ‘Haar’ wavelet method.
[9]
A. Ukil and R. Živanović, “Detection of Abrupt Changes in Power System Fault Analysis: A Comparative Study,” in Southern African Univ. Power Engg. Conf., Johannesburg, South Africa, Jan 2005. A. Ukil, “Application of Abrupt Change Detection in Automatic Disturbance Recognition in Electrical Power Systems,” Ph.D. dissertation, Dept. Math. Tech, Tshwane Univ. of Tech, Pretoria, South Africa, 2005. IEEE Standard Common Format for Transient Data Exchange (COMTRADE) for Power Systems, IEEE Standard C37.111-1991, Version 1.8, Feb 1991. A. Ukil and R. Živanović, “Abrupt Change Detection in Power System Fault Analysis using Wavelet Transform,” in International Power Systems Transient Conf., Montréal, Canada, Jun 2005. A. Ukil and R. Živanović, “Adjusted Haar Wavelet for application in the Power Systems Disturbance Analysis.,” EURASIP Journal of Applied Signal Processing, submitted for publication. A. Ukil and R. Živanović, “Application of Abrupt Change Detection in Relay Performance Monitoring,” in International Universities Power Engineering Conf., Cork, Ireland, Sept 2005. A. Ukil and R. Živanović, “Application of Abrupt Change Detection in Power Systems Disturbance Analysis & Relay Performance Monitoring,” IEEE Trans. Power Delivery, submitted for publication. D.R. Vega, A.R. Messina, and G.E. Harper, “Analysis of Inter-area Oscillations via Non-linear Time Series Analysis Techniques,” in Power Systems Computation Conf., Liege, Belgium, Aug 2005. M. Thottan and C. Ji, “Anomaly Detection in IP Networks,” IEEE Trans. Signal Processing, vol. 51, pp. 2191–2204, Aug 2003.